


文章目录
1.Zabbix监控Nginx
1.1 监控Nginx什么内容
-
- 监控Nginx状态(stub_status)
-
- 监控进程存活,端口探测;(设定触发器)
-
- 监控Nginx访问日志(建议使用ELK)
-
- 监控Nginx错误日志(设定触发器)
1.2 如何监控Nginx状态
-
- 启用Nginx stub_status状态模块
-
- 使用curl命令获取stub_status状态模块
-
- 将获取nginx状态的数据方法封装为监控项
1.3 Nginx状态监控
1.3.1 环境准备
| 角色 | IP |
|---|---|
| Zabbix-Server | 192.168.20.46 |
| web | 192.168.20.47 |
1.3.2 启用Nginx状态模块
[root@web01 ~]# cat /home/app/nginx/conf.d/status.panpancar.com.conf
server {
    listen 80;
    server_name status.panpancar.com;


    location /ngx_status {
	stub_status;
	access_log off;
	allow 127.0.0.1;
	deny all;

    }
}
1.3.3 编写采集状态脚本
- 测试访问状态模块是否正常
[root@web01 nginx]# curl -H Host:status.panpancar.com 127.0.0.1/ngx_status
Active connections: 1
server accepts handled requests
 12 12 12
Reading: 0 Writing: 1 Waiting: 0

Nginx状态解析:
Active connections     活跃连接数
accepts                总的TCP连接数
handled                已处理的TCP连接数
requests               已处理的请求数
Reading                已发送的Header数
Writing                已接收的Header数
Waiting                等待连接数
Keep-alive的情况下,Waiting这个值等于active - (reading + writing)
请求丢失数=(握手数-连接数)可以看出,本次连接状态显示没有丢失请求
- 编写取值脚本
[root@web01 ~]# cat  /etc/zabbix/zabbix_agent2.d/nginx_status.sh
#!/bin/bash

domain="status.panpancar.com"
uri_path=/ngx_status


case $1 in
    active)
	curl -s -HHost:${domain} http://127.0.0.1/${uri_path} | awk 'NR==1 {print $NF}'
	;;

    accepts)
	curl -s -HHost:${domain} http://127.0.0.1/${uri_path} | awk 'NR==3 {print $1}'
	;;
    handled)
	curl -s -HHost:${domain} http://127.0.0.1/${uri_path} | awk 'NR==3 {print $2}'
	;;
    requests)
	curl -s -HHost:${domain} http://127.0.0.1/${uri_path} | awk 'NR==3 {print $3}'
	;;
    Reading)
	curl -s -HHost:${domain} http://127.0.0.1/${uri_path} | awk 'NR==4 {print $2}'
	;;
    Writing)
	curl -s -HHost:${domain} http://127.0.0.1/${uri_path} | awk 'NR==4 {print $4}'
	;;
    Waiting)
	curl -s -HHost:${domain} http://127.0.0.1/${uri_path} | awk 'NR==4 {print $6}'
	;;
    *)
	echo "Usage $0 { active|accepts|handled|requests|Reading|Writing|Waiting}"
esac
1.3.4 添加自定义的监控项
[root@web01 ~]# cat /etc/zabbix/zabbix_agent2.d/nginx_status.conf
UserParameter=nginx.status[*],/bin/bash /etc/zabbix/zabbix_agent2.d/nginx_status.sh $1

[root@web01 ~]# /etc/init.d/zabbix-agent2 restart
Shutting down Zabbix agent 2:                              [确定]
Starting Zabbix agent 2:
1.3.5 服务端测试取值
[root@zabbix-server ~]# zabbix_get -s 192.168.20.47 -k nginx.status[active]
1
[root@zabbix-server ~]# zabbix_get -s 192.168.20.47 -k nginx.status[requests]
28
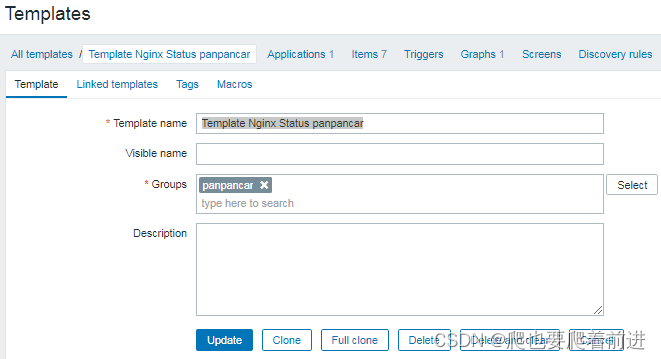
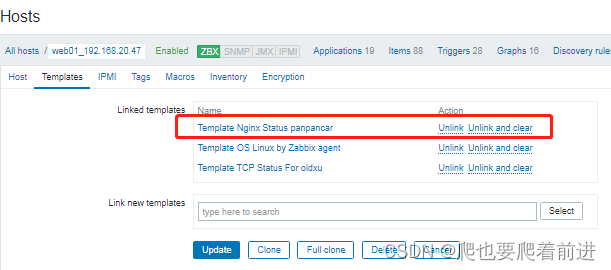
1.3.6 配置Zabbix-web
1.创建模版
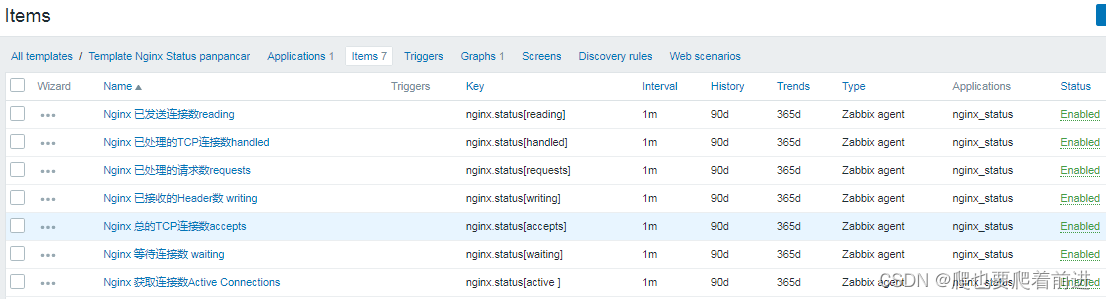
2.创建监控项
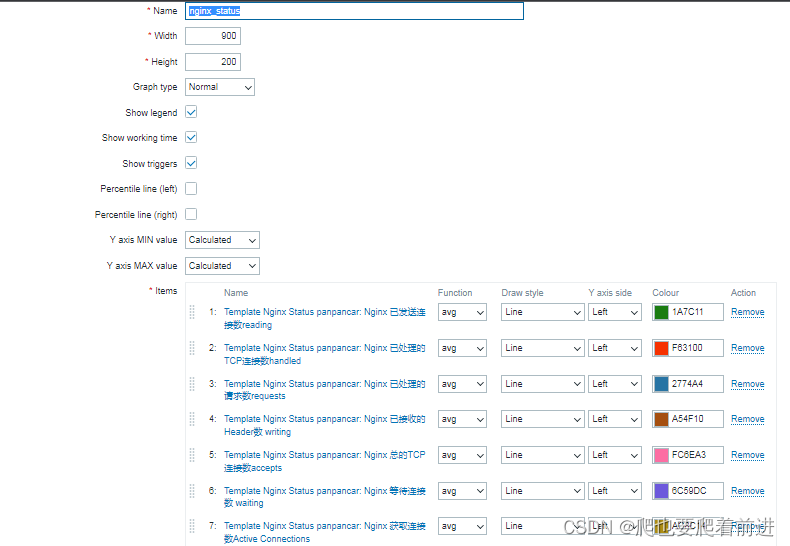
3.创建图形
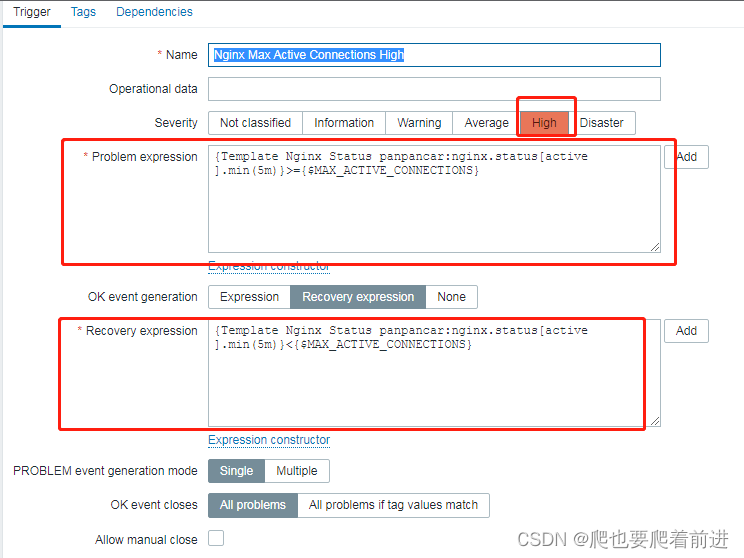
4.创建触发器(设定监控项)
5.关联对应主机
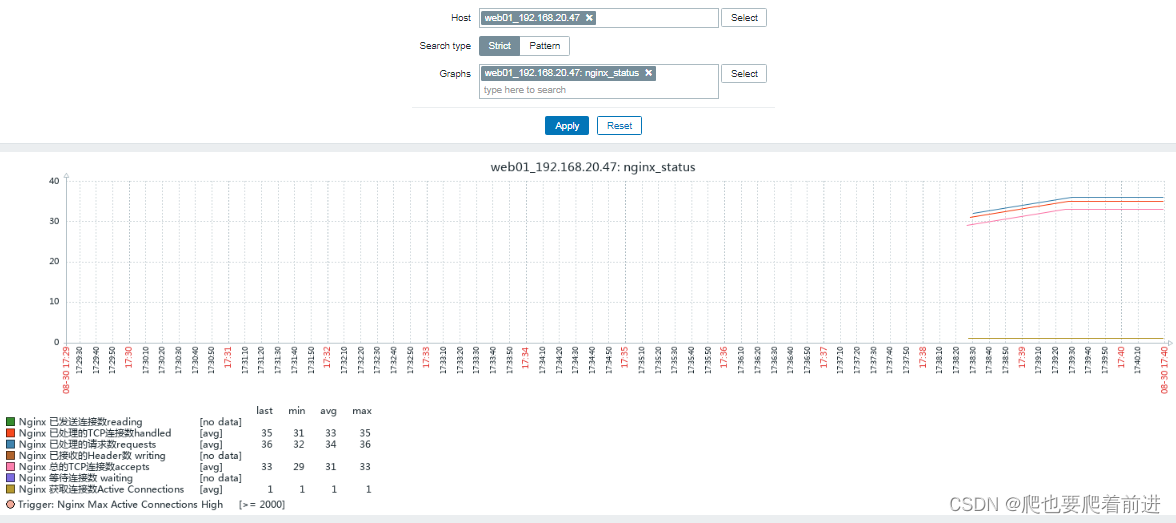
访问测试脚本
[root@web01 ~]# cat curl.sh
#!/bin/bash


index=0

while true
do
	index=[ $index+1 ]
	for i in $(seq $(echo $RANDOM));
	do
		curl http://192.168.20.47 &> /dev/null
	done

	sleep 2
	if [ $index -eq 200 ];then
		exit
	fi
done
1.4 Nginx错误日志监控实践
1.4.1 如何监控错误日志
使用zabbix内置的log监控模块完成监控
- log[file,<regexp>,<encoding>,<maxlines>,<mode>,<output>,<maxdelay>,<options>]
- file: 文件要绝对路径
- regexp: 要匹配的关键字,可以使用正则表达式
- maxlines: 发送的行数,默认配置文件定义为20行
- mode: 可填参数:all(默认),skip(跳过旧数据)
- output: 自定义格式输出,默认输出regexp匹配的整行数据
1.4.2 配置Agent为主动模式
[root@web01 ~]# vim /etc/zabbix/zabbix_agent2.conf
ServerActive=192.168.20.46
[root@web01 ~]# /etc/init.d/zabbix-agent2 restart
Shutting down Zabbix agent 2:                              [确定]
Starting Zabbix agent 2:
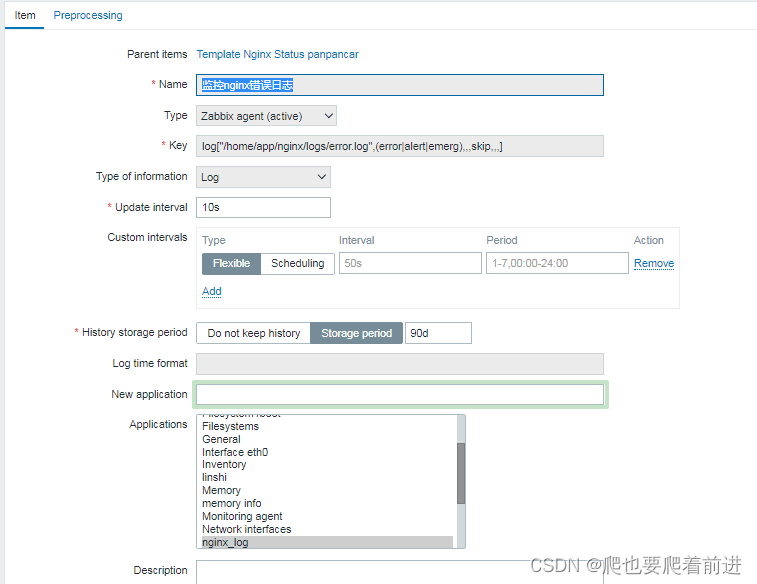
1.5.3 添加监控项
log这个key是存在主动模式下
key:log[“/home/app/nginx/logs/error.log”,(error|alert|emerg),skip,]
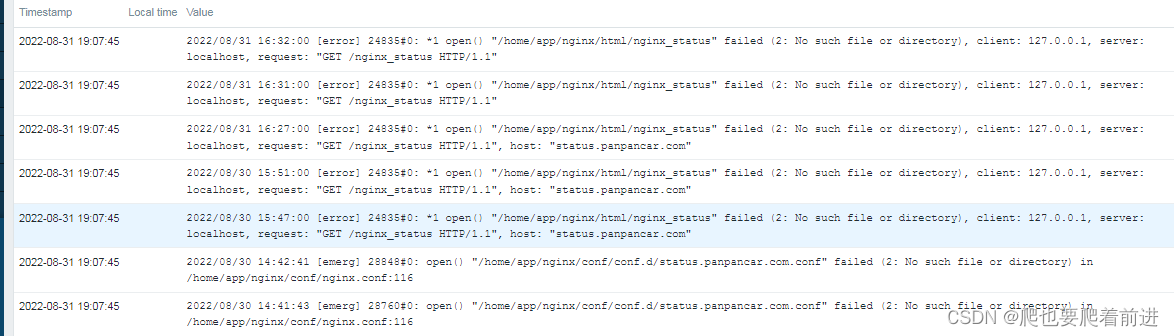
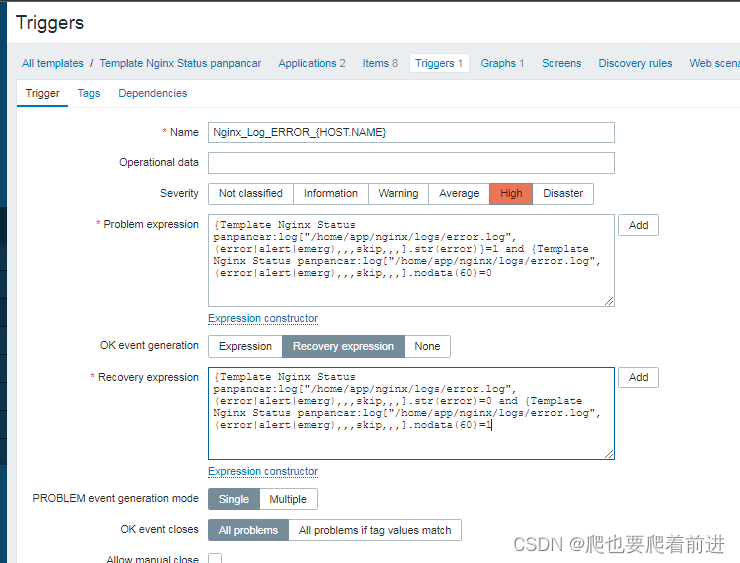
1.5.4 配置触发器
发现error,并且日志有数据则触发警告
恢复:没有发现error,并且日志60秒内没有新数据


 1283
1283


 被折叠的 条评论
为什么被折叠?
被折叠的 条评论
为什么被折叠?
 到【灌水乐园】发言


