


参考:使用Prometheus+Grafana实时监控服务器性能_wespten的博客-CSDN博客_grafana监控服务器
1、下载prometheus源码包
下载地址:https://github.com/prometheus/prometheus/releases/download/v2.19.3/prometheus-2.19.3.linux-amd64.tar.gz
2、解压源码包
[root@localhost updates]# tar -xf prometheus-2.19.3.linux-amd64.tar.gz
[root@localhost updates]# mv prometheus-2.19.3.linux-amd64/ ../prometheus
[root@localhost home]# cd prometheus/
[root@localhost prometheus]# ./prometheus --version
prometheus, version 2.19.3 (branch: HEAD, revision: 657ba532e42f1db8d7c77bf802378643da0d3118)
  build user:       root@b99e50bced7c
  build date:       20200724-12:20:53
  go version:       go1.14.6
3、修改prometheus.yml文件,确定启动ip
[root@localhost prometheus]# vim prometheus.yml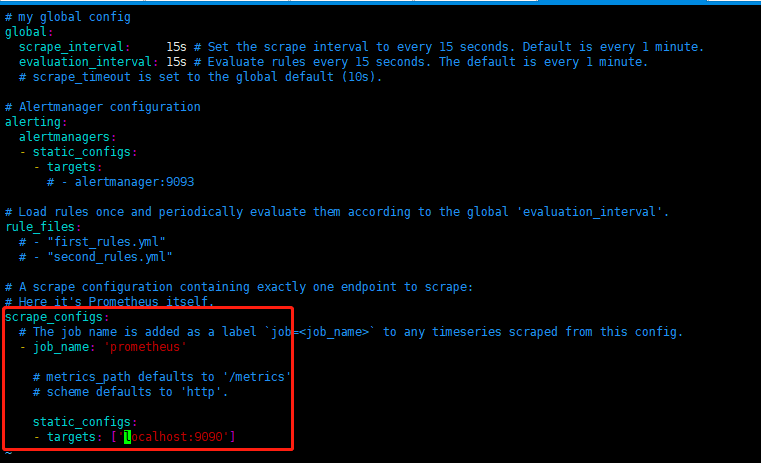
配置文件补全后如下
# my global config
global:
  scrape_interval:     15s # Set the scrape interval to every 15 seconds. Default is every 1 minute.
  evaluation_interval: 15s # Evaluate rules every 15 seconds. The default is every 1 minute.
  # scrape_timeout is set to the global default (10s).

# Alertmanager configuration
alerting:
  alertmanagers:
  - static_configs:
    - targets:
      # - alertmanager:9093

# Load rules once and periodically evaluate them according to the global 'evaluation_interval'.
rule_files:
  # - "first_rules.yml"
  # - "second_rules.yml"

# A scrape configuration containing exactly one endpoint to scrape:
# Here it's Prometheus itself.
scrape_configs:
  # The job name is added as a label `job=<job_name>` to any timeseries scraped from this config.
  - job_name: 'prometheus'

    # metrics_path defaults to '/metrics'
    # scheme defaults to 'http'.

    static_configs:
    - targets: ['10.2.2.236:9090']


  - job_name: 'centos7-machine1'
    scrape_interval: 10s
    static_configs:
      - targets: ['10.2.2.12:9100']
        labels:
          instance: node1

  - job_name: 'centos7-machine2'
    scrape_interval: 10s
    static_configs:
      - targets: ['10.2.2.14:9100']
        labels:
          instance: node2

  - job_name: 'centos7-machine3'
    scrape_interval: 10s
    static_configs:
      - targets: ['10.2.2.80:9100']
        labels:
          instance: node3

  - job_name: 'centos7-machine4'
    scrape_interval: 10s
    static_configs:
      - targets: ['10.2.2.236:9100']
        labels:
          instance: node4

  - job_name: 'centos7-machine5'
    scrape_interval: 10s
    static_configs:
      - targets: ['10.2.3.245:9100']
        labels:
          instance: node5
4、配置服务配置文件
[root@localhost ~]# vim /usr/lib/systemd/system/prometheus.service

[Unit]
Description=Prometheus
Documentation=https://prometheus.io/
After=network.target


[Service]
# Type设置为notify时,服务会不断重启
Type=simple
User=root
# --storage.tsdb.path是可选项,默认数据目录在运行目录的./dada目录中
ExecStart=/usr/local/prometheus/prometheus --config.file=/usr/local/prometheus/prometheus.yml --storage.tsdb.path=/home/software/prometheus-data
Restart=on-failure
[Install]
WantedBy=multi-user.target
5、启动服务
[root@localhost prometheus]# systemctl enable prometheus
Created symlink from /etc/systemd/system/multi-user.target.wants/prometheus.service to /usr/lib/systemd/system/prometheus.service.
[root@localhost prometheus]# systemctl start prometheus
[root@localhost prometheus]# systemctl status prometheus
● prometheus.service - Prometheus
   Loaded: loaded (/usr/lib/systemd/system/prometheus.service; enabled; vendor preset: disabled)
   Active: active (running) since Mon 2020-07-27 15:27:21 CST; 8s ago
     Docs: https://prometheus.io/
 Main PID: 30412 (prometheus)
   CGroup: /system.slice/prometheus.service
           └─30412 /home/gridcloud/prometheus/prometheus --config.file=/home/gridcloud/prometheus/prometheus.yml --storage.tsdb.path=/home/gridcloud/prometheus/prometheus-data

Jul 27 15:27:21 ip-10-2-2-236.ap-southeast-1.compute.internal prometheus[30412]: level=info ts=2020-07-27T07:27:21.075Z caller=web.go:524 component=web msg="Start listening for connections" address=0.0.0.0:9090
Jul 27 15:27:21 ip-10-2-2-236.ap-southeast-1.compute.internal prometheus[30412]: level=info ts=2020-07-27T07:27:21.075Z caller=main.go:678 msg="Starting TSDB ..."
Jul 27 15:27:21 ip-10-2-2-236.ap-southeast-1.compute.internal prometheus[30412]: level=info ts=2020-07-27T07:27:21.078Z caller=head.go:645 component=tsdb msg="Replaying WAL and on-disk memory mappable chunks if any, this may take a while"
Jul 27 15:27:21 ip-10-2-2-236.ap-southeast-1.compute.internal prometheus[30412]: level=info ts=2020-07-27T07:27:21.079Z caller=head.go:706 component=tsdb msg="WAL segment loaded" segment=0 maxSegment=0
Jul 27 15:27:21 ip-10-2-2-236.ap-southeast-1.compute.internal prometheus[30412]: level=info ts=2020-07-27T07:27:21.079Z caller=head.go:709 component=tsdb msg="WAL replay completed" duration=545.192µs
Jul 27 15:27:21 ip-10-2-2-236.ap-southeast-1.compute.internal prometheus[30412]: level=info ts=2020-07-27T07:27:21.080Z caller=main.go:694 fs_type=XFS_SUPER_MAGIC
Jul 27 15:27:21 ip-10-2-2-236.ap-southeast-1.compute.internal prometheus[30412]: level=info ts=2020-07-27T07:27:21.080Z caller=main.go:695 msg="TSDB started"
Jul 27 15:27:21 ip-10-2-2-236.ap-southeast-1.compute.internal prometheus[30412]: level=info ts=2020-07-27T07:27:21.080Z caller=main.go:799 msg="Loading configuration file" filename=/home/gridcloud/prometheus/prometheus.yml
Jul 27 15:27:21 ip-10-2-2-236.ap-southeast-1.compute.internal prometheus[30412]: level=info ts=2020-07-27T07:27:21.082Z caller=main.go:827 msg="Completed loading of configuration file" filename=/home/gridcloud/prometheus/prometheus.yml
Jul 27 15:27:21 ip-10-2-2-236.ap-southeast-1.compute.internal prometheus[30412]: level=info ts=2020-07-27T07:27:21.082Z caller=main.go:646 msg="Server is ready to receive web requests."
6、打开prometheus的web ui界面
1)Statu-->Configuration展示prometheus.yml的配置,如下

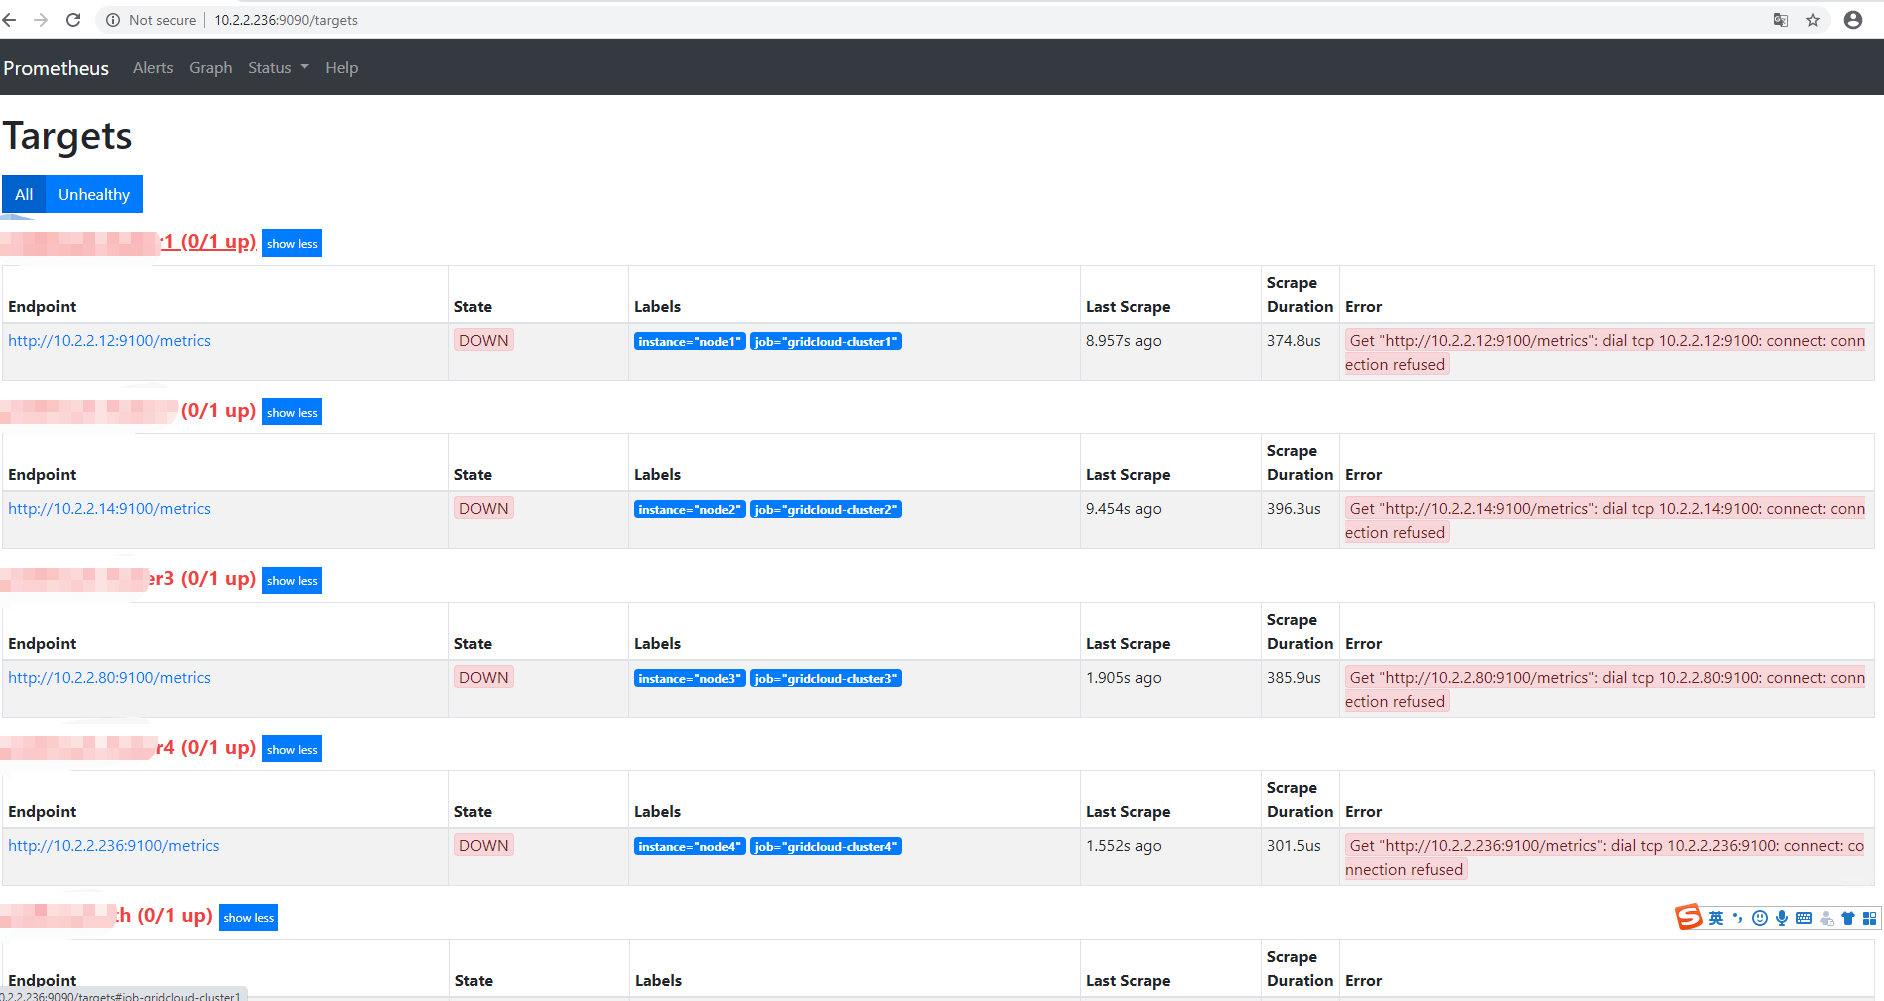
2)Statu-->Targets展示监控具体的监控目标
系统还没有监控到,一会安装插件
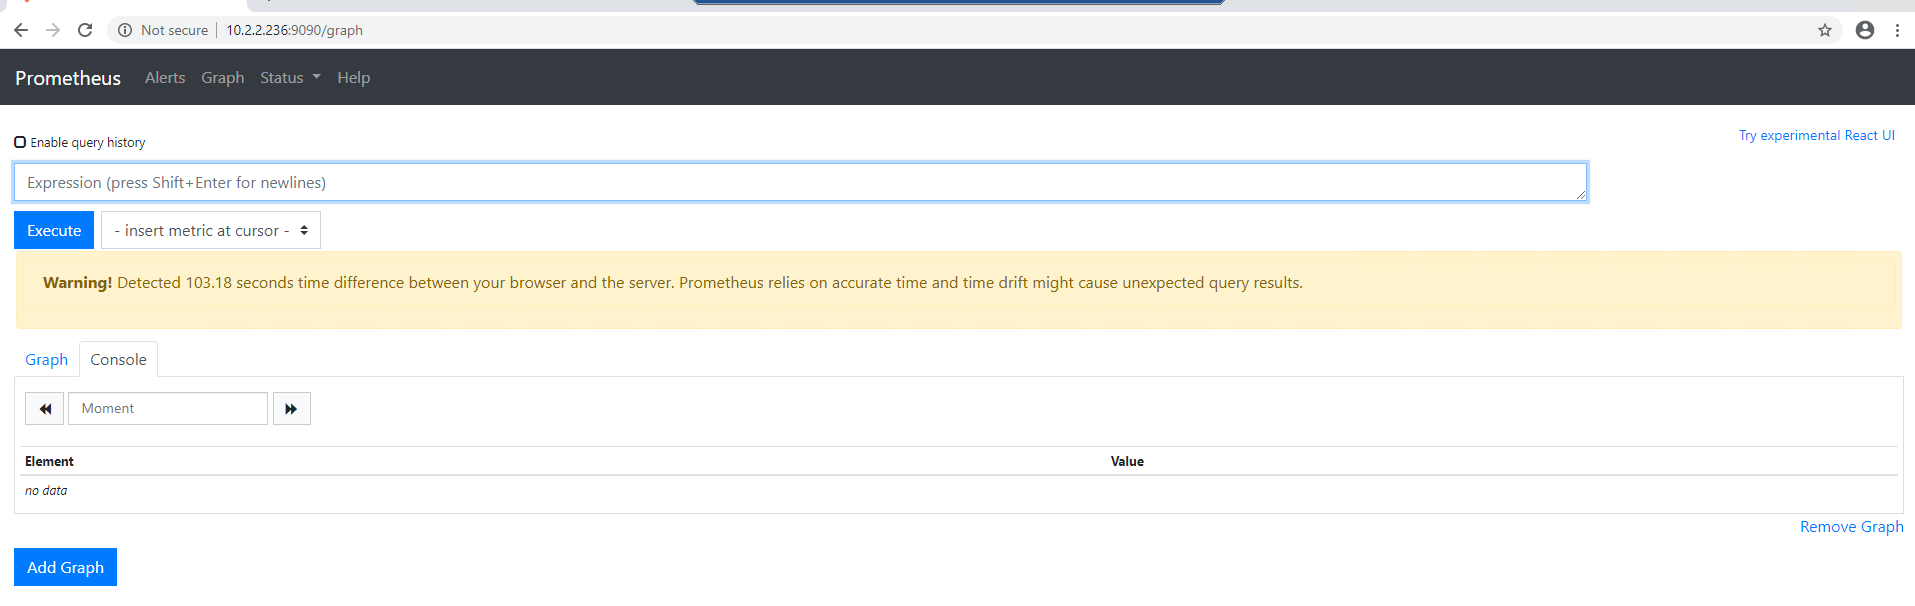
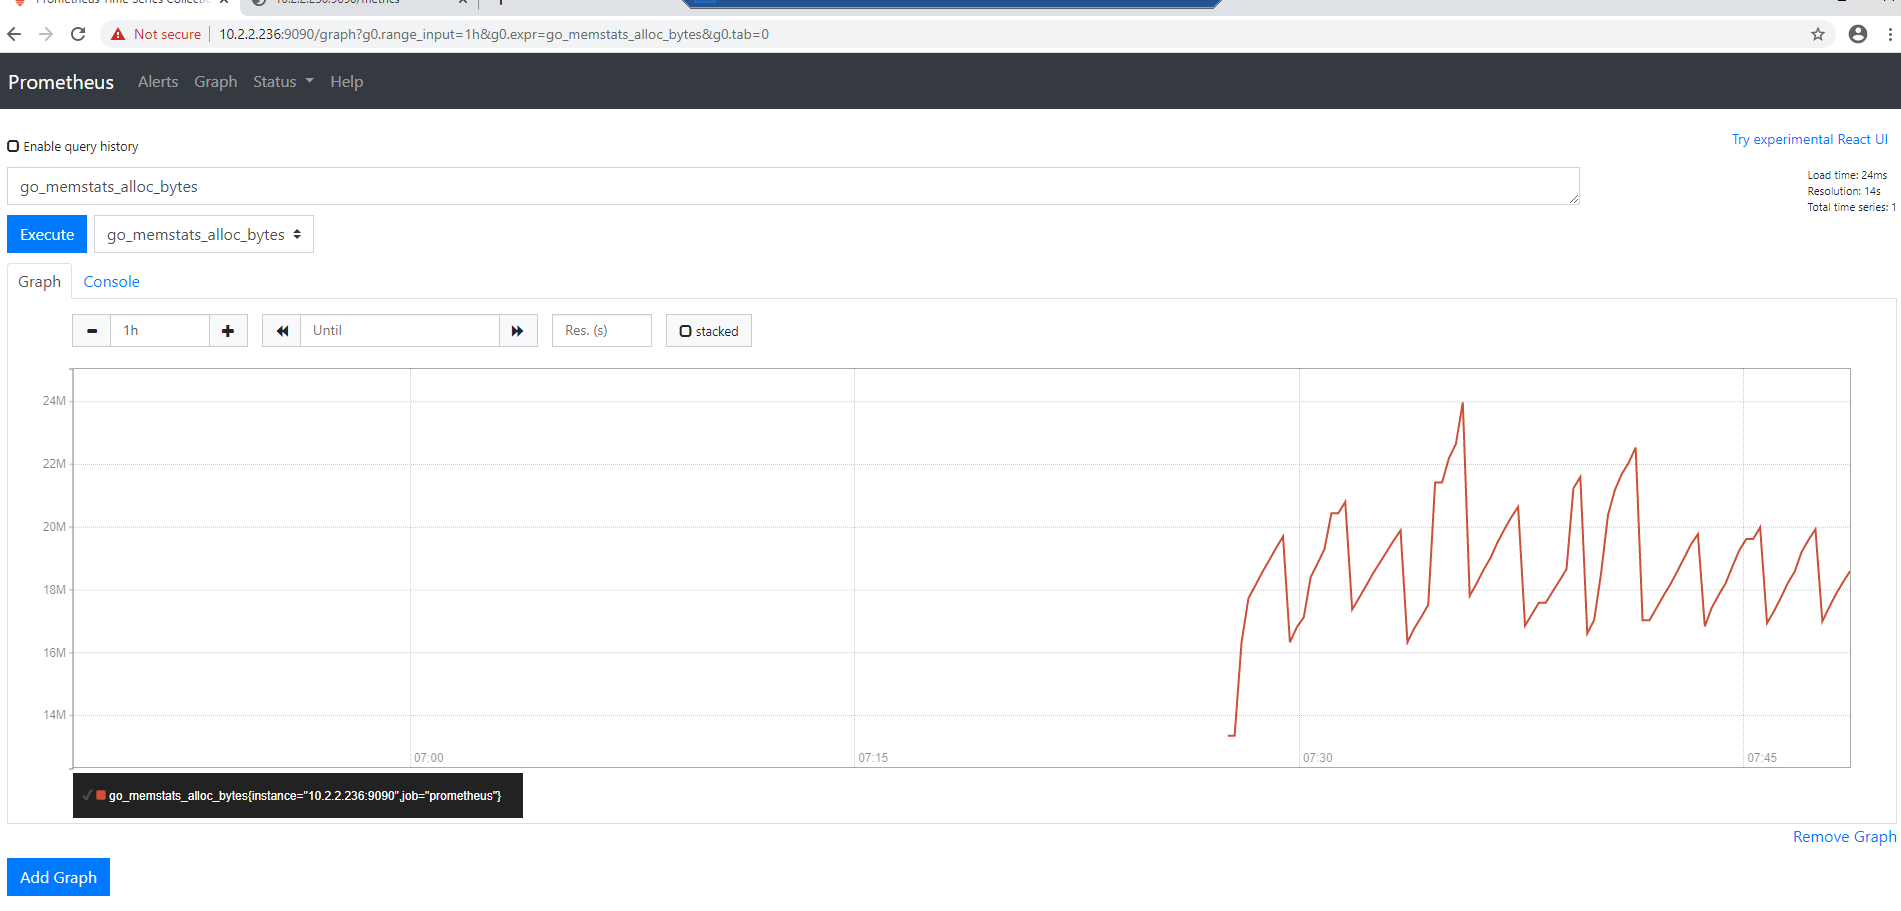
3)绘图
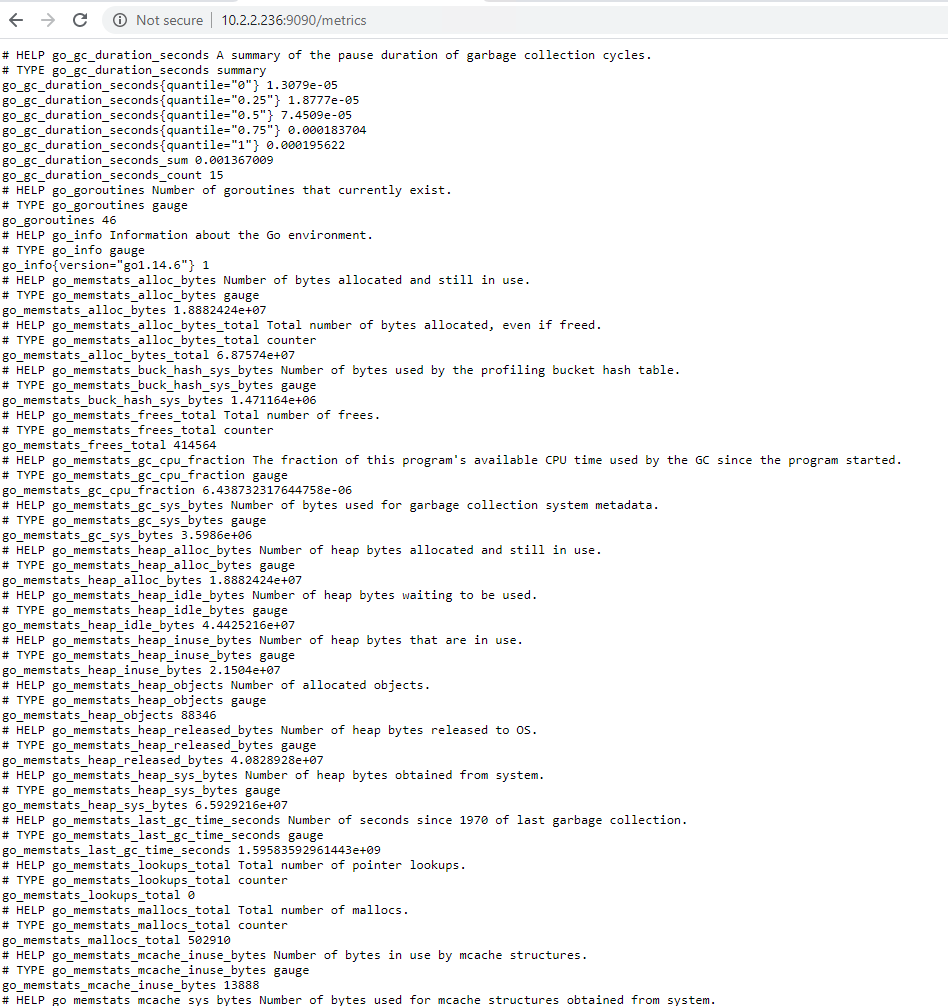
访问http://10.2.2.236:9090/metrics 查看从exporter具体能抓到的数据,如下
7、部署node_exporter
Node_exporter收集机器的系统数据,这里采用prometheus官方提供的exporter,除node_exporter外,官方还提供consul,memcached,haproxy,mysqld等exporter,具体可查看官网。
1) node_exporter
下载地址 https://github.com/prometheus/node_exporter/releases/download/v1.0.1/node_exporter-1.0.1.linux-amd64.tar.gz
[root@localhost updates]# mv node_exporter-1.0.1.linux-amd64 ../node_exporter
[root@localhost updates]# cd ../node_exporter/
[root@localhost node_exporter]# ls
LICENSE  node_exporter  NOTICE
2) 配置系统启动文件并启动服务
[root@localhost ~]# vim /usr/lib/systemd/system/node_exporter.service

[Unit]

Description=node_exporter
Documentation=https://prometheus.io/
After=network.target

[Service]

Type=simple
User=prometheus
ExecStart=/usr/local/node_exporter/node_exporter
Restart=on-failure

[Install]
WantedBy=multi-user.target


[root@localhost node_exporter]# systemctl enable node_exporter
Created symlink from /etc/systemd/system/multi-user.target.wants/node_exporter.service to /usr/lib/systemd/system/node_exporter.service.
[root@localhost node_exporter]# systemctl start node_exporter
[root@localhost node_exporter]# systemctl status node_exporter
● node_exporter.service - node_exporter
   Loaded: loaded (/usr/lib/systemd/system/node_exporter.service; enabled; vendor preset: disabled)
   Active: active (running) since Mon 2020-07-27 16:47:58 CST; 20s ago
     Docs: https://prometheus.io/
 Main PID: 1532 (node_exporter)
   CGroup: /system.slice/node_exporter.service
           └─1532 /home/gridcloud/node_exporter/node_exporter

Jul 27 16:47:58 ip-10-2-2-236.ap-southeast-1.compute.internal node_exporter[1532]: level=info ts=2020-07-27T08:47:58.831Z caller=node_exporter.go:112 collector=thermal_zone
Jul 27 16:47:58 ip-10-2-2-236.ap-southeast-1.compute.internal node_exporter[1532]: level=info ts=2020-07-27T08:47:58.831Z caller=node_exporter.go:112 collector=time
Jul 27 16:47:58 ip-10-2-2-236.ap-southeast-1.compute.internal node_exporter[1532]: level=info ts=2020-07-27T08:47:58.831Z caller=node_exporter.go:112 collector=timex
Jul 27 16:47:58 ip-10-2-2-236.ap-southeast-1.compute.internal node_exporter[1532]: level=info ts=2020-07-27T08:47:58.831Z caller=node_exporter.go:112 collector=udp_queues
Jul 27 16:47:58 ip-10-2-2-236.ap-southeast-1.compute.internal node_exporter[1532]: level=info ts=2020-07-27T08:47:58.831Z caller=node_exporter.go:112 collector=uname
Jul 27 16:47:58 ip-10-2-2-236.ap-southeast-1.compute.internal node_exporter[1532]: level=info ts=2020-07-27T08:47:58.831Z caller=node_exporter.go:112 collector=vmstat
Jul 27 16:47:58 ip-10-2-2-236.ap-southeast-1.compute.internal node_exporter[1532]: level=info ts=2020-07-27T08:47:58.831Z caller=node_exporter.go:112 collector=xfs
Jul 27 16:47:58 ip-10-2-2-236.ap-southeast-1.compute.internal node_exporter[1532]: level=info ts=2020-07-27T08:47:58.831Z caller=node_exporter.go:112 collector=zfs
Jul 27 16:47:58 ip-10-2-2-236.ap-southeast-1.compute.internal node_exporter[1532]: level=info ts=2020-07-27T08:47:58.832Z caller=node_exporter.go:191 msg="Listening on" address=:9100
Jul 27 16:47:58 ip-10-2-2-236.ap-southeast-1.compute.internal node_exporter[1532]: level=info ts=2020-07-27T08:47:58.832Z caller=tls_config.go:170 msg="TLS is disabled and it cannot be enabled on the fly." http2=false
8、grafana安装
下载路径:https://dl.grafana.com/oss/release/grafana-6.7.1-1.x86_64.rpm
1)grafana安装
[root@localhost /home]# wget https://dl.grafana.com/oss/release/grafana-6.7.1-1.x86_64.rpm
[root@localhost /home]# yum -y localinstall grafana-6.7.1-1.x86_64.rpm
2)配置文件
配置文件位于/etc/grafana/grafana.ini,这里暂时保持默认配置即可
3)设置开机启动并启动服务
[root@localhost /home]# systemctl enable grafana-server
Created symlink from /etc/systemd/system/multi-user.target.wants/grafana-server.service to /usr/lib/systemd/system/grafana-server.service.
[root@localhost /home]# systemctl start grafana-server
[root@localhost /home]# systemctl status grafana-server
● grafana-server.service - Grafana instance
   Loaded: loaded (/usr/lib/systemd/system/grafana-server.service; enabled; vendor preset: disabled)
   Active: active (running) since Mon 2020-07-27 19:01:24 CST; 10s ago
     Docs: http://docs.grafana.org
 Main PID: 7055 (grafana-server)
   CGroup: /system.slice/grafana-server.service
           └─7055 /usr/sbin/grafana-server --config=/etc/grafana/grafana.ini --pidfile=/var/run/grafana/grafana-server.pid --packaging=rpm cfg:default.paths.logs=/var/log/grafana cfg:default.paths.data=/var/lib/grafana cfg:default.paths.plugins=/var/lib/grafana/plugi...

Jul 27 19:01:24 ip-10-2-2-236.ap-southeast-1.compute.internal grafana-server[7055]: t=2020-07-27T19:01:24+0800 lvl=info msg="Initializing TracingService" logger=server
Jul 27 19:01:24 ip-10-2-2-236.ap-southeast-1.compute.internal grafana-server[7055]: t=2020-07-27T19:01:24+0800 lvl=info msg="Initializing UsageStatsService" logger=server
Jul 27 19:01:24 ip-10-2-2-236.ap-southeast-1.compute.internal grafana-server[7055]: t=2020-07-27T19:01:24+0800 lvl=info msg="Initializing CleanUpService" logger=server
Jul 27 19:01:24 ip-10-2-2-236.ap-southeast-1.compute.internal grafana-server[7055]: t=2020-07-27T19:01:24+0800 lvl=info msg="Initializing NotificationService" logger=server
Jul 27 19:01:24 ip-10-2-2-236.ap-southeast-1.compute.internal grafana-server[7055]: t=2020-07-27T19:01:24+0800 lvl=info msg="Initializing provisioningServiceImpl" logger=server
Jul 27 19:01:24 ip-10-2-2-236.ap-southeast-1.compute.internal grafana-server[7055]: t=2020-07-27T19:01:24+0800 lvl=info msg="Backend rendering via phantomJS" logger=rendering renderer=phantomJS
Jul 27 19:01:24 ip-10-2-2-236.ap-southeast-1.compute.internal grafana-server[7055]: t=2020-07-27T19:01:24+0800 lvl=warn msg="phantomJS is deprecated and will be removed in a future release. You should consider migrating from phantomJS to grafana-image-renderer plugin...
Jul 27 19:01:24 ip-10-2-2-236.ap-southeast-1.compute.internal systemd[1]: Started Grafana instance.
Jul 27 19:01:24 ip-10-2-2-236.ap-southeast-1.compute.internal grafana-server[7055]: t=2020-07-27T19:01:24+0800 lvl=info msg="Initializing Stream Manager"
Jul 27 19:01:24 ip-10-2-2-236.ap-southeast-1.compute.internal grafana-server[7055]: t=2020-07-27T19:01:24+0800 lvl=info msg="HTTP Server Listen" logger=http.server address=[::]:3000 protocol=http subUrl= socket=
Hint: Some lines were ellipsized, use -l to show in full.
4)查看端口是否启动
[root@localhost /home]# netstat -anptu |grep 3000
tcp6 0 0 :::3000 :::* LISTEN 7055/grafana-server
5) 访问http://10.2.2.236:3000/login,账号密码为:admin/admin
登录后会叫我们更改密码;此时可以跳过

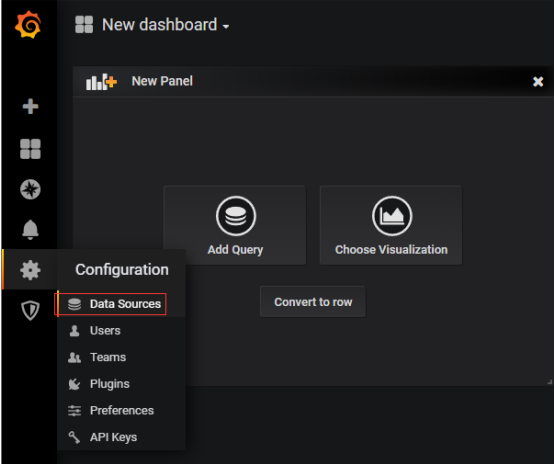
添加数据源
在登陆首页,点击"Add data source"按钮,跳转到添加数据源页面,配置如下:
Name: prometheus
Type: prometheus
URL: http://10.2.2.136:9090/
Access: proxy
取消Default的勾选,其余默认,点击"Add",如下:
导入dashboard
从grafana官网下载相关dashboaed到本地,如:https://grafana.com/dashboards/405
Grafana首页-->左上角图标-->Dashboard-->import
加入node-exporter-server-metrics_rev8.json这个插件
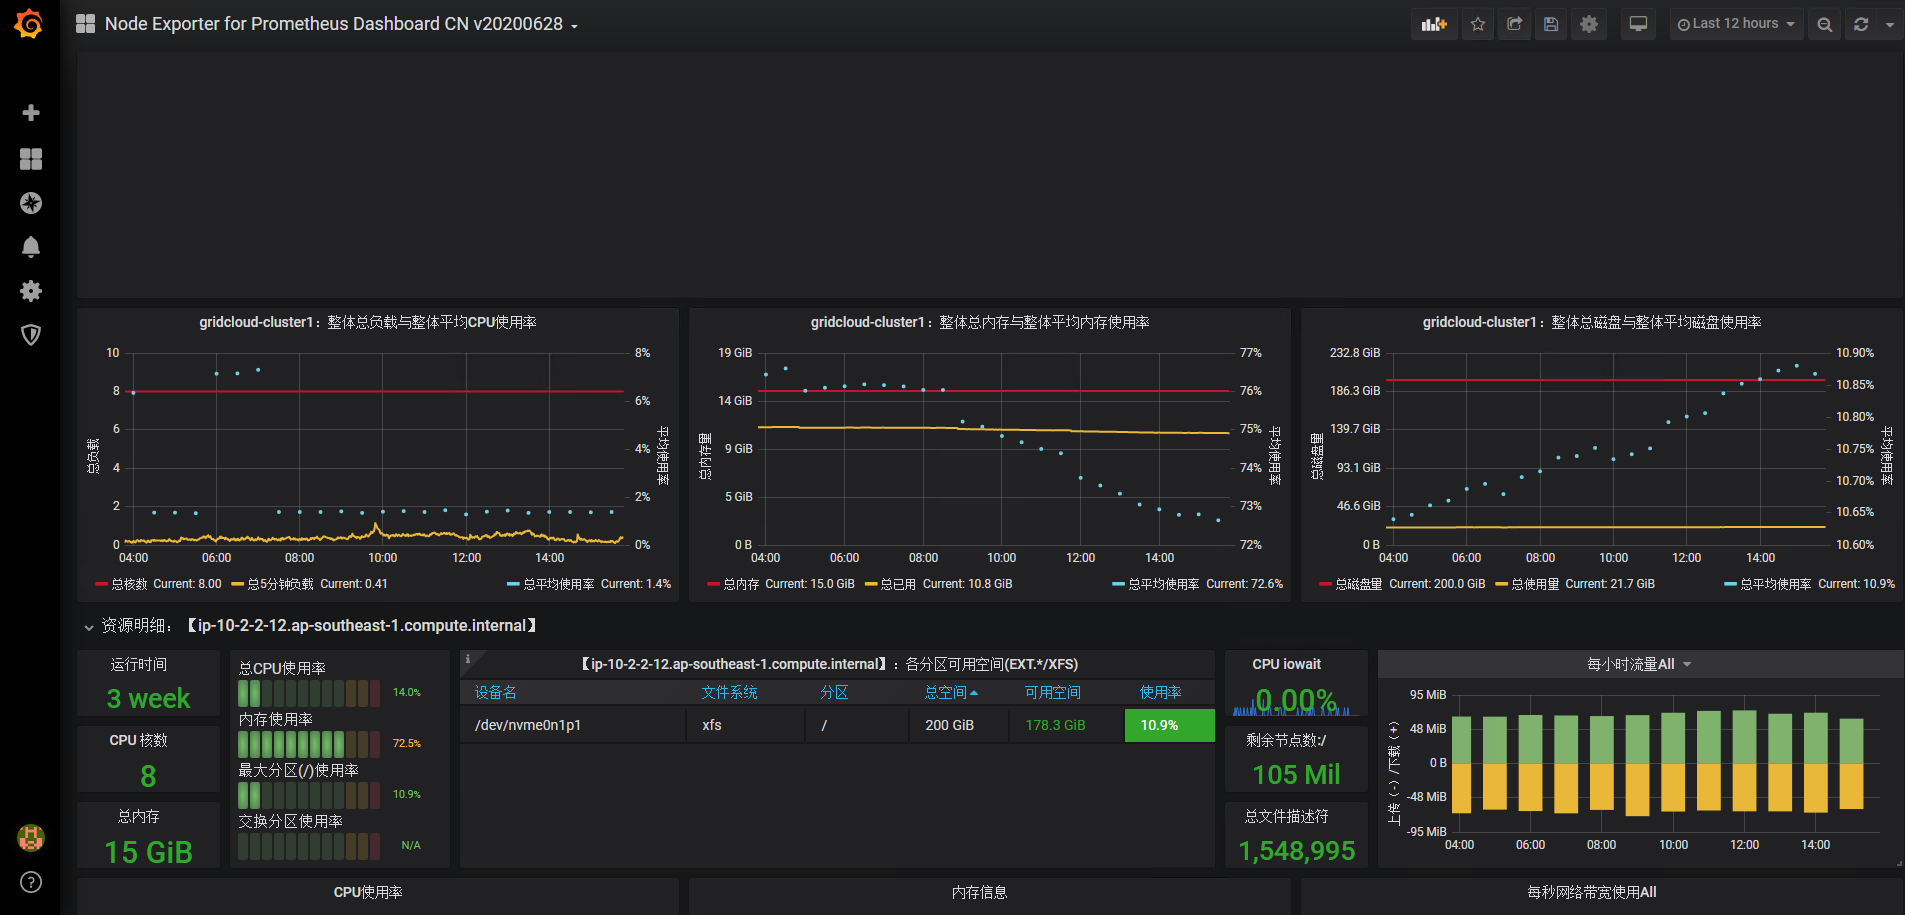
或直接导入8919 (推荐这个模板,可以一屏同时显示多台机器)模块,导入8919模块如下:
9、在所有的机器上安装
[root@localhost updates]# wget https://github.com/prometheus/node_exporter/releases/download/v1.0.1/node_exporter-1.0.1.linux-amd64.tar.gz
。。。。。。
2020-07-27 19:33:33 (3.53 MB/s) - ‘node_exporter-1.0.1.linux-amd64.tar.gz’ saved [9520728/9520728]

[root@localhost updates]# tar -xf node_exporter-1.0.1.linux-amd64.tar.gz
[root@localhost updates]# mv node_exporter-1.0.1.linux-amd64 ../node_exporter
[root@localhost updates]# cd ../node_exporter/
[root@localhost node_exporter]# ls
LICENSE  node_exporter  NOTICE
启动服务同上面node_exported配置,然后启动服务
[root@ip-10-2-2-12 node_exporter]# vim /usr/lib/systemd/system/node_exporter.service
[root@ip-10-2-2-12 node_exporter]# systemctl enable node_exporter
Created symlink from /etc/systemd/system/multi-user.target.wants/node_exporter.service to /usr/lib/systemd/system/node_exporter.service.
[root@ip-10-2-2-12 node_exporter]# systemctl start node_exporter
[root@ip-10-2-2-12 node_exporter]# systemctl status node_exporter
● node_exporter.service - node_exporter
   Loaded: loaded (/usr/lib/systemd/system/node_exporter.service; enabled; vendor preset: disabled)
   Active: active (running) since Mon 2020-07-27 19:37:08 CST; 6s ago
     Docs: https://prometheus.io/
 Main PID: 29055 (node_exporter)
   CGroup: /system.slice/node_exporter.service
           └─29055 /home/gridcloud/node_exporter/node_exporter

Jul 27 19:37:08 ip-10-2-2-12.ap-southeast-1.compute.internal node_exporter[29055]: level=info ts=2020-07-27T11:37:08.051Z caller=node_exporter.go:112 collector=thermal_zone
Jul 27 19:37:08 ip-10-2-2-12.ap-southeast-1.compute.internal node_exporter[29055]: level=info ts=2020-07-27T11:37:08.051Z caller=node_exporter.go:112 collector=time
Jul 27 19:37:08 ip-10-2-2-12.ap-southeast-1.compute.internal node_exporter[29055]: level=info ts=2020-07-27T11:37:08.051Z caller=node_exporter.go:112 collector=timex
Jul 27 19:37:08 ip-10-2-2-12.ap-southeast-1.compute.internal node_exporter[29055]: level=info ts=2020-07-27T11:37:08.051Z caller=node_exporter.go:112 collector=udp_queues
Jul 27 19:37:08 ip-10-2-2-12.ap-southeast-1.compute.internal node_exporter[29055]: level=info ts=2020-07-27T11:37:08.051Z caller=node_exporter.go:112 collector=uname
Jul 27 19:37:08 ip-10-2-2-12.ap-southeast-1.compute.internal node_exporter[29055]: level=info ts=2020-07-27T11:37:08.051Z caller=node_exporter.go:112 collector=vmstat
Jul 27 19:37:08 ip-10-2-2-12.ap-southeast-1.compute.internal node_exporter[29055]: level=info ts=2020-07-27T11:37:08.051Z caller=node_exporter.go:112 collector=xfs
Jul 27 19:37:08 ip-10-2-2-12.ap-southeast-1.compute.internal node_exporter[29055]: level=info ts=2020-07-27T11:37:08.051Z caller=node_exporter.go:112 collector=zfs
Jul 27 19:37:08 ip-10-2-2-12.ap-southeast-1.compute.internal node_exporter[29055]: level=info ts=2020-07-27T11:37:08.051Z caller=node_exporter.go:191 msg="Listening on" address=:9100
Jul 27 19:37:08 ip-10-2-2-12.ap-southeast-1.compute.internal node_exporter[29055]: level=info ts=2020-07-27T11:37:08.051Z caller=tls_config.go:170 msg="TLS is disabled and it cannot be enabled on the fly." http2=false
此时我们就能看到我们的各个机器的监控情况


 3909
3909


 被折叠的 条评论
为什么被折叠?
被折叠的 条评论
为什么被折叠?
 到【灌水乐园】发言


