


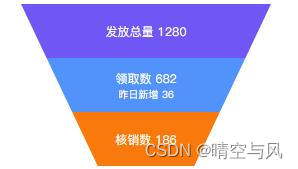
在数据统计中有时会用到这种沙漏型统计方式,以下是效果及实现代码:
<style type="text/css">
.dataEg2{display: flex;justify-content: center;margin-top: 100px;}
.triangle{
	width: 500px;height: 528px;
	/*background-color: transparent;*/
	background-color:#eee;
	clip-path: polygon(0 100%, 100% 100%, 50% 0);
	transform: rotate(180deg);
	position: relative;
}
.triangle div{
	width:500px;
	height:108px;
	position:absolute;
	left:0;
	bottom:0;
	transform: rotate(180deg);
	color:#fff;
	display: flex;
	justify-content:center;
	align-items: center;
	flex-direction: column;
	font-size:24px;
}
.triangle div label{font-size:20px;color:#fff;}
.triangle .c1{background-color:#6F56F5;}
.triangle .c2{left:0;bottom:108px;background-color:#5192FB;}
.triangle .c3{left:0;bottom:216px;background-color:#F9790C;}
</style>
<div class="dataEg2">
	<div class="triangle">
		<div class="c1">发放总量 1280</div>
		<div class="c2">领取数 682<label>昨日新增 36</label></div>
		<div class="c3">核销数 186</div>
	</div>
</div>


 1980
1980

 被折叠的 条评论
为什么被折叠?
被折叠的 条评论
为什么被折叠?
 到【灌水乐园】发言


