<!DOCTYPE html>
<html lang="zh-CN">
<head>
<meta charset="UTF-8">
<meta name="viewport" content="width=device-width, initial-scale=1.0">
<title>霸王茶姬数据看板</title>
<script src="https://cdn.jsdelivr.net/npm/echarts@5.4.3/dist/echarts.min.js"></script>
<script src="https://cdn.jsdelivr.net/npm/echarts@5.4.3/map/js/china.js"></script>
<style>
* {
margin: 0;
padding: 0;
box-sizing: border-box;
font-family: "Microsoft YaHei", sans-serif;
}
body {
background-color: #f5f5f5;
transition: background 0.5s;
padding: 20px;
}
.container {
max-width: 1800px;
margin: 0 auto;
}
.dashboard {
background-color: #fff;
border-radius: 10px;
box-shadow: 0 0 20px rgba(0, 0, 0, 0.1);
padding: 20px;
margin-bottom: 20px;
display: none;
}
.dashboard.active {
display: block;
}
.header {
display: flex;
justify-content: space-between;
align-items: center;
margin-bottom: 20px;
padding-bottom: 15px;
border-bottom: 2px solid #f0f0f0;
}
.title {
font-size: 24px;
font-weight: bold;
color: #333;
}
.title span {
color: #e74c3c;
}
.nav {
display: flex;
gap: 15px;
}
.nav-btn {
padding: 8px 15px;
background-color: #3498db;
color: white;
border: none;
border-radius: 5px;
cursor: pointer;
transition: all 0.3s;
}
.nav-btn:hover {
background-color: #2980b9;
}
.theme-btn {
padding: 8px 15px;
background-color: #2ecc71;
color: white;
border: none;
border-radius: 5px;
cursor: pointer;
margin-left: 10px;
}
.kpi-container {
display: flex;
justify-content: space-between;
margin-bottom: 20px;
flex-wrap: wrap;
gap: 15px;
}
.kpi-card {
flex: 1;
min-width: 200px;
background-color: #f9f9f9;
border-radius: 8px;
padding: 15px;
box-shadow: 0 0 10px rgba(0, 0, 0, 0.05);
display: flex;
flex-direction: column;
align-items: center;
}
.kpi-title {
font-size: 14px;
color: #666;
margin-bottom: 10px;
}
.kpi-value {
font-size: 24px;
font-weight: bold;
color: #e74c3c;
}
.chart-container {
display: flex;
flex-wrap: wrap;
gap: 20px;
margin-bottom: 20px;
}
.chart-box {
flex: 1;
min-width: 400px;
height: 400px;
background-color: #fff;
border-radius: 8px;
box-shadow: 0 0 10px rgba(0, 0, 0, 0.05);
}
.full-width {
width: 100%;
}
@media (max-width: 768px) {
.chart-box {
min-width: 100%;
}
.kpi-card {
min-width: 100%;
}
}
</style>
</head>
<body>
<div class="container">
<!-- 月度销售看板 -->
<div id="sales-dashboard" class="dashboard active">
<div class="header">
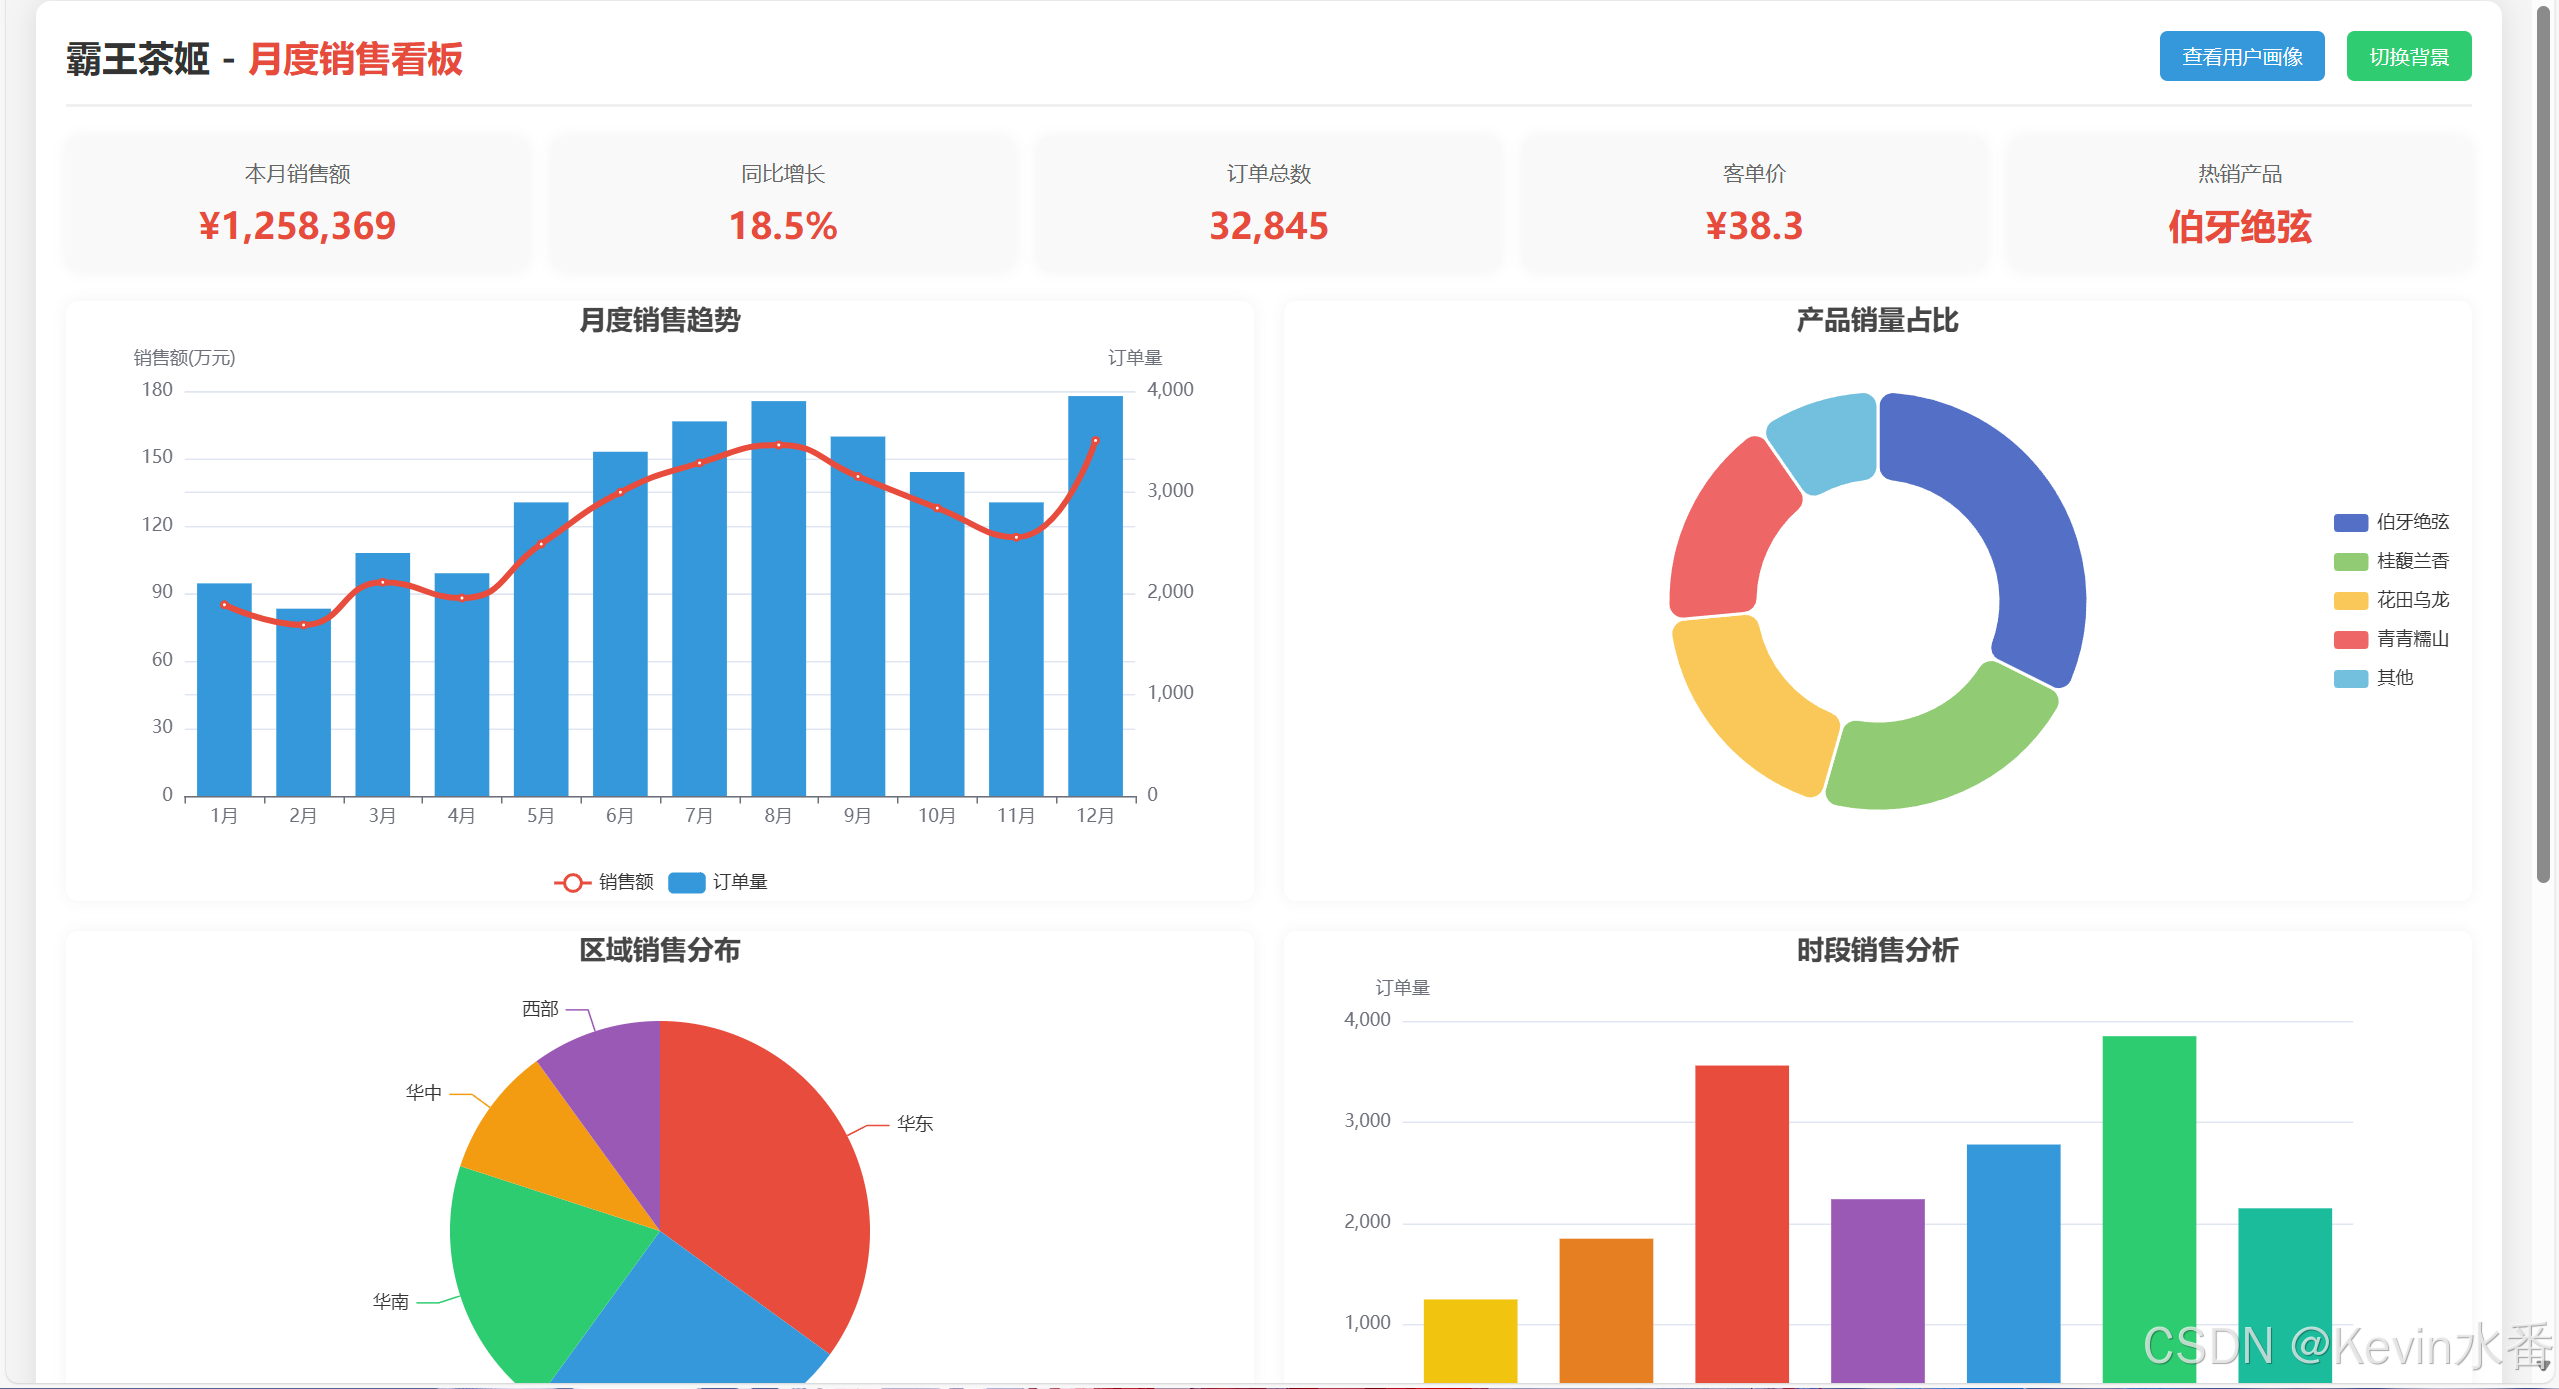
<div class="title">霸王茶姬 - <span>月度销售看板</span></div>
<div>
<button class="nav-btn" onclick="switchDashboard('user-dashboard')">查看用户画像</button>
<button class="theme-btn" onclick="changeTheme()">切换背景</button>
</div>
</div>
<div class="kpi-container">
<div class="kpi-card">
<div class="kpi-title">本月销售额</div>
<div class="kpi-value">¥1,258,369</div>
</div>
<div class="kpi-card">
<div class="kpi-title">同比增长</div>
<div class="kpi-value">18.5%</div>
</div>
<div class="kpi-card">
<div class="kpi-title">订单总数</div>
<div class="kpi-value">32,845</div>
</div>
<div class="kpi-card">
<div class="kpi-title">客单价</div>
<div class="kpi-value">¥38.3</div>
</div>
<div class="kpi-card">
<div class="kpi-title">热销产品</div>
<div class="kpi-value">伯牙绝弦</div>
</div>
</div>
<div class="chart-container">
<div id="monthly-trend" class="chart-box"></div>
<div id="product-sales" class="chart-box"></div>
</div>
<div class="chart-container">
<div id="sales-by-region" class="chart-box"></div>
<div id="sales-by-time" class="chart-box"></div>
</div>
<div class="chart-container">
<div id="sales-funnel" class="chart-box" style="height: 300px;"></div>
<div id="sales-ranking" class="chart-box" style="height: 300px;"></div>
</div>
</div>
<!-- 用户画像看板 -->
<div id="user-dashboard" class="dashboard">
<div class="header">
<div class="title">霸王茶姬 - <span>用户画像看板</span></div>
<div>
<button class="nav-btn" onclick="switchDashboard('sales-dashboard')">查看销售数据</button>
<button class="theme-btn" onclick="changeTheme()">切换背景</button>
</div>
</div>
<div class="kpi-container">
<div class="kpi-card">
<div class="kpi-title">注册用户数</div>
<div class="kpi-value">286,542</div>
</div>
<div class="kpi-card">
<div class="kpi-title">月活跃用户</div>
<div class="kpi-value">78,623</div>
</div>
<div class="kpi-card">
<div class="kpi-title">复购率</div>
<div class="kpi-value">42.7%</div>
</div>
<div class="kpi-card">
<div class="kpi-title">平均年龄</div>
<div class="kpi-value">24.5</div>
</div>
<div class="kpi-card">
<div class="kpi-title">女性占比</div>
<div class="kpi-value">68.3%</div>
</div>
</div>
<div class="chart-container">
<div id="user-gender" class="chart-box"></div>
<div id="user-age" class="chart-box"></div>
</div>
<div class="chart-container">
<div id="user-consumption" class="chart-box"></div>
<div id="user-frequency" class="chart-box"></div>
</div>
<div class="chart-container">
<div id="user-region" class="chart-box full-width" style="height: 450px;"></div>
</div>
</div>
</div>
<script>
// 初始化所有图表
function initCharts() {
// 月度销售趋势图
const monthlyTrendChart = echarts.init(document.getElementById('monthly-trend'));
monthlyTrendChart.setOption({
title: { text: '月度销售趋势', left: 'center' },
tooltip: { trigger: 'axis' },
legend: { data: ['销售额', '订单量'], bottom: 0 },
xAxis: {
type: 'category',
data: ['1月', '2月', '3月', '4月', '5月', '6月', '7月', '8月', '9月', '10月', '11月', '12月']
},
yAxis: [
{ type: 'value', name: '销售额(万元)' },
{ type: 'value', name: '订单量' }
],
series: [
{
name: '销售额',
type: 'line',
smooth: true,
data: [85, 76, 95, 88, 112, 135, 148, 156, 142, 128, 115, 158],
lineStyle: { width: 4 },
itemStyle: { color: '#e74c3c' }
},
{
name: '订单量',
type: 'bar',
yAxisIndex: 1,
data: [2100, 1850, 2400, 2200, 2900, 3400, 3700, 3900, 3550, 3200, 2900, 3950],
itemStyle: { color: '#3498db' }
}
]
});
// 产品销量占比
const productSalesChart = echarts.init(document.getElementById('product-sales'));
productSalesChart.setOption({
title: { text: '产品销量占比', left: 'center' },
tooltip: { trigger: 'item', formatter: '{a} <br/>{b}: {c} ({d}%)' },
legend: {
orient: 'vertical',
right: 10,
top: 'center',
data: ['伯牙绝弦', '桂馥兰香', '花田乌龙', '青青糯山', '其他']
},
series: [{
name: '销量占比',
type: 'pie',
radius: ['40%', '70%'],
itemStyle: { borderRadius: 10, borderColor: '#fff', borderWidth: 2 },
emphasis: { label: { show: true, fontSize: '18', fontWeight: 'bold' } },
label: { show: false },
labelLine: { show: false },
data: [
{ value: 12580, name: '伯牙绝弦' },
{ value: 8560, name: '桂馥兰香' },
{ value: 7420, name: '花田乌龙' },
{ value: 6540, name: '青青糯山' },
{ value: 3745, name: '其他' }
]
}]
});
// 区域销售分布
const salesByRegionChart = echarts.init(document.getElementById('sales-by-region'));
salesByRegionChart.setOption({
title: { text: '区域销售分布', left: 'center' },
tooltip: { trigger: 'item', formatter: '{b}: {c} ({d}%)' },
series: [{
name: '销售分布',
type: 'pie',
radius: '70%',
emphasis: {
itemStyle: { shadowBlur: 10, shadowOffsetX: 0, shadowColor: 'rgba(0, 0, 0, 0.5)' }
},
itemStyle: {
color: function(params) {
const colorList = ['#e74c3c', '#3498db', '#2ecc71', '#f39c12', '#9b59b6'];
return colorList[params.dataIndex];
}
},
data: [
{ value: 35, name: '华东' },
{ value: 25, name: '华北' },
{ value: 20, name: '华南' },
{ value: 10, name: '华中' },
{ value: 10, name: '西部' }
]
}]
});
// 时段销售分析
const salesByTimeChart = echarts.init(document.getElementById('sales-by-time'));
salesByTimeChart.setOption({
title: { text: '时段销售分析', left: 'center' },
tooltip: { trigger: 'axis', axisPointer: { type: 'shadow' } },
xAxis: {
type: 'category',
data: ['8-10点', '10-12点', '12-14点', '14-16点', '16-18点', '18-20点', '20-22点']
},
yAxis: { type: 'value', name: '订单量' },
series: [{
name: '订单量',
type: 'bar',
data: [1250, 1850, 3560, 2240, 2780, 3850, 2150],
itemStyle: {
color: function(params) {
const colorList = ['#f1c40f', '#e67e22', '#e74c3c', '#9b59b6', '#3498db', '#2ecc71', '#1abc9c'];
return colorList[params.dataIndex];
}
}
}]
});
// 销售漏斗
const salesFunnelChart = echarts.init(document.getElementById('sales-funnel'));
salesFunnelChart.setOption({
title: { text: '销售漏斗', left: 'center' },
tooltip: { trigger: 'item', formatter: '{a} <br/>{b} : {c}%' },
series: [{
name: '销售漏斗',
type: 'funnel',
left: '10%',
top: 60,
bottom: 60,
width: '80%',
min: 0,
max: 100,
sort: 'descending',
label: { show: true, position: 'inside' },
itemStyle: { borderColor: '#fff', borderWidth: 1 },
emphasis: { label: { fontSize: 20 } },
data: [
{ value: 100, name: '访问量' },
{ value: 80, name: '加入购物车' },
{ value: 60, name: '生成订单' },
{ value: 40, name: '完成支付' },
{ value: 20, name: '复购用户' }
]
}]
});
// 门店销售排名
const salesRankingChart = echarts.init(document.getElementById('sales-ranking'));
salesRankingChart.setOption({
title: { text: '门店销售排名(TOP 5)', left: 'center' },
tooltip: { trigger: 'axis', axisPointer: { type: 'shadow' } },
xAxis: { type: 'value' },
yAxis: {
type: 'category',
data: ['南京东路店', '北京三里屯店', '上海环球港店', '广州天河店', '成都春熙路店']
},
series: [{
name: '销售额(万元)',
type: 'bar',
data: [182, 165, 158, 142, 135],
itemStyle: {
color: function(params) {
const colorList = ['#e74c3c', '#f39c12', '#f1c40f', '#2ecc71', '#3498db'];
return colorList[params.dataIndex];
}
},
label: { show: true, position: 'right' }
}]
});
// 用户性别分布
const userGenderChart = echarts.init(document.getElementById('user-gender'));
userGenderChart.setOption({
title: { text: '用户性别分布', left: 'center' },
tooltip: { trigger: 'item', formatter: '{a} <br/>{b}: {c} ({d}%)' },
legend: {
orient: 'vertical',
right: 10,
top: 'center',
data: ['女性', '男性', '未知']
},
series: [{
name: '性别分布',
type: 'pie',
radius: ['50%', '70%'],
itemStyle: { borderRadius: 10, borderColor: '#fff', borderWidth: 2 },
emphasis: { label: { show: true, fontSize: '18', fontWeight: 'bold' } },
label: { show: false },
data: [
{ value: 68.3, name: '女性' },
{ value: 29.5, name: '男性' },
{ value: 2.2, name: '未知' }
]
}]
});
// 用户年龄分布
const userAgeChart = echarts.init(document.getElementById('user-age'));
userAgeChart.setOption({
title: { text: '用户年龄分布', left: 'center' },
tooltip: { trigger: 'axis', axisPointer: { type: 'shadow' } },
xAxis: {
type: 'category',
data: ['18岁以下', '18-22岁', '23-27岁', '28-35岁', '36-45岁', '45岁以上']
},
yAxis: { type: 'value', name: '占比(%)' },
series: [{
name: '年龄分布',
type: 'bar',
data: [5.2, 32.5, 38.7, 15.6, 6.3, 1.7],
itemStyle: {
color: function(params) {
const colorList = ['#f1c40f', '#e67e22', '#e74c3c', '#9b59b6', '#3498db', '#2ecc71'];
return colorList[params.dataIndex];
}
},
label: { show: true, position: 'top' }
}]
});
// 用户消费水平
const userConsumptionChart = echarts.init(document.getElementById('user-consumption'));
userConsumptionChart.setOption({
title: { text: '用户消费水平', left: 'center' },
tooltip: { trigger: 'item', formatter: '{a} <br/>{b}: {c}%' },
radar: {
indicator: [
{ name: '20元以下', max: 100 },
{ name: '20-30元', max: 100 },
{ name: '30-40元', max: 100 },
{ name: '40-50元', max: 100 },
{ name: '50元以上', max: 100 }
],
radius: '65%'
},
series: [{
name: '消费水平分布',
type: 'radar',
data: [{
value: [15, 35, 65, 45, 20],
name: '占比',
areaStyle: { color: 'rgba(231, 76, 60, 0.5)' },
lineStyle: { width: 2, color: '#e74c3c' }
}]
}]
});
// 购买频率分布
const userFrequencyChart = echarts.init(document.getElementById('user-frequency'));
userFrequencyChart.setOption({
title: { text: '购买频率分布', left: 'center' },
tooltip: { trigger: 'item', formatter: '{a} <br/>{b}: {c}%' },
series: [{
name: '购买频率',
type: 'pie',
radius: [50, 150],
roseType: 'area',
itemStyle: { borderRadius: 8 },
label: { show: true, formatter: '{b}: {c}%' },
data: [
{ value: 15, name: '每周3次以上' },
{ value: 25, name: '每周1-2次' },
{ value: 30, name: '每月2-3次' },
{ value: 20, name: '每月1次' },
{ value: 10, name: '偶尔购买' }
]
}]
});
// 用户地域分布
const userRegionChart = echarts.init(document.getElementById('user-region'));
userRegionChart.setOption({
title: { text: '用户地域分布', left: 'center' },
tooltip: { trigger: 'item', formatter: '{b}: {c}' },
visualMap: {
min: 0,
max: 50000,
text: ['高', '低'],
inRange: { color: ['#e0f3f8', '#abd9e9', '#74add1', '#4575b4', '#313695'] }
},
series: [{
name: '用户数量',
type: 'map',
map: 'china',
emphasis: { label: { show: true } },
data: [
{ name: '北京', value: 48320 },
{ name: '上海', value: 51230 },
{ name: '广东', value: 45680 },
{ name: '江苏', value: 38560 },
{ name: '浙江', value: 35420 },
{ name: '四川', value: 28750 },
{ name: '湖北', value: 21560 },
{ name: '陕西', value: 18540 },
{ name: '辽宁', value: 15430 },
{ name: '福建', value: 14250 }
]
}]
});
}
// 切换看板
function switchDashboard(dashboardId) {
document.querySelectorAll('.dashboard').forEach(dashboard => {
dashboard.classList.remove('active');
});
document.getElementById(dashboardId).classList.add('active');
// 切换后重新调整图表大小
setTimeout(() => {
echarts.getInstanceByDom(document.getElementById('monthly-trend'))?.resize();
echarts.getInstanceByDom(document.getElementById('product-sales'))?.resize();
echarts.getInstanceByDom(document.getElementById('sales-by-region'))?.resize();
echarts.getInstanceByDom(document.getElementById('sales-by-time'))?.resize();
echarts.getInstanceByDom(document.getElementById('sales-funnel'))?.resize();
echarts.getInstanceByDom(document.getElementById('sales-ranking'))?.resize();
echarts.getInstanceByDom(document.getElementById('user-gender'))?.resize();
echarts.getInstanceByDom(document.getElementById('user-age'))?.resize();
echarts.getInstanceByDom(document.getElementById('user-consumption'))?.resize();
echarts.getInstanceByDom(document.getElementById('user-frequency'))?.resize();
echarts.getInstanceByDom(document.getElementById('user-region'))?.resize();
}, 100);
}
// 切换背景主题
function changeTheme() {
const body = document.body;
const currentBg = window.getComputedStyle(body).backgroundColor;
if (currentBg === 'rgb(245, 245, 245)') {
body.style.background = 'linear-gradient(135deg, #1e2a78 0%, #ff758c 100%)';
body.style.color = '#fff';
} else if (currentBg === 'rgba(0, 0, 0, 0)') {
body.style.background = 'linear-gradient(to right, #0f2027, #203a43, #2c5364)';
body.style.color = '#fff';
} else {
body.style.background = '#f5f5f5';
body.style.color = '#333';
}
}
// 页面加载完成后初始化图表
window.onload = function() {
initCharts();
// 监听窗口大小变化,重新调整图表大小
window.addEventListener('resize', function() {
echarts.getInstanceByDom(document.getElementById('monthly-trend'))?.resize();
echarts.getInstanceByDom(document.getElementById('product-sales'))?.resize();
echarts.getInstanceByDom(document.getElementById('sales-by-region'))?.resize();
echarts.getInstanceByDom(document.getElementById('sales-by-time'))?.resize();
echarts.getInstanceByDom(document.getElementById('sales-funnel'))?.resize();
echarts.getInstanceByDom(document.getElementById('sales-ranking'))?.resize();
echarts.getInstanceByDom(document.getElementById('user-gender'))?.resize();
echarts.getInstanceByDom(document.getElementById('user-age'))?.resize();
echarts.getInstanceByDom(document.getElementById('user-consumption'))?.resize();
echarts.getInstanceByDom(document.getElementById('user-frequency'))?.resize();
echarts.getInstanceByDom(document.getElementById('user-region'))?.resize();
});
};
</script>
</body>
</html>


 被折叠的 条评论
为什么被折叠?
被折叠的 条评论
为什么被折叠?
 到【灌水乐园】发言


