


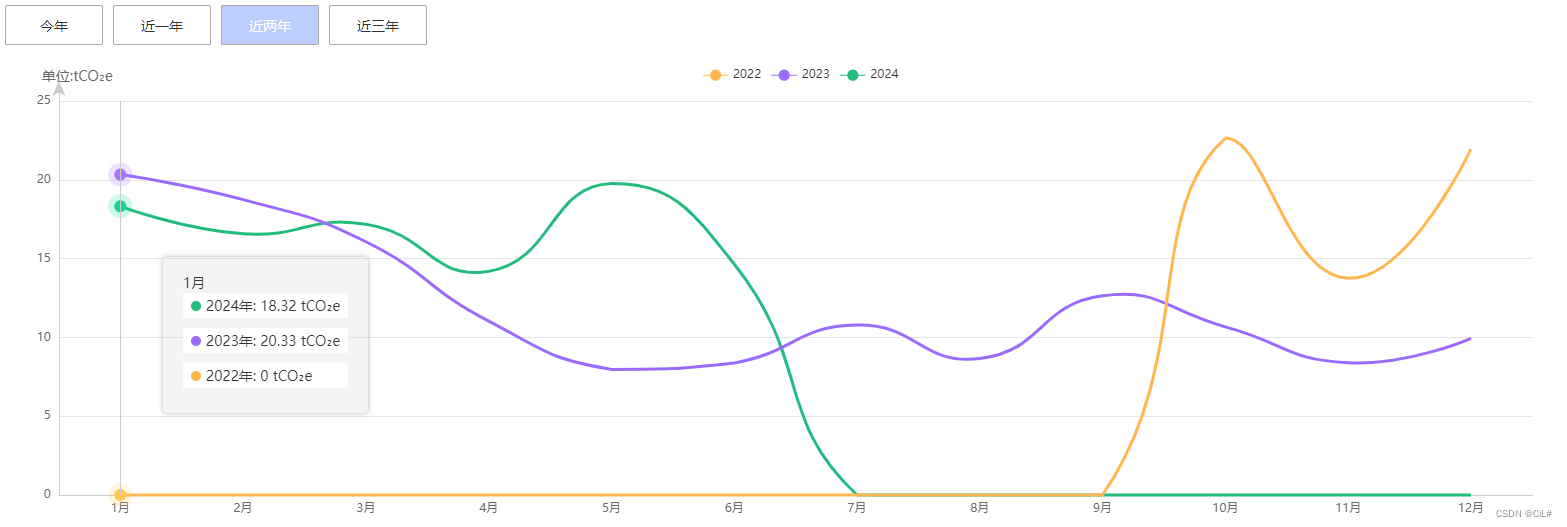
实现效果:
代码:
<template>
  <div class="echarts">
    <div class="select-box">
       <div v-for="(item,index) in trendList"
            :key="index"
            :class="[period == item.id?'active':'','item']"
            @click="trendClick(item,index)">{{ item.name }}</div>
    </div>
    <div class="echarts-box">
      <div id="trendChart" ref="trendChart" :style="trendStyle"></div>
    </div>
  </div>
</template>
<script>
// import * as echarts from 'echarts' // 方法2 局部引用
export default {
 data () {
    return {
         // 选择项列表
         trendList: [
          {
            id: 1,
            name: '今年'
          },
          {
            id: 2,
            name: '近一年'
          },
          {
            id: 3,
            name: '近两年'
          },
          {
            id: 4,
            name: '近三年'
          }
        ],
        // 当前选中的 日期
        period: 1,
        trendStyle: { height: '460px', with: '100%' }, // 趋势echarts的样式
        // 后端返回的数据-假数据
        trendData: {
            2021: [0, 0, 0, 0, 0, 0, 0, 0, 0, 0, 0, 0]
            2022: [0, 0, 0, 0, 0, 0, 0, 0, 0, 22.65, 13.75, 21.95]
            2023: [20.33, 18.74, 16.07, 11.03, 7.97, 8.38, 10.78, 8.66, 12.64, 10.67, 8.39, 9.94]
            2024: [18.32, 16.58, 17.18, 14.19, 19.76, 14.65, 0, 0, 0, 0, 0, 0]
        },
      optionTrend: { // 趋势统计-折线图
        // backgroundColor: 'transparent',
        title: {
          // 副标题
          subtext: '单位:tCO₂e',
          // 副标题文本样式
          subtextStyle: {
            fontWeight: 'normal',
            fontSize: 14,
            color: '#666'
          },
          // top: -10,
          left: '2%'
        },
        legend: {
          // left: '16%',
          top: '2%',
          // orient: 'vertical',
          // data: ['2020年', '2021年', '2022年', '2023年', '2024年']
          // data: Object.keys(this.trendData) // 对象属性
          data: []
        },
        // 提示框配置
        tooltip: {
          trigger: 'axis', // 触发方式: 'axis':设置为坐标轴触发提示框   'item':当鼠标悬浮在某个数据项上时触发  'none':不触发鼠标悬浮显示数据
          backgroundColor: '#cccccc38', // 设置背景色,
          textStyle: {
            color: '#333' // 设置字体颜色
          },
          extraCssText: 'box-shadow: 0 0 5px rgba(0,0,0,0.3)', // 提示框阴影边框
          axisPointer: {
            lineStyle: {
              color: '#CCCCCC' // 设置垂直线的颜色
            }
            // label: { // x轴在鼠标移入时的样式
            //   show: true, // 显示才生效
            //   backgroundColor: 'transparent', // 背景色
            //   color: '#bcf', // 文字颜色
            // }
          },
          // axisPointer: {
          //   lineStyle: {
          //     color: {
          //       type: 'linear',
          //       x: 0,
          //       y: 0,
          //       x2: 0,
          //       y2: 1,
          //       colorStops: [{
          //         offset: 0,
          //         color: 'rgba(126,199,255,0)' // 0% 处的颜色
          //       }, {
          //         offset: 0.2,
          //         color: '#21BB7E' // 100% 处的颜色
          //       }, {
          //         offset: 0.4,
          //         color: '#6584FF' // 100% 处的颜色
          //       }, {
          //         offset: 0.6,
          //         color: '#FFB74F' // 100% 处的颜色
          //       }, {
          //         offset: 0.8,
          //         color: '#9B6BFF' // 100% 处的颜色
          //       }, {
          //         offset: 1,
          //         color: 'rgba(126,199,255,0)' // 100% 处的颜色
          //       }],
          //       global: false // 缺省为 false
          //     }
          //   }
          // },
          padding: [15, 20],
          formatter: function (params) {
            // console.log(params)
            let result = ''
            result += params[0].name + '<br />'
            for (let i = 0; i < params.length; i++) {
              result += '<div style="diaplay: inline-block;padding:2px 8px;margin-bottom: 10px;background-color: #fff;">' +
                params[i].marker + params[i].seriesName + '年: ' + params[i].value + '  tCO₂e' + '<br />' +
                '</div>'
            }
            return result
          }
        },
        grid: {
          top: '10%',
          left: '02%',
          right: '4%',
          bottom: '0%',
          containLabel: true
        },
        xAxis: [{
          type: 'category',
          axisLine: {
            // y轴线的颜色以及宽度
            //   show: false,
            lineStyle: {
              color: '#ccc',
              width: 1,
              type: 'solid'
            }
          },
          splitArea: {
            show: false
          },
          axisLabel: {
            textStyle: {
              color: '#666'
            }
            // color: '#fff'
          },
          splitLine: {
            show: false
          },
          axisTick: {
            show: false
          },
          boundaryGap: true, // 坐标轴两边留白。 boundaryGap 可以配置为 true 和 false。默认为 true,这时候刻度只是作为分隔线,标签和数据点都会在两个刻度之间的带(band)中间
          // boundaryGap: ['20%', '20%'], // boundaryGap是一个两个值的数组,分别表示数据最小值和最大值的延伸范围,可以直接设置数值或者相对的百分比,在设置 min 和 max 后无效。
          data: ['1月', '2月', '3月', '4月', '5月', '6月', '7月', '8月', '9月', '10月', '11月', '12月']
          // data: xDate
        }],
        yAxis: [{
          type: 'value',
          min: 0,
          splitLine: {
            show: true,
            lineStyle: { // 网格横线的样式
              color: '#E5E5E5', // 线条颜色
              type: 'solid', // 线条类型(solid、dashed、dotted)
              curveness: 0 // 线条曲度(0为直线)
            }
          },
          axisLine: {
            show: true,
            symbol: ['none', 'arrow'], // 加箭头处
            symbolOffset: 20, // 使箭头偏移
            lineStyle: {
              color: '#CCCCCC', // 设置y轴的颜色
              shadowOffsetY: -20, // 利用阴影进行反向延长
              shadowColor: '#CCCCCC' // 设置阴影的颜色
            }
          },
          axisLabel: {
            // show: false,
            // margin: 20,
            textStyle: {
              color: '#666'
            }
          },
          axisTick: {
            show: false
          }
        }],
        series: [
          // {
          //   name: '2023年',
          //   type: 'line',
          //   smooth: true, // 是否平滑
          //   // showAllSymbol: false,
          //   showSymbol: false,
          //   symbol: 'circle',
          //   symbolSize: 6,
          //   itemStyle: {
          //     color: '#00ca95',
          //     borderColor: 'rgba(0,202,149,0.2)',
          //     borderWidth: 12,
          //     shadowColor: 'rgba(0,202,149,0.1)',
          //     shadowBlur: 0,
          //     shadowOffsetY: 2,
          //     shadowOffsetX: 2
          //   },
          //   lineStyle: {
          //     normal: {
          //       width: 3 // 折线的宽度
          //     }
          //   },
          //   data: ['800', '1400', '808', '811', '626', '488', '1600', '1100', '500', '300', '1998', '822']
          //   // data: thisYearTrend
          //   // areaStyle: {
          //   //   normal: {
          //   //     color: new echarts.graphic.LinearGradient(0, 0, 0, 1, [{
          //   //       offset: 0,
          //   //       color: 'rgba(0,202,149,0.3)'
          //   //     },
          //   //     {
          //   //       offset: 1,
          //   //       color: 'rgba(0,202,149,0)'
          //   //     }
          //   //     ], false),
          //   //     shadowColor: 'rgba(0,202,149, 0.9)'
          //   //     // shadowBlur: 20
          //   //   }
          //   // },
          // },
          // {
          //   name: '2022年',
          //   type: 'line',
          //   smooth: true,
          //   showSymbol: false,
          //   symbol: 'circle',
          //   symbolSize: 6,
          //   // areaStyle: {
          //   //     normal: {
          //   //         color: new echarts.graphic.LinearGradient(0, 0, 0, 1, [{
          //   //             offset: 0,
          //   //             color: 'rgba(199, 237, 250,0.5)'
          //   //         }, {
          //   //             offset: 1,
          //   //             color: 'rgba(199, 237, 250,0.2)'
          //   //         }], false)
          //   //     }
          //   // },
          //   itemStyle: {
          //     normal: {
          //       color: 'rgb(0,136,212)',
          //       borderColor: 'rgba(0,136,212,0.2)',
          //       borderWidth: 12
          //     }
          //   },
          //   // itemStyle: {
          //   //     normal: {
          //   //         color: '#f7b851'
          //   //     }
          //   // },
          //   lineStyle: {
          //     normal: {
          //       width: 3 // 折线的宽度
          //     }
          //   },
          //   data: ['1200', '1100', '1008', '1411', '1026', '1288', '1300', '800', '1100', '1000', '1118', '1322']
          //   // data: lastYearTrend1
          // }
        ]
      },
      trendcharts: null,
    }
 },
 mounted () {
   this.$nextTick(() => {
     this.getEcharts()
   })
    // 自适应窗口大小
    window.addEventListener('resize', () => {
      this.trendcharts.resize() // 趋势折线图自适应
    })
 },
 methods: {
    // -点击日期按钮
    trendClick (data, index) {
      // console.log(data, index, '点击日期')
      this.period = data.id // 选中改变样式
      this.getEcharts()
    },
    // 获取趋势折线图
    getEcharts () {
      // 此处本来是直接调用接口的,这里就写点假数据

      if (this.$refs.trendChart) {
          this.optionTrend.legend.data = Object.keys(this.trendData) // 对象属性

          // console.log(this.optionTrend.series, 'this.optionTrend.series')
          this.optionTrend.series = []
          let colorArr = [
            '#21BB7E',
            '#6584FF',
            '#FFB74F',
            '#9B6BFF'
            // '#ee6666',
            // '#73c0de',
            // '#D0E6A5',
            // '#fc8452',
            // '#ea7ccc',
            // '#FF0033',
            // '#09F7F7'
          ]
          let borderArrColor = ['rgba(0,202,149,0.2)', 'rgba(101,132,255,0.2)', 'rgba(255,183,79,0.2)', 'rgba(155,107,255,0.2)']
          for (let i in this.trendData) {
            // console.log(i, '对象属性')
            this.optionTrend.series.unshift({
              name: i, // 线条-名称
              type: 'line',
              smooth: true, // 是否平滑
              // showAllSymbol: false,
              showSymbol: false,
              symbol: 'circle',
              symbolSize: 6,
              // // 矢量画五角星
              // symbol: 'path://M150 0 L80 175 L250 75 L50 75 L220 175 Z',
              // symbolSize: 8,
              itemStyle: {
                // color: '#00ca95',
                // borderColor: 'rgba(0,202,149,0.2)',
                // borderWidth: 12

                color: colorArr[i % colorArr.length],
                borderColor: borderArrColor[i % borderArrColor.length],
                // color: colorArr[this.optionTrend.series.length % colorArr.length],
                // borderColor: borderArrColor[this.optionTrend.series.length % colorArr.length],
                borderWidth: 12
              },
              lineStyle: {
                normal: {
                  width: 3 // 折线的宽度
                  // shadowColor: colorArr[i % colorArr.length], // 阴影颜色
                  // shadowBlur: 10, // 阴影的模糊大小
                  // shadowOffsetY: 7 // 阴影垂直方向上的偏移距离
                }
              },
              data: this.trendData[i] // 对象的属性值
            })
          }

          // 遇到数据更新,视图未更新两种解决方法 --解决echarts数据更新,页面不刷新问题
          // 1.添加 trendcharts.clear()
          // // const trendcharts = echarts.init(this.$refs.trendChart)
          // const trendcharts = this.$echarts.init(this.$refs.trendChart)
          // trendcharts.clear()
          // // 对实例对象进行配置
          // trendcharts.setOption(this.optionTrend)
          // ------
          // 2. setOption有3个属性,setOption(option,notMerge,lazyUpdate);第二个notMerge默认为false,即默认合并数据,设置成true之后就不合并数据,从而实现刷新页面的效果。
          // // const trendcharts = echarts.init(this.$refs.trendChart)
          // const trendcharts = this.$echarts.init(this.$refs.trendChart)
          // trendcharts.setOption(this.optionTrend, true)
          this.trendcharts = this.$echarts.init(this.$refs.trendChart)
          this.trendcharts.setOption(this.optionTrend, true)
      }
   }
 }
}
</script>
<style lang="scss" scoped>
.echarts{
 .select-box {
   display: flex;
   align-items: center;
   width: 514px;
   height: 60px;
   .item {
     width: 98px;
     height: 40px;
     line-height: 40px;
     text-align: center;
     background-color: #fff;
     border: 1px solid #afa6a6;
     border-radius: 2px;
     margin: 20px 10px 20px 0;
     cursor: pointer;
   }
   .active {
     color: #fff;
     background-color: #bcf;
   }
 }
 .echarts-box {
   width: 100%;
   height: 480px;
 }
}
</style>


 676
676

 被折叠的 条评论
为什么被折叠?
被折叠的 条评论
为什么被折叠?
 到【灌水乐园】发言


