


最近公司有需求需要写一个标记历史事件的时间轴,有几下几点要求:
1、年代范围可自定义,即事件轴的起始年份与结束年份可根据事件数据内的年份范围灵活改变
2、时间轴具有滚轮放大缩小功能,以便于坐标时间可以具体到某天,也可以以年为坐标来查看
3、当放大到一定程度时坐标才会显示月份或具体到某天
4、事件会根据具体发生时间来标记到坐标轴相应位置
本来计划是在echarts社区找差不多的改改来用,但转了一圈没有找到合适的,大部分不支持根据时间定位具体位置,只是单纯的从左往右排列,最后决定自己手搓一个
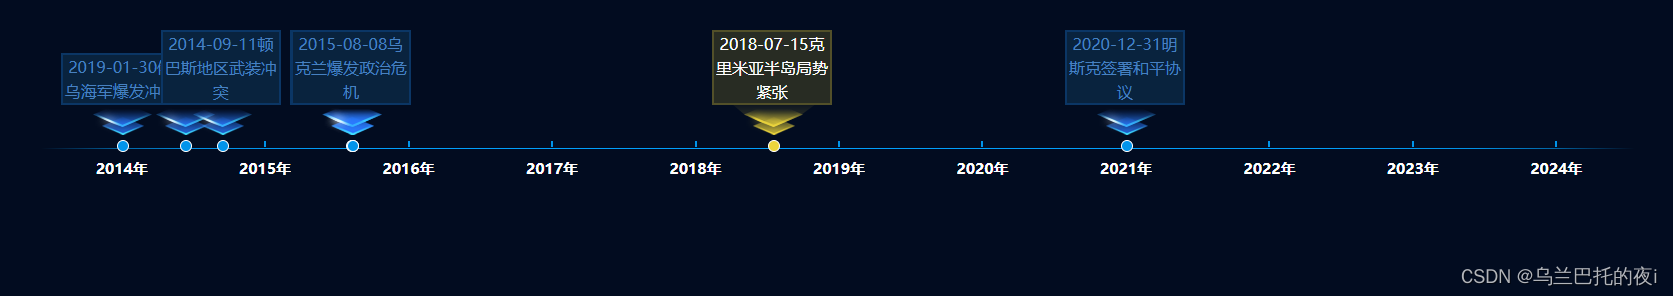
先看具体效果:
正常效果:
滚轮放大效果:
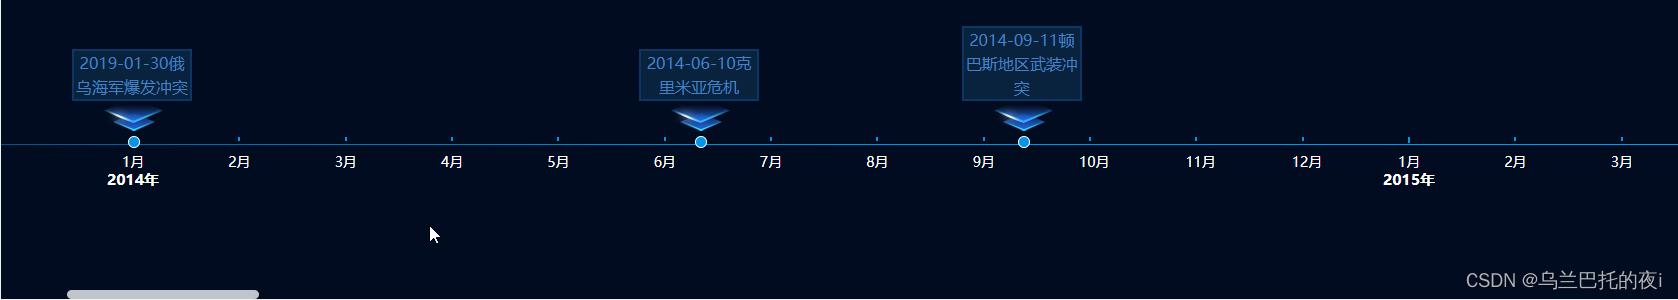
放大到具体某天时:

下面放具体代码:
首先坐标轴我采用了div盒子高度为1px,设置背景颜色的效果,因为这样方便设置渐变色,其中的坐标轴、事件标记等我采用了绝对定位的方法来设置距离左边的距离,因为作为公用组件,需要适应各种容器大小,所以left我全部采用的是百分比,百分比的好处就是可以识别小数点后面好多位的数字,因为坐标较多,所以常常会出现精确到小数点后五位以上的left值(其中year-sign与month-sign分别为年坐标轴及月坐标轴标记,因为无日级坐标轴的需求,所以没有加,如果有需要可以依据此方法加上;event-sign为事件标记)
<template>
    <div class="main" id="body">
		<div class="axle-wire" id="content">
			<div>
				<div v-for="(item, yearInd) in yearsList" :key="yearInd" class="year-sign" :style="{left: `${item.left}%`}">
					<div class="sign-icon-year"/>
					<div class="sign-title-year" :style="{marginTop: isMonthShow ? '25px' : ''}">{{ `${item.year}年` }}</div>
				</div>
				<div v-for="(item, yearInd) in getMonthList" :key="yearInd">
					<div v-for="(itm, monthInd) in monthsList" :key="monthInd" class="month-sign" :style="{left: `${item.left + itm.left}%`}">
						<div class="sign-icon-month"/>
						<div class="sign-title-month">{{ itm.month }}</div>
					</div>
				</div>
				<div v-for="(ele, index) in trueDataList" :key="index" class="event-sign" :class="activeEvent === index ? 'active-event' : ''" :style="{left: `${ele.left}%`}">
					<div class="event-icon" @click="selectEvent(index)"/>
					<img v-if="activeEvent === index" class="event-img" src="./arrowsYellow.png">
					<img v-else class="event-img" src="./arrowsBlue.png">
					<div class="event-title" :title="ele.label">{{ ele.label }}</div>
				</div>
			</div>
		</div>
    </div>
</template>
时间轴的起始时间和结束时间都由父组件传入,也可以根据事件数据自己计算
props: {
		startYear: {
			type: Number,
			default: 2014,
		},
		endYear: {
			type: Number,
			default: 2023,
		},
		eventList: {
			type: Array,
			default: () => {},
		},
	},
接下来是默认的数据,数据内需要有事件发生的日期,这里采用xxxx-xx-xx的格式来传入,monthList是月份列表,因为每个月的天数都不一样,需要单独计算,所以需要有一个列表来取每月天数
dataList: [
				{
					occurrenceTime: '2014-06-10',
					label: '2014-06-10克里米亚危机'
				},
				{
					occurrenceTime: '2020-12-31',
					label: '2020-12-31明斯克签署和平协议'
				},
				{
					occurrenceTime: '2018-07-15',
					label: '2018-07-15克里米亚半岛局势紧张'
				},
				{
					occurrenceTime: '2019-01-30',
					label: '2019-01-30俄乌海军爆发冲突'
				},
				{
					occurrenceTime: '2014-09-11',
					label: '2014-09-11顿巴斯地区武装冲突'
				},
				{
					occurrenceTime: '2015-08-06',
					label: '2015-08-06乌克兰爆发政治危机'
				},
				{
					occurrenceTime: '2015-08-07',
					label: '2015-08-07乌克兰爆发政治危机'
				},
				{
					occurrenceTime: '2015-08-08',
					label: '2015-08-08乌克兰爆发政治危机'
				},
			],
			monthsList: [
				{
					id: 1,
					month: '1月',
					days: 31
				},
				{
					id: 2,
					month: '2月',
					days: 28
				},
				{
					id: 3,
					month: '3月',
					days: 31
				},
				{
					id: 4,
					month: '4月',
					days: 30
				},
				{
					id: 5,
					month: '5月',
					days: 31
				},
				{
					id: 6,
					month: '6月',
					days: 30
				},
				{
					id: 7,
					month: '7月',
					days: 31
				},
				{
					id: 8,
					month: '8月',
					days: 31
				},
				{
					id: 9,
					month: '9月',
					days: 30
				},
				{
					id: 10,
					month: '10月',
					days: 31
				},
				{
					id: 11,
					month: '11月',
					days: 30
				},
				{
					id: 12,
					month: '12月',
					days: 31
				},
			],
然后还有其他几个数据
// 计算后的年列表
			yearsList: [],
			// 选中的事件
			activeEvent: 0,
			// 处理后用来展示的数据
			trueDataList: [],
			// 滚轮放大时的倍数
			scale: 95,
			// 滚动后回到选中事件的定时器
			timer: null,
			// 是否展示月份坐标
isMonthShow: false首先是整个组件最难的部分:通过所传的起始年份和结束年份来计算年坐标与月坐标的定位位置,这里采用的方法是:1、通过结束年份减去起始年份来计算出时间轴在年上面被分成了几格,但由于最后一个年份后面也要有一个格子来记载当年的事件,所以最后要加1(比如事件最近的是2013年的事件,那么坐标轴末尾就要到2014年),计算出每格的长度,通过用(下标×距离)的方式来计算出各个年坐标的left 2、通过(下标 × (年级每格长度 ÷ 12)来计算出每个月级坐标轴的距离本年级坐标轴的距离,那他的left就是(此距离 + 本年的left)3、日级坐标的我没有在这里算,具体的跟月级的差不多,采用的是 (下标 × ((年级每格长度 ÷ 12)÷当月的天数))来计算出每个坐标距离月级坐标的距离,那么它的left就是(此距离 + 刚刚月级距本年的距离 + 本年年的left) ps:计算日级的代码我在计算事件坐标位置的时候有体现
getYearsList() {
			// 集体分为几格
			const intervalNum = this.endYear - this.startYear + 1
			const signNum = intervalNum + 1
			const yeardArr = []
			// 计算年的left
			for (let i = 0; i < signNum; i++) {
				yeardArr.push({
					year: this.startYear + i,
					left: i * (100 / intervalNum)
				})
			}
			// 计算每个月坐标距本年坐标的距离
			this.monthsList.forEach(item => {
				item.left = (item.id - 1) * (100 / intervalNum / 12)
			})
			this.yearsList = yeardArr
		},
接下来就是计算事件的left,首先就是用split方法拿到年份、月份、日期,然后通过上述方法取得他的left,话不多说,直接上代码!
getTrueDataList() {
			const trueDataList = _.cloneDeep(this.dataList)
			trueDataList.forEach(item => {
				const yearList = item.occurrenceTime.split('-')
				// 通过上面计算的年列表找到本年的left
				const yearLeft = this.yearsList.find(item => {
					return item.year == Number(yearList[0])
				}).left
				// 通过上面计算的月列表找到本月的距离
				const monthLeft = this.monthsList.find(item => {
					return item.id == Number(yearList[1])
				}).left
				let monthDistance
				if (monthLeft === 0) {
					monthDistance = this.monthsList.find(item => {
						return item.id == Number(yearList[1]) + 1
					}).left
				}
				// 通过上面的月列表找到本月的天数
				const monthDays = this.monthsList.find(item => {
					return item.id == Number(yearList[1])
				}).days
				// 获取当天的left
				if (monthLeft !== 0) {
					item.left = yearLeft + monthLeft + (((monthLeft / (Number(yearList[1]) - 1)) / monthDays) * Number(yearList[2]))
				} else {
					item.left = yearLeft + monthLeft + ((monthDistance / monthDays) * Number(yearList[2]))
				}
			})
			this.trueDataList = trueDataList
		},
现在整个坐标轴的构建及事件列表的left也都计算出来的,由于还有滚轮放大缩小的效果,我这里用的是通过鼠标滚轮滚动来修改时间轴的长度,并设置定时器在每次滚动500毫秒后将选中的事件滚动到可视区域中央(这里我用的是scrollIntoView方法)
mounted() {
		// 设置事件监听
		document.getElementById("body").onmousewheel = (event) => {
			const dir = event.deltaY > 0 ? "Up" : "Down";
			if (dir == "Up") {
				this.zoomin();
			} else {
				this.zoomout();
			}
			return false;
		}
	},
zoomout() {
clearTimeout(this.timer)
document.getElementById("content").style.width = `${this.scale}%`;
this.scale += 50;
if (this.scale >= 700) {
this.isMonthShow = true
}
this.timer = setTimeout(() => {
document.getElementsByClassName('active-event')[0].scrollIntoView({
inline: 'center',
behavior: 'smooth',
})
}, 500)
},
zoomin() {
clearTimeout(this.timer)
document.getElementById("content").style.width = `${this.scale}%`;
this.scale -= 50;
if(this.scale < 95) {
this.scale = 95
}
if (this.scale < 700) {
this.isMonthShow = false
}
this.timer = setTimeout(() => {
document.getElementsByClassName('active-event')[0].scrollIntoView({
inline: 'center',
behavior: 'smooth',
})
}, 500)
},至此,整个历史事件时间轴就做完了,各位朋友如有需要可以借鉴,如果有好的优化方案也可以讨论一下,目前很大的问题就是做不到像放大一张图片那样,鼠标在哪里就以哪里为中心放大,因为是用的延长事件轴长度来放大,所以会默认往后延伸,如果哪位大佬有好的解决方案,请不吝赐教!最后在放一下整个的代码
<template>
<div class="main" id="body">
<div class="axle-wire" id="content">
<div>
<div v-for="(item, yearInd) in yearsList" :key="item.year" class="year-sign" :style="{left: `${item.left}%`}">
<div class="sign-icon-year"/>
<div class="sign-title-year" :style="{marginTop: isMonthShow ? '25px' : ''}">{{ `${item.year}年` }}</div>
</div>
<div v-for="(item, yearInd) in getMonthList" :key="yearInd">
<div v-for="(itm, monthInd) in monthsList" :key="monthInd" class="month-sign" :style="{left: `${item.left + itm.left}%`}">
<div class="sign-icon-month"/>
<div class="sign-title-month">{{ itm.month }}</div>
</div>
</div>
<div v-for="(ele, index) in trueDataList" :key="index" class="event-sign" :class="activeEvent === index ? 'active-event' : ''" :style="{left: `${ele.left}%`}">
<div class="event-icon" @click="selectEvent(index)"/>
<img v-if="activeEvent === index" class="event-img" src="./arrows_yellow.png">
<img v-else class="event-img" src="./arrows_blue.png">
<div class="event-title" :title="ele.label">{{ ele.label }}</div>
</div>
</div>
</div>
</div>
</template>
<script>
export default {
props: {
startYear: {
type: Number,
default: 2014,
},
endYear: {
type: Number,
default: 2023,
},
eventList: {
type: Array,
default: () => {},
},
},
data() {
return {
dataList: [
{
occurrenceTime: '2014-06-10',
label: '2014-06-10克里米亚危机'
},
{
occurrenceTime: '2021-12-31',
label: '2020-12-31明斯克签署和平协议'
},
{
occurrenceTime: '2019-01-31',
label: '2019-01-31明斯克签署和平协议'
},
{
occurrenceTime: '2018-07-15',
label: '2018-07-15克里米亚半岛局势紧张'
},
{
occurrenceTime: '2014-09-11',
label: '2014-09-11顿巴斯地区武装冲突'
},
{
occurrenceTime: '2015-08-06',
label: '2015-08-06乌克兰爆发政治危机'
},
{
occurrenceTime: '2015-08-07',
label: '2015-08-07乌克兰爆发政治危机'
},
{
occurrenceTime: '2015-08-08',
label: '2015-08-08乌克兰爆发政治危机'
},
],
monthsList: [
{
id: 1,
month: '1月',
days: 31
},
{
id: 2,
month: '2月',
days: 28
},
{
id: 3,
month: '3月',
days: 31
},
{
id: 4,
month: '4月',
days: 30
},
{
id: 5,
month: '5月',
days: 31
},
{
id: 6,
month: '6月',
days: 30
},
{
id: 7,
month: '7月',
days: 31
},
{
id: 8,
month: '8月',
days: 31
},
{
id: 9,
month: '9月',
days: 30
},
{
id: 10,
month: '10月',
days: 31
},
{
id: 11,
month: '11月',
days: 30
},
{
id: 12,
month: '12月',
days: 31
},
],
// 计算后的年列表
yearsList: [],
// 选中的事件
activeEvent: 0,
// 处理后用来展示的数据
trueDataList: [],
// 滚轮放大时的倍数
scale: 95,
// 滚动后回到选中事件的定时器
timer: null,
// 是否展示月份坐标
isMonthShow: false
};
},
computed: {
getMonthList() {
if (this.isMonthShow) {
return this.yearsList
} else {
return []
}
}
},
async created() {
this.getYearsList()
this.getTrueDataList()
},
mounted() {
// 设置事件监听
document.getElementById("body").onmousewheel = (event) => {
const dir = event.deltaY > 0 ? "Up" : "Down";
if (dir == "Up") {
this.zoomin();
} else {
this.zoomout();
}
return false;
}
},
methods: {
getYearsList() {
// 集体分为几格
const intervalNum = this.endYear - this.startYear + 1
const signNum = intervalNum + 1
const yeardArr = []
// 计算年的left
for (let i = 0; i < signNum; i++) {
yeardArr.push({
year: this.startYear + i,
left: i * (100 / intervalNum)
})
}
// 计算每个月坐标距本年坐标的距离
this.monthsList.forEach(item => {
item.left = (item.id - 1) * (100 / intervalNum / 12)
})
this.yearsList = yeardArr
},
getTrueDataList() {
const trueDataList = _.cloneDeep(this.dataList)
trueDataList.forEach(item => {
const yearList = item.occurrenceTime.split('-')
// 通过上面计算的年列表找到本年的left
const yearLeft = this.yearsList.find(item => {
return item.year == Number(yearList[0])
}).left
// 通过上面计算的月列表找到本月的距离
const monthLeft = this.monthsList.find(item => {
return item.id == Number(yearList[1])
}).left
let monthDistance
if (monthLeft === 0) {
monthDistance = this.monthsList.find(item => {
return item.id == Number(yearList[1]) + 1
}).left
}
// 通过上面的月列表找到本月的天数
const monthDays = this.monthsList.find(item => {
return item.id == Number(yearList[1])
}).days
// 获取当天的left
if (monthLeft !== 0) {
item.left = yearLeft + monthLeft + (((monthLeft / (Number(yearList[1]) - 1)) / monthDays) * Number(yearList[2]))
} else {
item.left = yearLeft + monthLeft + ((monthDistance / monthDays) * Number(yearList[2]))
}
})
this.trueDataList = trueDataList
},
selectEvent(index) {
this.activeEvent = index
},
zoomout() {
			clearTimeout(this.timer)
			document.getElementById("content").style.width = `${this.scale}%`;
			this.scale += 50;
			if (this.scale >= 700) {
				this.isMonthShow = true
			}
			this.timer = setTimeout(() => {
				document.getElementsByClassName('active-event')[0].scrollIntoView({
					inline: 'center',
					behavior: 'smooth',
				})
			}, 500)
		},
		zoomin() {
			clearTimeout(this.timer)
			document.getElementById("content").style.width = `${this.scale}%`;
			this.scale -= 50;
			if(this.scale < 95) {
				this.scale = 95
			}
			if (this.scale < 700) {
				this.isMonthShow = false
			}
			this.timer = setTimeout(() => {
				document.getElementsByClassName('active-event')[0].scrollIntoView({
					inline: 'center',
					behavior: 'smooth',
				})
			}, 500)
		},
},
};
</script>
<style lang="scss" scoped>
.main {
height: 100%;
width: 100%;
display: flex;
flex-direction: column;
justify-content: flex-end;
padding-bottom: 50px;
color: #fff;
overflow: auto;
.axle-wire {
width: 95%;
height: 1px;
margin: 0 auto;
background: linear-gradient(
to right,
rgba(1, 159, 251, 0) 0%,
rgba(1, 159, 251, 0.6) 5%,
rgba(1, 159, 251, 0.9) 10%,
rgba(1, 159, 251, 1) 20%,
rgba(1, 159, 251, 1) 80%,
rgba(1, 159, 251, 0.9) 90%,
rgba(1, 159, 251, 0.6) 95%,
rgba(1, 159, 251, 0) 100%
);
transition: all 0.5s;
> div {
position: relative;
margin: 0 auto;
width: 90%;
}
.year-sign, .month-sign {
position: absolute;
top: -7px;
min-width: 50px;
.sign-icon-year, .sign-icon-month {
width: 2px;
height: 6px;
background-color: #0194ea;
}
.sign-title-year, .sign-title-month {
position: absolute;
left: -50%;
margin-top: 10px;
color: #fff;
font-size: 15px;
font-weight: 700;
}
.sign-icon-month {
height: 4px;
}
.sign-title-month {
font-size: 14px;
left: -20%;
font-weight: 400;
}
}
.event-sign {
position: absolute;
top: -8px;
.event-icon {
position: absolute;
left: -4px;
width: 12px;
height: 12px;
border-radius: 50%;
background-color: #0194ea;
border: 1px solid #fff;
cursor: pointer;
}
.event-img {
position: absolute;
top: -42px;
left: -46px;
}
.event-title {
max-height: 75px;
width: 120px;
position: absolute;
bottom: 35px;
left: -60px;
font-size: 16px;
text-align: center;
border: 2px solid #0b3665;
background-color: #09233e;
color: #4781c0;
overflow: hidden;
display: -webkit-box;
-webkit-box-orient: vertical;
-webkit-line-clamp: 3;
text-overflow: ellipsis;
}
.event-title::before {
content: "";
display: inline-block;
width: 0;
height: 15px;
border: 1px solid #429bff;
position: absolute;
left: -2px;
top: 17px;
}
.event-title::after {
content: "";
display: inline-block;
width: 0;
height: 15px;
border: 1px solid #429bff;
position: absolute;
right: -2px;
top: 17px;
}
}
.active-event {
z-index: 1;
.event-icon {
background-color: #ecd53c;
}
.event-title {
border: 2px solid #525029;
background-color: #282c23;
color: #fff;
}
.event-title::after, .event-title::before {
content: unset;
}
}
}
}
</style>


 97
97

 被折叠的 条评论
为什么被折叠?
被折叠的 条评论
为什么被折叠?
 到【灌水乐园】发言


