MATLAB 图例

目录

创建

1.创建图例-legend函数

2. 自定义图例-text函数

外观

1.位置-Location

2.大小-Location

3.其他属性-TextColor、FontSize

高级技巧

1.自定义图例项标识-DisplayName

2.多列图例-NumColumns

3.隐藏特定数据系列-HandleVisibility

4.自动更新图例-AutoUpdate

5.LaTeX 表达式-Interpreter


创建

在 MATLAB 中,您可以使用`legend`函数来创建图例。图例可以显示不同曲线的标识符和颜色,并帮助解释图形的含义。

1.创建图例-legend函数

以下是创建和自定义图例的示例代码:

% 创建一些数据和曲线
x = linspace(0, 2*pi, 100);
y1 = sin(x);
y2 = cos(x);
figure; % 创建新的图形窗口
% 绘制曲线并设置线条属性
plot(x, y1, 'r', 'LineWidth', 2);
hold on; % 在同一图形窗口中保持曲线
plot(x, y2, 'b--', 'LineWidth', 2);
% 创建图例
legend('sin(x)', 'cos(x)', 'Location', 'best');
% 可选:自定义图例的其他属性
legend('boxoff'); % 关闭图例的边框
legend('FontSize', 12); % 设置图例文本的字体大小

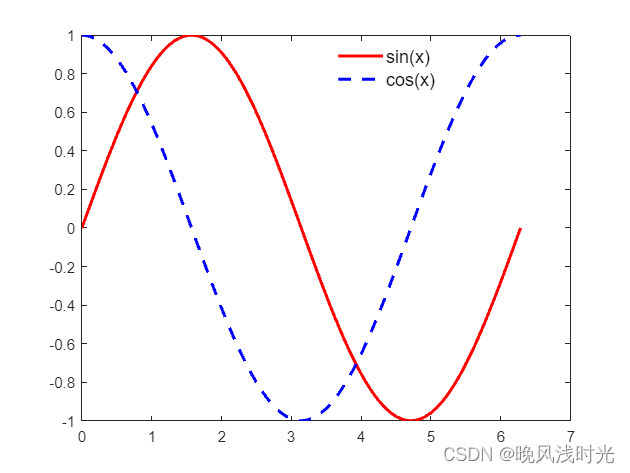
该示例将创建一个带有两个曲线的图形,并在图形的最优位置添加一个图例。您可以通过在`legend`函数中使用不同的参数来改变图例的位置和外观。

2. 自定义图例-text函数

如果您需要更多的灵活性来创建图例,您可以手动创建一个自定义图例。通过在图上使用文本标注和线条,您可以创建自己的图例。

x = linspace(0, 2*pi, 100);
y1 = sin(x);
y2 = cos(x);
figure;
plot(x, y1, 'r', 'LineWidth', 2);
hold on;
plot(x, y2, 'b--', 'LineWidth', 2);
legend_text1 = 'sin(x)';
legend_text2 = 'cos(x)';
text(0.2, 0.9, legend_text1, 'Color', 'r', 'FontSize', 12);
text(0.2, 0.8, legend_text2, 'Color', 'b', 'FontSize', 12);
line([0.1, 0.15], [0.89, 0.89], 'Color', 'r', 'LineWidth', 2);
line([0.1, 0.15], [0.79, 0.79], 'Color', 'b', 'LineStyle', '--', 'LineWidth', 2);

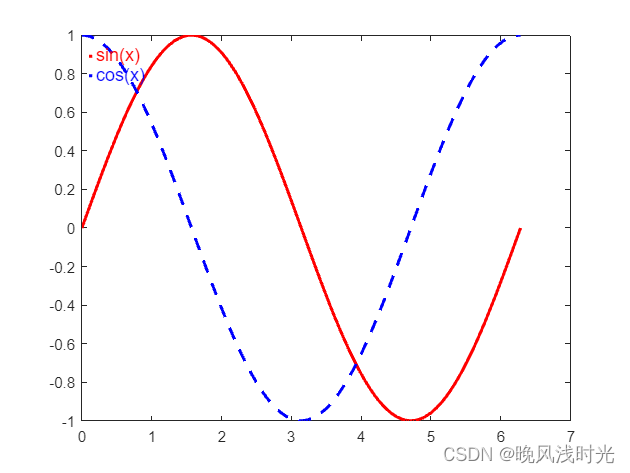
在这个示例中,我们使用`text`函数创建了两个文本标注作为图例项,并使用`line`函数创建了对应的线条。您可以根据需要调整位置、颜色和样式以及文本的格式

外观

1.位置-Location

图例位置选项:`legend`函数有几个选项可用于指定图例的位置。常用的选项包括:`'best'`(自动选择最佳位置)、`'northwest'`、`'northeast'`、`'southwest'`、`'southeast'`等。您还可以使用数字向量指定图例的位置,例如`[0.2, 0.8, 0.1, 0.1]`表示图例左下角的位置和大小。

x = linspace(0, 2*pi, 100);
y = [sin(x); cos(x); tan(x)];
figure;
plot(x, y(1,:), 'r', 'LineWidth', 2, 'DisplayName', 'sin(x)');
hold on;
plot(x, y(2,:), 'b--', 'LineWidth', 2, 'DisplayName', 'cos(x)');
plot(x, y(3,:), 'g-', 'LineWidth', 2, 'DisplayName', 'tan(x)');
legend('Location', [0.2, 0.8, 0.1, 0.1]);

2.大小-Location

调整图例的大小:您可以使用`legend`函数的`'Position'`选项来自定义图例的大小。

x = linspace(0, 2*pi, 100);
y1 = sin(x);
y2 = cos(x);
figure;
plot(x, y1, 'r', 'LineWidth', 2, 'DisplayName', 'sin(x)');
hold on;
plot(x, y2, 'b--', 'LineWidth', 2, 'DisplayName', 'cos(x)');
legend('Location', 'northeast', 'Location', [0.7, 0.2, 0.15, 0.2]);

在这个示例中,图例的位置被设置为右上角,通过调整`Position`参数中的坐标值,您可以将图例放置在其他位置,并通过调整宽度和高度来调整图例的大小。

3.其他属性-TextColor、FontSize

使用图例项的其他属性:您可以通过设置`plot`函数中的属性和使用`legend`函数的选项来定制图例项的外观。例如,您可以设置曲线的颜色和线型,以及图例项的线宽和样式。

x = linspace(0, 2*pi, 100);
y1 = sin(x);
y2 = cos(x);
figure;
plot(x, y1, 'r', 'LineWidth', 2, 'DisplayName', 'sin(x)');77
hold on;
plot(x, y2, 'b--', 'LineWidth', 1.5, 'DisplayName', 'cos(x)');
legend('Location', 'best', 'TextColor', 'blue', 'FontSize', 12, 'EdgeColor', 'none');

高级技巧

1.自定义图例项标识-DisplayName

可以使用不同的标识符表示每个数据系列。您可以在`plot`函数中使用`DisplayName`参数来为每个曲线指定标识符,并在创建图例时使用`legend`函数的`'DisplayName'`选项来显示这些标识符。

x = linspace(0, 2*pi, 100);
y1 = sin(x);
y2 = cos(x);
figure;
plot(x, y1, 'r', 'LineWidth', 2, 'DisplayName', 'sin(x)');
hold on;
plot(x, y2, 'b--', 'LineWidth', 2, 'DisplayName', 'cos(x)');
legend('Location', 'best');

2.多列图例-NumColumns

如果您有很多数据系列,并且希望将图例分成多列以便更好地排列,可以使用`'NumColumns'`选项。

x = linspace(0, 2*pi, 100);
y1 = sin(x);
y2 = cos(x);
y3 = tan(x);
figure;
plot(x, y1, 'r', 'LineWidth', 2, 'DisplayName', 'sin(x)');
hold on;
plot(x, y2, 'b--', 'LineWidth', 2, 'DisplayName', 'cos(x)');
plot(x, y3, 'g-', 'LineWidth', 2, 'DisplayName', 'tan(x)');
legend('Location', 'best', 'NumColumns', 2);

3.隐藏特定数据系列-HandleVisibility

果您有多个数据系列,但只想在图例中显示其中一部分,可以使用`'HandleVisibility'`属性。将需要隐藏的曲线的`'HandleVisibility'`设置为`'off'`,然后再创建图例即可。

x = linspace(0, 2*pi, 100);
y1 = sin(x);
y2 = cos(x);
y3 = tan(x);
figure;
plot(x, y1, 'r', 'LineWidth', 2, 'DisplayName', 'sin(x)');
hold on;
plot(x, y2, 'b--', 'LineWidth', 2, 'DisplayName', 'cos(x)');
plot(x, y3, 'g-', 'LineWidth', 2, 'HandleVisibility', 'off');
legend('Location', 'best');

4.自动更新图例-AutoUpdate

当您在运行不断更新的循环中绘制曲线时,您可以使用`'AutoUpdate'`选项来自动更新图例。

x = linspace(0, 2*pi, 100);
figure;
for i = 1:10
y = sin(x + i/10);
plot(x, y, 'LineWidth', 2, 'DisplayName', ['sin(x + ' num2str(i/10) ')']);
hold on;
pause(0.3);
legend('Location', 'best', 'AutoUpdate', 'on');
end

在这个示例中,您将在循环中绘制10个曲线,每次迭代时都会自动更新图例以反映新的曲线。

5.LaTeX 表达式-Interpreter

使用 LaTeX 标签和格式化文本:您可以在图例项中使用 LaTeX 表达式来显示数学符号、希腊字母等。通过在标识符字符串前面加上`'$'`和`'$'`,您可以将其解释为 LaTeX 表达式。

x = linspace(0, 2*pi, 100);
y1 = sin(x);
y2 = cos(x);
figure;
plot(x, y1, 'r', 'LineWidth', 2, 'DisplayName', '$\sin(x)$');
hold on;
plot(x, y2, 'b--', 'LineWidth', 2, 'DisplayName', '$\cos(x)$');
legend('Interpreter', 'latex', 'Location', 'best');

在这个示例中,图例项中的标识符字符串被解释为 LaTeX 表达式,并在图例中以数学符号的形式显示。

(代编图形代码,后台私信)

  • 7
    点赞
  • 60
    收藏
    觉得还不错? 一键收藏
  • 打赏
    打赏
  • 0
    评论

“相关推荐”对你有帮助么?

  • 非常没帮助
  • 没帮助
  • 一般
  • 有帮助
  • 非常有帮助
提交
评论
添加红包

请填写红包祝福语或标题

红包个数最小为10个

红包金额最低5元

当前余额3.43前往充值 >
需支付:10.00
成就一亿技术人!
领取后你会自动成为博主和红包主的粉丝 规则
hope_wisdom
发出的红包

打赏作者

晚风浅时光

你的鼓励将是我创作的最大动力

¥1 ¥2 ¥4 ¥6 ¥10 ¥20
扫码支付:¥1
获取中
扫码支付

您的余额不足,请更换扫码支付或充值

打赏作者

实付
使用余额支付
点击重新获取
扫码支付
钱包余额 0

抵扣说明:

1.余额是钱包充值的虚拟货币,按照1:1的比例进行支付金额的抵扣。
2.余额无法直接购买下载,可以购买VIP、付费专栏及课程。

余额充值