Es接入Prometheus

环境准备

elasticsearch exporter选用git上开源项目https://github.com/justwatchcom/elasticsearch_exporter

以beta环境为例,beta环境的Es集群信息如下:


ip

server port

Es node110.27.22.153http://elk9006.eniot.io:9200/
Es node210.27.22.154http://elk9007.eniot.io:9200/
Es node310.27.22.155http://elk9008.eniot.io:9200/

选择最新的版本,本文选用的版本为elasticsearch_exporter-1.1.0.linux-amd64.tar.gz


操作流程

1、登录Es node,下载elasticsearch exporter并解压

2、新增/etc/systemd/system/elasticsearch_exporter.service,内容如下(注意开启--es.all参数后会上报其他节点的信息,所以exporter只部署在一台机器上即可)

[Unit]

Description=Prometheus elasticsearch_exporter

After=local-fs.target network-online.target network.target

Wants=local-fs.target network-online.target network.target


[Service]

User=root

Nice=10

ExecStart=/home/envuser/elasticsearch_exporter-1.1.0/elasticsearch_exporter --es.uri=http://elk9006.eniot.io:9200 --web.listen-address=:9104 --es.timeout=20s --es.all --es.indices_settings --es.cluster_settings

ExecStop=/usr/bin/killall elasticsearch_exporter


[Install]

WantedBy=default.target

可选参数的作用

usage: elasticsearch_exporter [<flags>]


Flags:

  -h, --help                 Show context-sensitive help (also try --help-long and --help-man).

      --web.listen-address=":9114"

                             Address to listen on for web interface and telemetry.

      --web.telemetry-path="/metrics"

                             Path under which to expose metrics.

      --es.uri="http://localhost:9200"

                             HTTP API address of an Elasticsearch node.

      --es.timeout=5s        Timeout for trying to get stats from Elasticsearch.

      --es.all               Export stats for all nodes in the cluster. If used, this flag will override the flag es.node.

      --es.node="_local"     Node's name of which metrics should be exposed.

      --es.indices           Export stats for indices in the cluster.

      --es.indices_settings  Export stats for settings of all indices of the cluster.

      --es.cluster_settings  Export stats for cluster settings.

      --es.shards            Export stats for shards in the cluster (implies --es.indices).

      --es.snapshots         Export stats for the cluster snapshots.

      --es.clusterinfo.interval=5m

                             Cluster info update interval for the cluster label

      --es.ca=""             Path to PEM file that contains trusted Certificate Authorities for the Elasticsearch connection.

      --es.client-private-key=""

                             Path to PEM file that contains the private key for client auth when connecting to Elasticsearch.

      --es.client-cert=""    Path to PEM file that contains the corresponding cert for the private key to connect to Elasticsearch.

      --es.ssl-skip-verify   Skip SSL verification when connecting to Elasticsearch.

      --log.level="info"     Sets the loglevel. Valid levels are debug, info, warn, error

      --log.format="logfmt"  Sets the log format. Valid formats are json and logfmt

      --log.output="stdout"  Sets the log output. Valid outputs are stdout and stderr

      --version              Show application version.


3、执行命令启动elasticsearch exporter

# systemctl daemon-reload

# systemctl start elasticsearch_exporter

4、启动后,exporter会使用指定的metrics端口9104,可以执行如下命令进行验证

# systemctl status -l elasticsearch_exporter

● elasticsearch_exporter.service - Prometheus elasticsearch_exporter

   Loaded: loaded (/etc/systemd/system/elasticsearch_exporter.service; disabled; vendor preset: disabled)

   Active: active (running) since Thu 2020-01-09 12:13:37 UTC; 2s ago

 Main PID: 24699 (elasticsearch_e)

   CGroup: /system.slice/elasticsearch_exporter.service

           └─24699 /home/envuser/elasticsearch_exporter-1.1.0/elasticsearch_exporter --es.uri=http://elk9006.eniot.io:9200 --web.listen-address=:9104


Jan 09 12:13:37 elk9006 systemd[1]: Started Prometheus elasticsearch_exporter.

Jan 09 12:13:37 elk9006 systemd[1]: Starting Prometheus elasticsearch_exporter...

Jan 09 12:13:37 elk9006 elasticsearch_exporter[24699]: level=info ts=2020-01-09T12:13:37.530309352Z caller=clusterinfo.go:200 msg="triggering initial cluster info call"

Jan 09 12:13:37 elk9006 elasticsearch_exporter[24699]: level=info ts=2020-01-09T12:13:37.530498253Z caller=clusterinfo.go:169 msg="providing consumers with updated cluster info label"

Jan 09 12:13:37 elk9006 elasticsearch_exporter[24699]: level=info ts=2020-01-09T12:13:37.533559261Z caller=main.go:148 msg="started cluster info retriever" interval=5m0s

Jan 09 12:13:37 elk9006 elasticsearch_exporter[24699]: level=info ts=2020-01-09T12:13:37.533727361Z caller=main.go:188 msg="starting elasticsearch_exporter" addr=:9104

5、修改Prometheus server 上的prometheus.yaml,加入如下内容

# Es_exporter

- job_name: 'Es_exporter'

  static_configs:

  - targets: ['elk9006.eniot.io:9114']

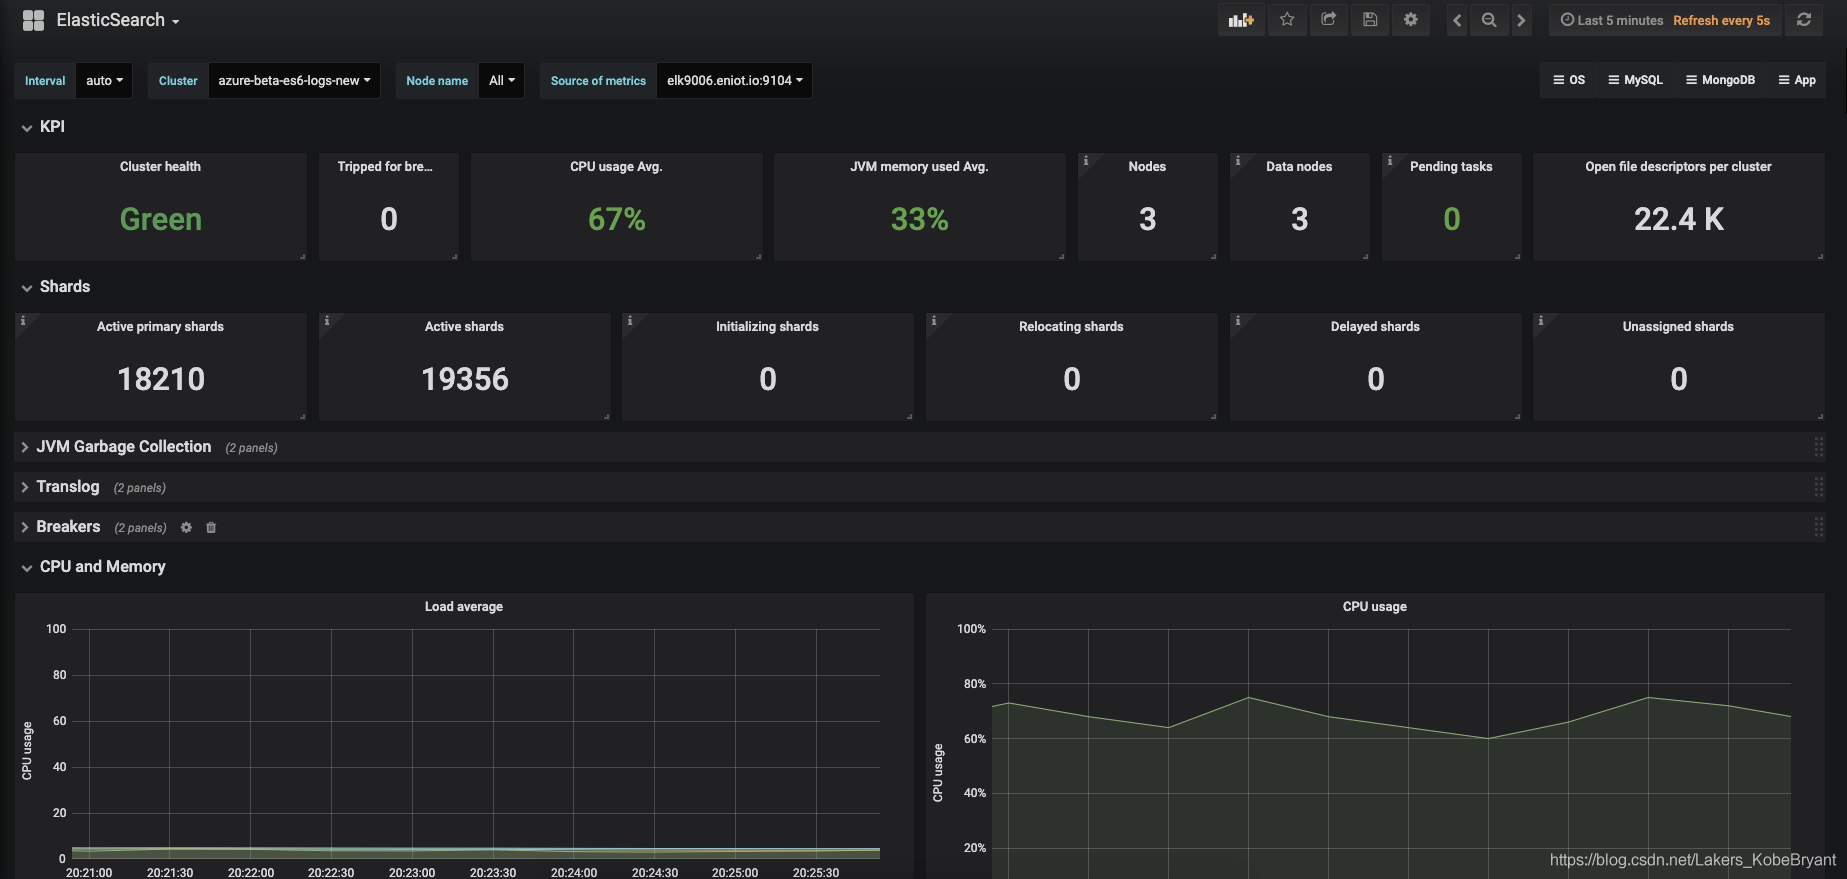
6、在Grafana上新增dashboard,id:2322

效果展示


  • 0
    点赞
  • 0
    收藏
    觉得还不错? 一键收藏
  • 0
    评论

“相关推荐”对你有帮助么?

  • 非常没帮助
  • 没帮助
  • 一般
  • 有帮助
  • 非常有帮助
提交
评论
添加红包

请填写红包祝福语或标题

红包个数最小为10个

红包金额最低5元

当前余额3.43前往充值 >
需支付:10.00
成就一亿技术人!
领取后你会自动成为博主和红包主的粉丝 规则
hope_wisdom
发出的红包
实付
使用余额支付
点击重新获取
扫码支付
钱包余额 0

抵扣说明:

1.余额是钱包充值的虚拟货币,按照1:1的比例进行支付金额的抵扣。
2.余额无法直接购买下载,可以购买VIP、付费专栏及课程。

余额充值