


ELK工作流程
-
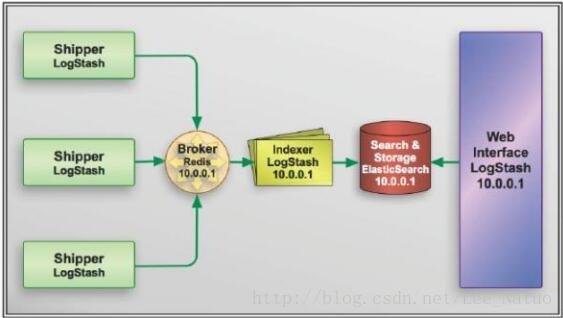
多个独立的Agent(Shipper)负责收集不同来源的数据,一个中心Agent(Indexer)负责汇总和分析数据,在中心Agent前的Broker(使用Redis实现)作为缓冲区,中心Agent后的ElasticSearch用于存储和搜索数据,前端的Kibana提供丰富的图表展示。
-
Shipper表示日志收集,使用LogStash收集各种来源的日志数据,可以是系统日志、文件、Redis、mq等等;
-
Broker作为远程Agent与中心Agent之间的缓冲区,使用Redis实现,一是可以提高系统的性能,二是可以提高系统的可靠性,当中心Agent提取数据失败时,数据保存在Redis中,而不至于丢失;
-
中心Agent(Indexer)也是LogStash,从Broker中提取数据,可以执行相关的分析和处理(Filter);
-
ElasticSearch用于存储最终的数据,并提供搜索功能;
-
Kibana提供一个简单、丰富的Web界面,数据来自于ElasticSearch,支持各种查询、统计和展示
机器部署
| 系统 | IP | 配置 |
|---|---|---|
| CentOS 6.5 | 192.168.123.2 | Logstash |
| CentOS 6.5 | 192.168.123.3 | ES+Kibana |
Logstash
(Logstash部署在IP为192.168.123.2的机器上。)
数据流
input|decode|filter|encode|output

安装和配置
1.安装Java环境
[root@localhost ~]# yum install java-1.8.0-openjdk
[root@localhost ~]# export JAVA_HOME=/usr/java
[root@localhost bin]# which java
/usr/bin/java
2.下载并安装GPG key
[root@localhost ~]# rpm --import http://packages.elasticsearch.org/GPG-KEY-elasticsearch
3.yum源配置
[root@localhost ~]# cat > /etc/yum.repos.d/logstash.repo <<EOF
[logstash-5.0]
name=logstash repository for 5.0.x packages
baseurl=http://packages.elasticsearch.org/logstash/5.0/centos
gpgcheck=1
gpgkey=http://packages.elasticsearch.org/GPG-KEY-elasticsearch
enabled=1
EOF
[root@localhost ~]# yum clean all
3.安装Logstash
[root@localhost ~]# yum install logstash
4.安装目录
[root@localhost ~]# whereis logstash
logstash: /etc/logstash /usr/share/logstash
/etc/logstash/conf.d #配置文件目录,默认是空的,需要自己写
/usr/share/logstash/bin/logstash #执行文件
5.编辑一个简单的配置文件
[root@localhost bin]# cd /etc/logstash/conf.d
[root@localhost bin]# vim 1.conf
#1.conf文件内容
input{
stdin{}
}
output{
stdout{}
}
################################
input插件stdin(标准输入)
output插件 stdout(标准输出)
/opt/logstash/bin/logstash 前台启动
提示:标准输入和标准输出的意思就是我们输入什么就会输出什么
将日志存储到ES中的配置:
input {
sdin {}
}
filter{
}
output{
elasticsearch {
hosts => ["192.168.123.3:9200"]
index => "logstash-%{+YYYY.MM.dd}"
}
stdout{
codec => rubydebug
}
}
6.运行测试
[root@localhost ~]# cd /usr/share/logstash/bin
[root@localhost ~]# ./logstash -e 'input{stdin{}}output{stdout{} }'
#-e参数表示执行,然后会发现终端在等待你的输入。没问题,敲入 hello,ichunqiu! ,回车,然后看看会返回什么结果。
结果:
OpenJDK 64-Bit Server VM warning: If the number of processors is expected to increase from one, then you should configure the number of parallel GC threads appropriately using -XX:ParallelGCThreads=N
hello,ichunqiu!
--- jar coordinate com.fasterxml.jackson.core:jackson-annotations already loaded with version 2.7.1 - omit version 2.7.0
--- jar coordinate com.fasterxml.jackson.core:jackson-databind already loaded with version 2.7.1 - omit version 2.7.1-1
Sending logstash logs to /var/log/logstash/logstash.log.
Pipeline main started
2017-12-16T13:23:56.586Z localhost.localdomain hello,ichunqiu!
2017-12-16T13:23:56.586Z localhost.localdomain hello,ichunqiu!
7.遇到的问题:
[root@localhost bin]# ./logstash -e 'input{stdin{}}output{stdout{codec=>rubydebug} }'
OpenJDK 64-Bit Server VM warning: If the number of processors is expected to increase from one, then you should configure the number of parallel GC threads appropriately using -XX:ParallelGCThreads=N
--- jar coordinate com.fasterxml.jackson.core:jackson-annotations already loaded with version 2.7.1 - omit version 2.7.0
--- jar coordinate com.fasterxml.jackson.core:jackson-databind already loaded with version 2.7.1 - omit version 2.7.1-1
Logstash has a new settings file which defines start up time settings. This file is typically located in $LS_HOME/config or /etc/logstash. If you installed Logstash through a package and are starting it manually please specify the location to this settings file by passing in "--path.settings=/path/.." in the command line options {:level=>:warn}
Failed to load settings file from "path.settings". Aborting... {"path.settings"=>"/usr/share/logstash/config", "exception"=>Errno::ENOENT, "message"=>"No such file or directory - /usr/share/logstash/config/logstash.yml", :level=>:fatal}
解决方法:
[root@localhost bin]# whereis logstash
logstash: /etc/logstash /usr/share/logstash
[root@localhost bin]# cp -r /etc/logstash/logstash.yml /usr/share/logstash/config/logstash.yml
ElasticSearch
数据流

安装和配置
如果是在不同机器上安装,则需要像Logstash的步骤1一样配置好Java环境。
(本文在不同机器上部署,以下配置在IP为192.168.123.3的机器上进行。)
1.下载并安装GPG key
[root@localhost ~]# rpm --import https://packages.elastic.co/GPG-KEY-elasticsearch
2.yum源配置
[root@localhost ~]# cat >/etc/yum.repos.d/elasticsearch.repo<<EOF
[elasticsearch-2.x]
name=Elasticsearch repository for 2.x packages
baseurl=http://packages.elastic.co/elasticsearch/2.x/centos
gpgcheck=1
gpgkey=http://packages.elastic.co/GPG-KEY-elasticsearch
enabled=1
EOF
[root@localhost ~]# yum clean all
3.安装ElasticSearch
[root@localhost ~]# yum install elasticsearch
4.安装目录
[root@localhost ~]# whereis elasticsearch
elasticsearch: /etc/elasticsearch /usr/share/elasticsearch
/etc/elasticsearch/elasticsearch.yml #配置文件目录,默认是空的,需要自己写
/usr/share/elasticsearch/bin/elasticsearch #执行文件
5.修改 limits.conf
#在结尾添加如下两行代码
[root@localhost ~]#vi /etc/security/limits.conf
elasticsearch soft memlock unlimited
elasticsearch hard memlock unlimited

#检查
[root@localhost ~]# tail -2 /etc/security/limits.conf
elasticsearch soft memlock unlimited
elasticsearch hard memlock unlimited
6.创建目录并授权
[root@localhost ~]# mkdir -p /data/es-data
[root@localhost ~]# chown -R elasticsearch.elasticsearch /data/es-data/
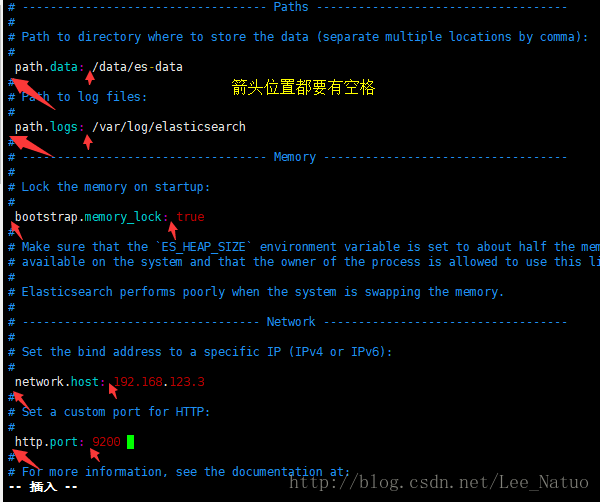
7.配置elasticsearch.yml
[root@localhost bin]# vim /etc/elasticsearch/elasticsearch.yml
cluster.name: elk-cluster # 集群的名称
node.name: linux-node1 # 节点的名称
path.data: /data/es-data # 数据存储的目录(多个目录使用逗号分隔)
path.logs: /var/log/elasticsearch # 日志路径
bootstrap.mlockall: true # 锁住内存,使内存不会分配至交换区(swap)
network.host:192.168.123.3 # 本机IP地址
http.port: 9200 # 端口默认9200
#查看配置文件
[root@localhost bin]#  grep '^[a-z]' /etc/elasticsearch/elasticsearch.yml
cluster.name: elk-cluster
path.data: /data/es-data
path.logs: /var/log/elasticsearch
bootstrap.memory_lock: true
network.host: 192.168.123.3
http.port: 9200
8.启动ElasticSearch
[root@localhost elasticsearch]# /etc/init.d/elasticsearch start
正在启动 elasticsearch:OpenJDK 64-Bit Server VM warning: If the number of processors is expected to increase from one, then you should configure the number of parallel GC threads appropriately using -XX:ParallelGCThreads=N
[确定]
8.检查启动
[root@localhost init.d]# ps -ef|grep elasticsearch
498 4094 1 42 22:46 ? 00:00:20 /usr/bin/java -Xms256m -Xmx1g -Djava.awt.headless=true -XX:+UseParNewGC -XX:+UseConcMarkSweepGC -XX:CMSInitiatingOccupancyFraction=75 -XX:+UseCMSInitiatingOccupancyOnly -XX:+HeapDumpOnOutOfMemoryError -XX:+DisableExplicitGC -Dfile.encoding=UTF-8 -Djna.nosys=true -Des.path.home=/usr/share/elasticsearch -cp /usr/share/elasticsearch/lib/elasticsearch-2.4.6.jar:/usr/share/elasticsearch/lib/* org.elasticsearch.bootstrap.Elasticsearch start -p /var/run/elasticsearch/elasticsearch.pid -d -Des.default.path.home=/usr/share/elasticsearch -Des.default.path.logs=/var/log/elasticsearch -Des.default.path.data=/var/lib/elasticsearch -Des.default.path.conf=/etc/elasticsearch
root 4142 1524 0 22:47 pts/0 00:00:00 grep elasticsearch
9.访问测试
#Linux下访问:
[root@localhost init.d]# curl 192.168.123.3:9200
{
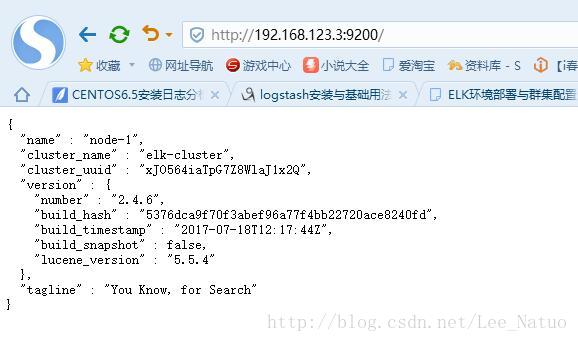
"name" : "node-1",
"cluster_name" : "elk-cluster",
"cluster_uuid" : "xJO564iaTpG7Z8WlaJ1x2Q",
"version" : {
"number" : "2.4.6",
"build_hash" : "5376dca9f70f3abef96a77f4bb22720ace8240fd",
"build_timestamp" : "2017-07-18T12:17:44Z",
"build_snapshot" : false,
"lucene_version" : "5.5.4"
},
"tagline" : "You Know, for Search"
}

windows下访问:
10.遇到的问题;
[root@localhost elasticsearch]# /etc/init.d/elasticsearch start
#运行该命令时失败
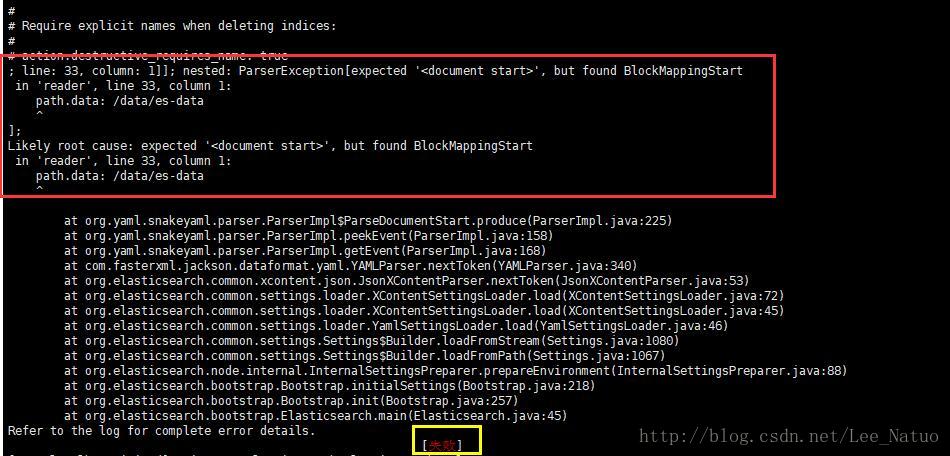
解决方法:
在错误提示的地方加空格。
11.安装Elasticsearch插件
-
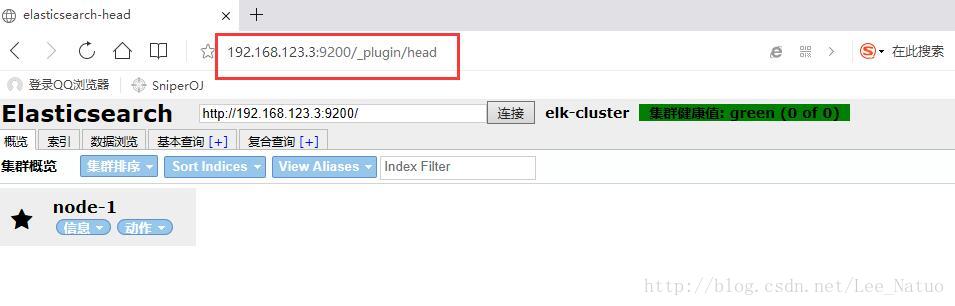
Head
-
插件作用:主要是做ES集群管理。
-
[root@localhost init.d]# /usr/share/elasticsearch/bin/plugin install mobz/elasticsearch-head
-> Installing mobz/elasticsearch-head...
Trying https://github.com/mobz/elasticsearch-head/archive/master.zip ...
Downloading ......................................................................................................................................................................................................................................................................................................................................................................................................................................................................................................................................................................................DONE
Verifying https://github.com/mobz/elasticsearch-head/archive/master.zip checksums if available ...
NOTE: Unable to verify checksum for downloaded plugin (unable to find .sha1 or .md5 file to verify)
Installed head into /usr/share/elasticsearch/plugins/head #安装路径
#访问
在浏览器中访问地址:http://ip地址:9200/_plugin/head/
Kibana
安装和配置
1.下载并安装GPG Key:
rpm --import https://packages.elastic.co/GPG-KEY-elasticsearch
2.yum源配置
[root@localhost ~]# vim /etc/yum.repos.d/kibana.repo
[kibana-4.5]
name=Kibana repository for 4.5.x packages
baseurl=http://packages.elastic.co/kibana/4.5/centos
gpgcheck=1
gpgkey=http://packages.elastic.co/GPG-KEY-elasticsearch
enabled=1
[root@localhost ~]# yum clean all
3.安装Logstash
[root@localhost ~]# yum install kibana
4.安装目录
[root@localhost ~]# whereis kibana
kibana: /opt/kibana/bin/kibana /opt/kibana/bin/kibana.bat
5.修改配置文件
[root@localhost ~]# vim /opt/kibana/config/kibana.yml
[root@abcdocker ~]# grep "^[a-Z]" /opt/kibana/config/kibana.yml
server.port: 5601 #端口,默认5601
server.host: "0.0.0.0" #主机
elasticsearch.url: "http://192.168.123.3:9200" #es地址
kibana.index: ".kibana" #kibana是一个小系统,自己也需要存储数据(将kibana的数据保存到.kibana的索引中,会在ES里面创建一个.kibana)
# elasticsearch.username: "user" kibana中的es插件是需要收费的,所以无法使用
# elasticsearch.password: "pass"
6.启动Kibana
[root@abcdocker ~]# /etc/init.d/kibana start
#ES也要开启。
7.检查端口
[root@localhost ~]# netstat -lntup
Active Internet connections (only servers)
Proto Recv-Q Send-Q Local Address Foreign Address State PID/Program name
tcp 0 0 0.0.0.0:111 0.0.0.0:* LISTEN 1104/rpcbind
tcp 0 0 0.0.0.0:21 0.0.0.0:* LISTEN 1321/vsftpd
tcp 0 0 0.0.0.0:22 0.0.0.0:* LISTEN 1310/sshd
tcp 0 0 127.0.0.1:631 0.0.0.0:* LISTEN 1180/cupsd
tcp 0 0 127.0.0.1:25 0.0.0.0:* LISTEN 1397/master
tcp 0 0 0.0.0.0:37212 0.0.0.0:* LISTEN 1122/rpc.statd
tcp 0 0 0.0.0.0:5601 0.0.0.0:* LISTEN 1671/node
tcp 0 0 :::111 :::* LISTEN 1104/rpcbind
tcp 0 0 :::22 :::* LISTEN 1310/sshd
tcp 0 0 ::1:631 :::* LISTEN 1180/cupsd
tcp 0 0 ::1:25 :::* LISTEN 1397/master
tcp 0 0 :::49031 :::* LISTEN 1122/rpc.statd
udp 0 0 0.0.0.0:111 0.0.0.0:* 1104/rpcbind
udp 0 0 0.0.0.0:631 0.0.0.0:* 1180/cupsd
udp 0 0 0.0.0.0:55684 0.0.0.0:* 1122/rpc.statd
udp 0 0 0.0.0.0:855 0.0.0.0:* 1104/rpcbind
udp 0 0 0.0.0.0:874 0.0.0.0:* 1122/rpc.statd
udp 0 0 :::111 :::* 1104/rpcbind
udp 0 0 :::48298 :::* 1122/rpc.statd
udp 0 0 :::855 :::* 1104/rpcbind
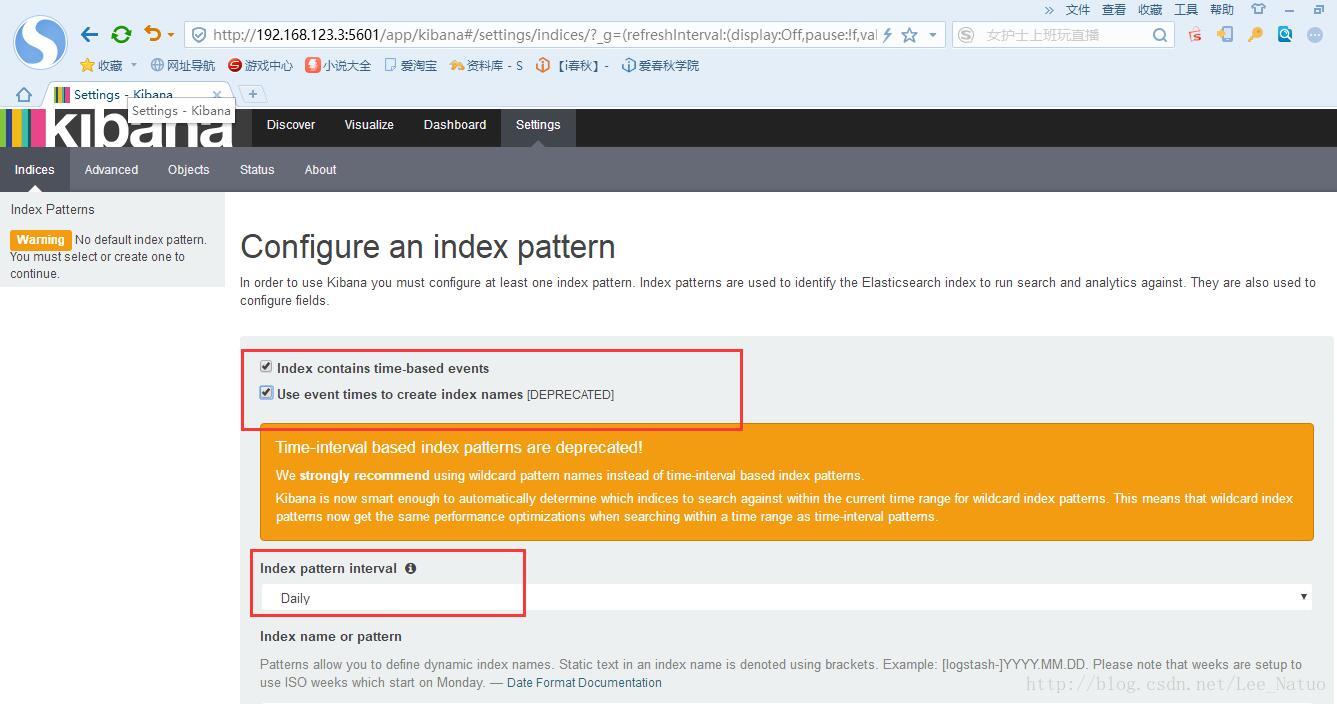
8.访问
访问地址:http://192.168.123.3:5601
参考链接
[1]http://blog.csdn.net/abcdocker/article/details/64441524 ELK Stack 实战之 Elasticsearch
[2]https://www.cnblogs.com/nulige/p/6680336.html ELK Stack介绍与入门实践
[3]http://blog.51cto.com/tangtangit/1831847 ELK环境部署与群集配置
[4]https://www.cnblogs.com/toSeek/p/6099090.html logstash安装与基础用法
[5]http://blog.51cto.com/welcomeweb/1684696?sort=desc CENTOS6.5安装日志分析ELK elasticsearch + logstash + redis + kibana


 113
113

 被折叠的 条评论
为什么被折叠?
被折叠的 条评论
为什么被折叠?
 到【灌水乐园】发言


