


The Difference between Linear and Nonlinear Regression Models
The difference between linear and nonlinear regression models isn’t as straightforward as it sounds. You’d think that linear equations produce straight lines and nonlinear equations model curvature. Unfortunately, that’s not correct. Both types of models can fit curves to your data—so that’s not the defining characteristic. In this post, I’ll teach you how to identify linear and nonlinear regression models.
The difference between nonlinear and linear is the “non.” OK, that sounds like a joke, but, honestly, that’s the easiest way to understand the difference. First, I’ll define what linear regression is, and then everything else must be nonlinear regression. I’ll include examples of both linear and nonlinear regression models.

Linear Regression Equations
A linear regression model follows a very particular form. In statistics, a regression model is linear when all terms in the model are one of the following:
- The constant
- A parameter multiplied by an independent variable (IV)
Then, you build the equation by only adding the terms together. These rules limit the form to just one type:
Dependent variable = constant + parameter * IV + … + parameter * IV
![]()
Statisticians say that this type of regression equation is linear in the parameters. However, it is possible to model curvature with this type of model. While the function must be linear in the parameters, you can raise an independent variable by an exponent to fit a curve. For example, if you square an independent variable, the model can follow a U-shaped curve.
![]()
While the independent variable is squared, the model is still linear in the parameters. Linear models can also contain log terms and inverse terms to follow different kinds of curves and yet continue to be linear in the parameters.
The regression example below models the relationship between body mass index (BMI) and body fat percent. It is a linear model that uses a quadratic (squared) term to model the curved relationship.
Nonlinear Regression Equations
showed how linear regression models have one basic configuration. Now, we’ll focus on the “non” in nonlinear! If a regression equation doesn’t follow the rules for a linear model, then it must be a nonlinear model. It’s that simple! A nonlinear model is literally not linear.
The added flexibility opens the door to a huge number of possible forms. Consequently, nonlinear regression can fit an enormous variety of curves. However, because there are so many candidates, you may need to conduct some research to determine which functional form provides the best fit for your data.
Below, I present a handful of examples that illustrate the diversity of nonlinear regression models. Keep in mind that each function can fit a variety of shapes, and there are many nonlinear functions. Also, notice how nonlinear regression equations are not comprised of only addition and multiplication! In the table, thetas are the parameters, and Xs are the independent variables.
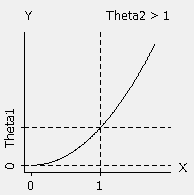
Power: ![]()
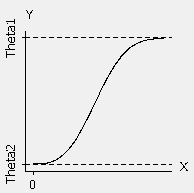
Weibull growth: ![]()
Fourier: ![]()
The nonlinear regression example below models the relationship between density and electron mobility.
The equation for the nonlinear regression analysis is too long for the fitted line plot:
Electron Mobility = (1288.14 + 1491.08 * Density Ln + 583.238 * Density Ln^2 + 75.4167 * Density Ln^3) / (1 + 0.966295 * Density Ln + 0.397973 * Density Ln^2 + 0.0497273 * Density Ln^3)
It’s important to note that R-squared is invalid for nonlinear models and statistical software can’t calculate p-values for the terms.
The defining characteristic for both types of models are the functional forms. If you can focus on the form that represents a linear model, it’s easy enough to remember that anything else must be a nonlinear.
参考:
http://statisticsbyjim.com/regression/difference-between-linear-nonlinear-regression-models/


 被折叠的 条评论
为什么被折叠?
被折叠的 条评论
为什么被折叠?
 到【灌水乐园】发言


