


随机游走是由一系列简单的随机决策产生的行走路径。
1、创建 RandomWalk 类
创建一个 RandomWalk 类,用来随机地选择前进的方向。这个类有三个属性:一个是跟踪随机游走次数的变量,另外两个是列表,分别存储随机游走经过的每个点的 x 坐标值和 y 坐标值。包含两个方法:__init__() 和 r_walk()。
from random import choice


class RandomWalk:
    def __init__(self, num_points=5000):
        """初始化"""
        self.num_points = num_points
        # 所有随机游走都始于(0, 0)
        self.x_values = [0]
        self.y_values = [0]

    def r_walk(self):
        """计算随机游走包含的所有点"""
        # 不断游走,直到列表达到指定的长度
        while len(self.x_values) < self.num_points:
            # 决定前进的方向以及沿这个方向前进的距离
            x_direction = choice([1, -1])
            x_distance = choice([0, 1, 2, 3, 4])
            x_step = x_direction * x_distance
            y_direction = choice([1, -1])
            y_distance = choice([0, 1, 2, 3, 4])
            y_step = y_direction * y_distance
            # 不能原地踏步
            if x_step == 0 and y_step == 0:
                continue
            # 计算下一个点的 x 坐标值和 y 坐标值
            x = self.x_values[-1] + x_step
            y = self.y_values[-1] + y_step
            self.x_values.append(x)
            self.y_values.append(y)
2、随机游走图
import matplotlib.pyplot as plt
from random_walk import RandomWalk


rw = RandomWalk()
rw.r_walk()
# 随机游走图
plt.style.use('classic')
fig, ax = plt.subplots()
ax.scatter(rw.x_values, rw.y_values, s=5)
# set_aspect() 指定两条轴上刻度的间距相等
ax.set_aspect('equal')
plt.show()
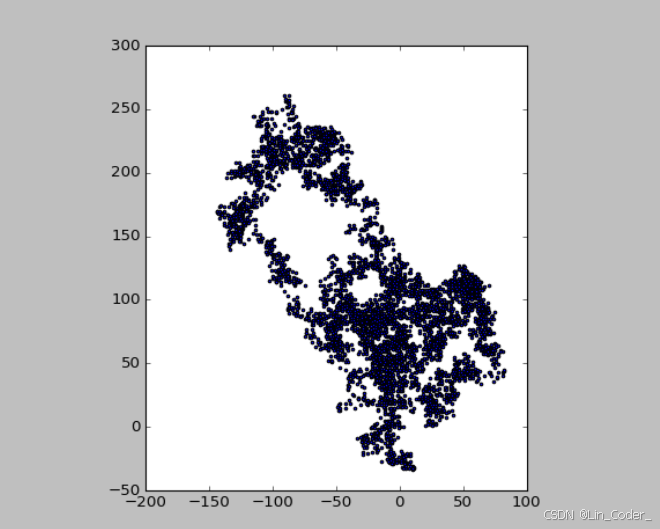
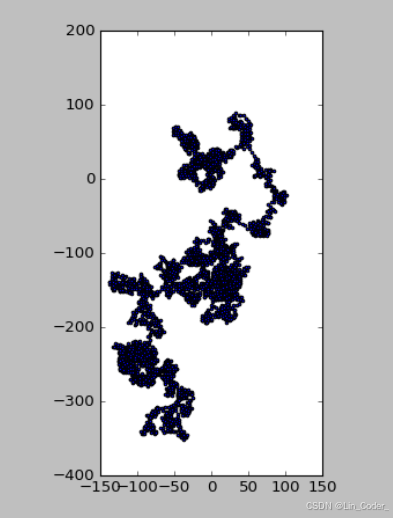
其中一次的输出结果图:因为随机性,所以每次的游走策略都不一样。
3、随机游走图的样式
①渐变:随着游走的加深,点的颜色也逐渐加深
import matplotlib.pyplot as plt
from random_walk import RandomWalk

while True:
    rw = RandomWalk()
    rw.r_walk()
    # 随机游走图
    plt.style.use('classic')
    fig, ax = plt.subplots()

    point_numbers = range(rw.num_points)
    ax.scatter(rw.x_values, rw.y_values, c=point_numbers, cmap=plt.cm.Blues, edgecolors='none', s=5)
    # set_aspect() 指定两条轴上刻度的间距相等
    ax.set_aspect('equal')
    plt.show()

    running = input("想再走一次吗? (y/n): ")
    if running == 'n':
        break
输出结果展示:从起点到终点,从浅色到深色
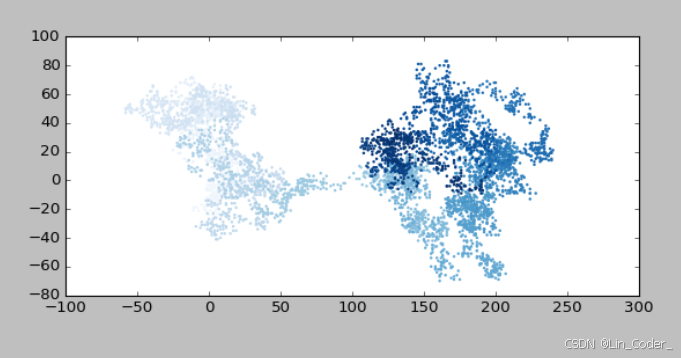
range() 生成一个数值列表,列表长度值等于游走包含的点的个数。然后,将这个列表赋给变量 point_numbers,以便后面使用它来设置每个游走点的颜色。将参数 c 设置为 point_numbers,指定使用颜色映射 Blues,并传递实参 edgecolors='none' 以删除每个点的边界轮廓。
②始终点:让起点和终点比其他点更大并显示为不同的颜色。重新绘制起点和终点
--省略--
ax.scatter(0, 0, c='green', edgecolors='none', s=30)
ax.scatter(rw.x_values[-1], rw.y_values[-1], c='red', edgecolors='none', s=30)

plt.show()
输出结果:

③进一步忽略坐标轴
# 隐藏坐标轴
ax.get_xaxis().set_visible(False)
ax.get_yaxis().set_visible(False)

plt.show()
④图形大小与分辨率
fig, ax = plt.subplots(figsize=(15, 9), dpi=128)

# 大小 分辨率
试试看吧!!!


 被折叠的 条评论
为什么被折叠?
被折叠的 条评论
为什么被折叠?
 到【灌水乐园】发言


