


在网上找一下绘制心电图,但大部分都是需要下载,这里我就直接发给大家,大家可以自取。
链接:https://pan.baidu.com/s/1eV12aRnoXraLpxPDbBCESA
提取码:ijil
上面打开的页面JS功能有点乱,而且还是压缩了的,很不方便查看。所以写了一个简洁版的供大家参考吧。
我就直接贴代码了
<!DOCTYPE html>
<html lang="en">
<head>
<meta charset="UTF-8">
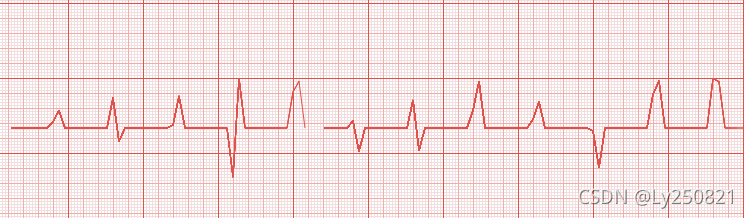
<title>Echarts实现心电图效果</title>
</head>
<style>
.box1 {
position: absolute;
left: 0px;
top: 50px;
width: 1000px;
height: 1300px;
}
.box2 {
position: absolute;
left: 0px;
top: 50px;
width: 1000px;
height: 1300px;
}
</style>
<body>
<div class="box1">
<canvas id="ecg" width="751px" height="751px"></canvas>
</div>
<div class="box2">
<canvas id="line" width="751px" height="751px"></canvas>
</div>
</body>
</html>
<script type="text/javascript">
function drawSmallGrid(canvas) {
var context = canvas.getContext("2d");
context.strokeStyle = "#f1dedf";
context.strokeWidth = 1;
context.beginPath();
for (var x = 0.5; x < 751; x += 3) {
context.moveTo(x, 0);
context.lineTo(x, 751);
context.stroke();
}
for (var y = 0.5; y < 751; y += 3) {
context.moveTo(0, y);
context.lineTo(751, y);
context.stroke();
}
context.closePath();
return;
}
function drawMediumGrid(canvas) {
var context = canvas.getContext("2d");
context.strokeStyle = "#f0adaa";
context.strokeWidth = 1;
context.beginPath();
for (var x = 0.5; x < 751; x += 15) {
context.moveTo(x, 0);
context.lineTo(x, 751);
context.stroke();
};
for (var y = 0.5; y < 751; y += 15) {
context.moveTo(0, y);
context.lineTo(751, y);
context.stroke();
};
context.closePath();
return;
}
function drawBigGrid(canvas) {
var context = canvas.getContext("2d");
context.strokeStyle = "#e0514b";
context.strokeWidth = 1;
context.beginPath();
for (var x = 0.5; x < 751; x += 75) {
context.moveTo(x, 0);
context.lineTo(x, 751);
context.stroke();
};
for (var y = 0.5; y < 751; y += 75) {
context.moveTo(0, y);
context.lineTo(751, y);
context.stroke();
};
context.closePath();
return;
}
function drawLine(canvas) {
var ctx = canvas.getContext('2d');
ctx.strokeStyle = "#e0514b";
ctx.strokeWidth = 1;
let x = 2
setInterval(() => {
ctx.clearRect(x * 6, 0, 25, 750);
x = x + 1
let num = (x % 10 === 0) || (x%10 ===1) ? (Math.random() * 10 - 5) *10 + 200 : 200
ctx.lineTo(x * 6, num )
ctx.stroke();
if (x > (750 / 6)) {
x = 2
ctx.beginPath();
}
}, 60);
ctx.stroke();
ctx.closePath();
}
(function() {
var canvas = document.getElementById("ecg");
var canvas2 = document.getElementById("line")
drawSmallGrid(canvas);
drawMediumGrid(canvas);
drawBigGrid(canvas);
drawLine(canvas2);
return;
})();
</script>
</script>


 9562
9562


 被折叠的 条评论
为什么被折叠?
被折叠的 条评论
为什么被折叠?
 到【灌水乐园】发言


