import cv2
import matplotlib.pyplot as plt
import matplotlib
import numpy as np
img=cv2.imread('VOCdevkit/VOC2007/JPEGImages/1001.jpg')
fig,ax1= plt.subplots(1, 1)
ax1.get_yaxis().set_major_formatter(matplotlib.ticker.FuncFormatter(lambda x, p: format(int(x), ',')))
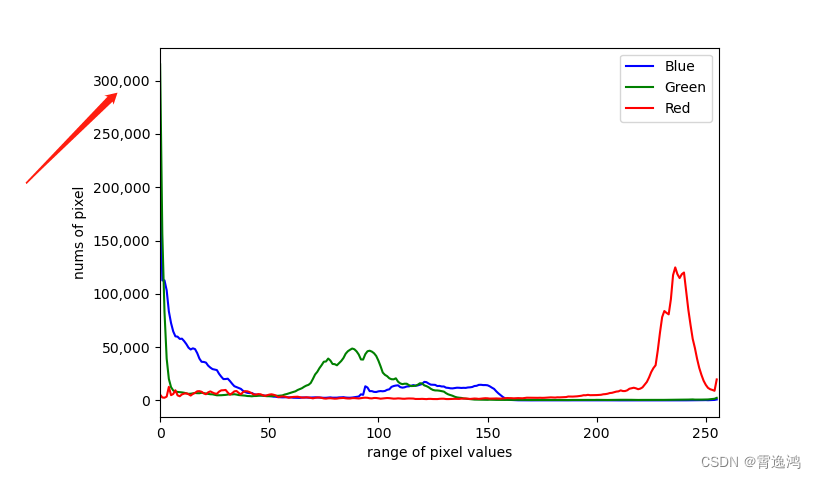
color=('b','g','r')
for i,col in enumerate(color):
hist=cv2.calcHist([img],[i],None,[256],[0,256])
plt.plot(hist,color=col)
plt.xlim([0,256])
ax1.set_xlabel("range of pixel values")
ax1.set_ylabel("nums of pixel")
ax1.legend(["Blue","Green","Red"],loc="upper right")
plt.savefig(r'numberOfpixels.png')
plt.show()
print("finish!")


 818
818


 被折叠的 条评论
为什么被折叠?
被折叠的 条评论
为什么被折叠?
 到【灌水乐园】发言


