


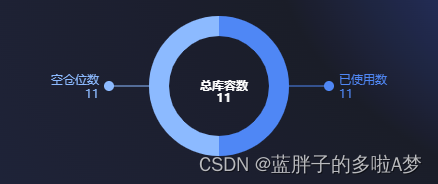
需求

重点代码
完整代码
initChart() {
// 创建 echarts 实例。
var myChartOne = this.$echarts.init(this.$refs.Echart);
myChartOne.setOption({
tooltip: {
trigger: "item",
},
title: {
top: 'center',
text: [
'{name|' + this.chartTitle.name + '}',
'{value|' + this.chartTitle.value + '}',
].join('\n'),
left: '50%',
top: '45%',
textAlign: 'center',
textStyle: {
rich: {
name: {
color: '#ffff',
fontSize: 12,
fontWeight: '700',
paddingBottom: 5,
},
value: {
color: '#ffff',
fontSize: 12,
fontWeight: '700',
},
},
},
},
color: this.colorArr,//自定义环形图颜色
series: [
{
name: '',
type: 'pie',
radius: ['50%', '70%'],
center: ['50%', '50%'],
data: this.chartData,
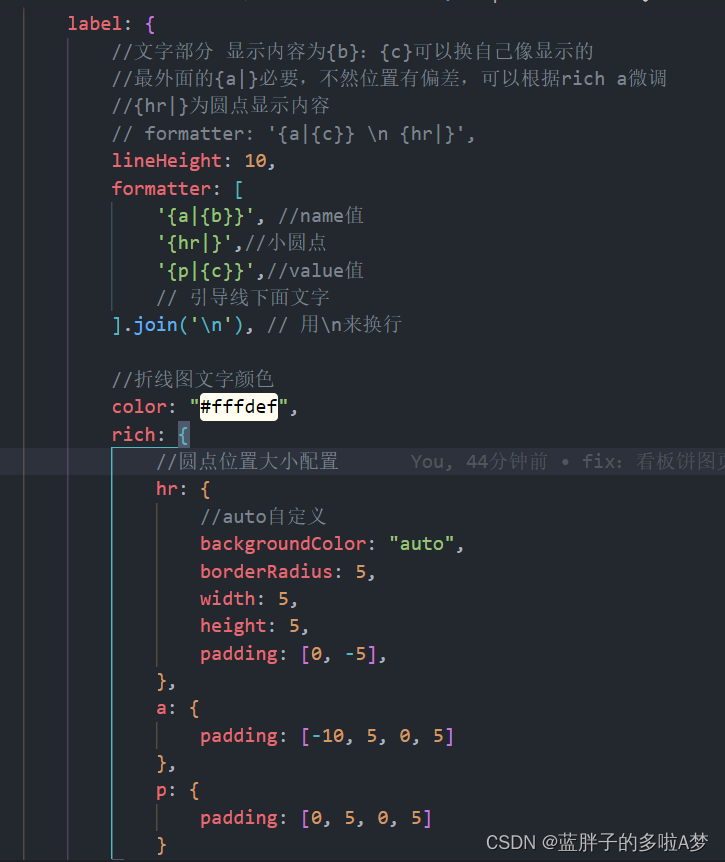
label: {
//文字部分 显示内容为{b}:{c}可以换自己像显示的
//最外面的{a|}必要,不然位置有偏差,可以根据rich a微调
//{hr|}为圆点显示内容
// formatter: '{a|{c}} \n {hr|}',
lineHeight: 10,
formatter: [
'{a|{b}}', //name值
'{hr|}',//小圆点
'{p|{c}}',//value值
// 引导线下面文字
].join('\n'), // 用\n来换行
//折线图文字颜色
color: "#fffdef",
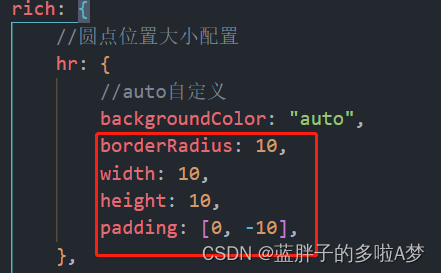
rich: {
//圆点位置大小配置
hr: {
//auto自定义
backgroundColor: "auto",
borderRadius: 5,
width: 5,
height: 5,
padding: [0, -5],
},
a: {
padding: [-10, 5, 0, 5]
},
p: {
padding: [0, 5, 0, 5]
}
}
},
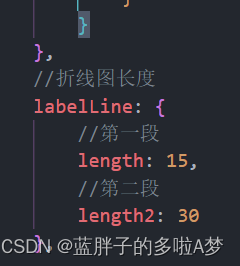
//折线图长度
labelLine: {
//第一段
length: 15,
//第二段
length2: 30
},
}
]
});
},
需求2

完整代码
initChart() {
            // 创建 echarts 实例。
            var myChartOne = this.$echarts.init(this.$refs.Echart);
            myChartOne.setOption({
                tooltip: {
                    trigger: "item",
                },
                title: {
                    top: 'center',
                    text: [
                        '{name|' + this.chartTitle.name + '}',
                        '{value|' + this.chartTitle.value + '}',
                    ].join('\n'),

                    left: '50%',
                    top: '45%',
                    textAlign: 'center',
                    textStyle: {
                        rich: {
                            name: {
                                color: '#ffff',
                                fontSize: 12,
                                fontWeight: '700',
                                paddingBottom: 5,
                            },
                            value: {
                                color: '#ffff',
                                fontSize: 12,
                                fontWeight: '700',
                            },
                        },
                    },
                },
                color: this.colorArr,//自定义环形图颜色
                series: [
                    {
                        name: '',
                        type: 'pie',
                        radius: ['50%', '70%'],
                        center: ['50%', '50%'],
                        data: this.chartData,
                        label: {
                            //文字部分 显示内容为{b}:{c}可以换自己像显示的
                            //最外面的{a|}必要,不然位置有偏差,可以根据rich a微调
                            //{hr|}为圆点显示内容
                            formatter: '{a|{b}:{c}}\n{hr|}',
                            //折线图文字颜色
                            color: "#fffdef",
                            rich: {
                                //圆点位置大小配置
                                hr: {
                                    //auto自定义
                                    backgroundColor: "auto",
                                    borderRadius: 3,
                                    width: 3,
                                    height: 3,
                                    padding: [3, 3, 0, -12]
                                },
                                a: {
                                    padding: [-10, 5, 0, 5]
                                },
                            }
                        },
                        //折线图长度
                        labelLine: {
                            //第一段
                            length: 15,
                            //第二段
                            length2: 25
                        },
                    }
                 ]
            });
        },
tips
圆点大小可以通过一下四个属性来修改


 2286
2286


 被折叠的 条评论
为什么被折叠?
被折叠的 条评论
为什么被折叠?
 到【灌水乐园】发言


