


什么是Data-Join?
本质上是将数据与图元绑定
可以省去大量根据数据设置图元属性的代码量,对动态变化的数据提供统一接口
D3.js绑定数据的三个状态
Enter
数据数量>图元数量,d3.js会根据新增的数据生成相应的图元
给不存在数据绑定的图元提供占位符
const p = maingroup.selectAll('.class').data(data).enter().append('').attr(...)
//data(data) 数据绑定
Update
图元数量与数据数量一致
const p = maingroup.selectAll('.class').data(data).append('').attr(...)在update状态时可以配合transition().duration(time)实现动画的过渡效果
Exit
数据数量<图元数量,d3.js会自动删除没有绑定数据的图元
const p = maingroup.selectAll('.class').data(data).exit().remove()读取CSV
d3.csv('./data.csv').then(data => {})
//返回值是一个Promise对象,JS中的异步编程
//不能用等号接受它的返回值如果d3.csv读取的是主机本地的路径,那么会报跨域错误
案例
运行这次代码的时候的报错:Uncaught TypeError TypeError: Failed to fetch
按照这个文章里的第一个方法解决:(80条消息) d3.csv()读取本地文件失败_报错Access to XMLHttpRequest at ‘file:‘ from origin ‘null‘ has been blocked_替换和解决方法_Jude_zhai的博客-CSDN博客
<!DOCTYPE html>
<html>
<head>
<meta charset="UTF-8">
<meta http-equiv="X-UA-Compatible" content="IE=edge">
<meta name="viewport" content="width=device-width, initial-scale=1.0">
<title>Scatter-Simple</title>
</head>
<body style="text-align: center">
<svg width="1650" height="920" id="mainsvg" class="svgs" style="background-color: #ffffff;"></svg>
<script src="https://d3js.org/d3.v7.min.js"></script>
<script src="d3.min.js"></script>
<script>
const svg = d3.select('#mainsvg');
const width = +svg.attr('width');
const height = +svg.attr('height');
const margin = {top: 100, right: 120, bottom: 100, left: 120};
const innerWidth = width - margin.left - margin.right;
const innerHeight = height - margin.top - margin.bottom;
let xScale, yScale;
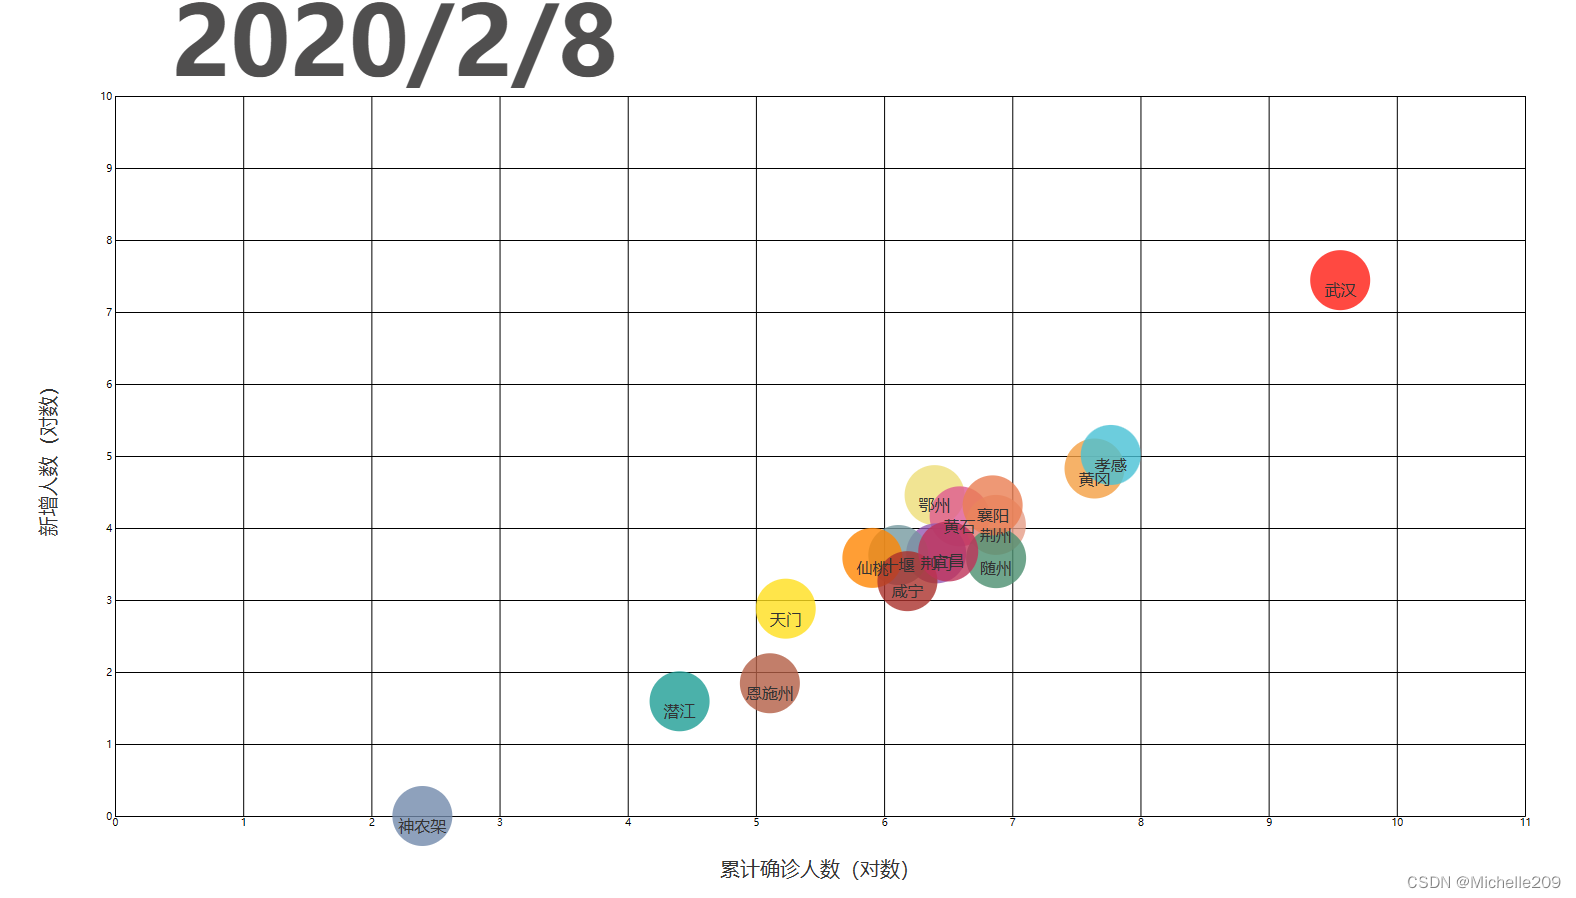
const xAxisLabel = '累计确诊人数(对数)';
const yAxisLabel = '新增人数(对数)';
let alldates;
let sequantial;
let aduration = 1000;
let xValue = d => Math.log(d['确诊人数'] + 1);
let yValue = d => Math.log(d['新增确诊'] + 1);
var color = {
"武汉":"#ff1c12",
"黄石": "#de5991",
"十堰": "#759AA0",
"荆州": "#E69D87",
"宜昌": "#be3259",
"襄阳": "#EA7E53",
"鄂州": "#EEDD78",
"荆门": "#9359b1",
"孝感": "#47c0d4",
"黄冈": "#F49F42",
"咸宁": "#AA312C",
"恩施州": "#B35E45",
"随州": "#4B8E6F",
"仙桃": "#ff8603",
"天门": "#ffde1d",
"潜江": "#1e9d95",
"神农架": "#7289AB"
}
const renderinit = function(data){
// Linear Scale: Data Space -> Screen Space;
xScale = d3.scaleLinear()
.domain([d3.min(data, xValue), d3.max(data, xValue)])
.range([0, innerWidth])
.nice();
// Introducing y-Scale;
yScale = d3.scaleLinear()
// d3.extent()计算数组的最小值和最大值 返回的是数组 纵轴起始点原本是左上角 需要reverse一下
.domain(d3.extent(data, yValue).reverse())
.range([0, innerHeight])
.nice(); //将定义域的刻度扩展整齐
// 可作图区域的容器
const g = svg.append('g')
.attr('transform', `translate(${margin.left}, ${margin.top})`)
.attr('id', 'maingroup');
// Adding axes;
const yAxis = d3.axisLeft(yScale)
.tickSize(-innerWidth) //设置刻度线长度
//.tickPadding(10); // .tickPadding is used to prevend intersection of ticks;
const xAxis = d3.axisBottom(xScale)
.tickSize(-innerHeight)
//.tickPadding(10);
let yAxisGroup = g.append('g').call(yAxis)
.attr('id', 'yaxis');
yAxisGroup.append('text')
.attr('font-size', '2em')
.attr('transform', `rotate(-90)`)
.attr('x', -innerHeight / 2)
.attr('y', -60)
.attr('fill', '#333333')
.text(yAxisLabel)
.attr('text-anchor', 'middle') // Make label at the middle of axis.
//yAxisGroup.selectAll('.domain').remove(); // we can select multiple tags using comma to seperate them and we can use space to signify nesting;
let xAxisGroup = g.append('g').call(xAxis)
.attr('transform', `translate(${0}, ${innerHeight})`)
.attr('id', 'xaxis');
xAxisGroup.append('text')
.attr('font-size', '2em')
.attr('y', 60)
.attr('x', innerWidth / 2)
.attr('fill', '#333333')
.text(xAxisLabel);
//xAxisGroup.selectAll('.domain').remove();
};
const renderUpdate = function(seq){
const g = d3.select('#maingroup');
let circleupdates = g.selectAll('circle').data(seq, d => d['地区']);
let circleenter = circleupdates.enter().append('circle')
.attr('cx', d => xScale(xValue(d))) //横坐标
.attr('cy', d => yScale(yValue(d))) //纵坐标
.attr('r', 30) //半径
.attr('fill', d => color[d['地区']]) //颜色
.attr('opacity', 0.8)
circleupdates.merge(circleenter)
.transition().ease(d3.easeLinear).duration(aduration)
.attr('cx', d => xScale(xValue(d)))
.attr('cy', d => yScale(yValue(d)));
//日期修改
time = seq[0]['日期'];
g.selectAll('.date_text').remove();
g.append("text")
.data(['seq'])
.attr('class', 'date_text')
.attr("x", innerWidth / 4 + 150)
.attr("y", - 20)
.style("text-anchor", "end")
.attr("fill", "#504f4f")
.attr('font-size', '6em')
.attr('font-weight', 'bold')
.text(time);
textupdates = g.selectAll('.province_text').data(seq);
textenter = textupdates.enter().append('text')
.attr("class", "province_text")
.attr("x", (datum) => { return xScale(xValue(datum)); })
.attr("y", (datum) => { return yScale(yValue(datum)); })
.attr("dy", "1em")
.style("text-anchor", "middle")
.attr("fill", "#333333")
//.attr('opacity', 0)
.text(function(d,i){
return d['地区']
})
textupdates.merge(textenter).transition().ease(d3.easeLinear).duration(aduration)
.attr('x', (datum) => {
return xScale(xValue(datum)); })
.attr('y', (datum) => { return yScale(yValue(datum)); });
}
/*--------------------------------------------数据处理--------------------------------------------------*/
d3.csv("hubeinxt.csv").then( data => {
//数据过滤
data = data.filter( d => d['地区'] !== '总计' );
data.forEach( d => {
//将目标数据转换成数值
d['确诊人数'] = +(d['确诊人数']);
d['新增确诊'] = +(d['新增确诊']);
//异常数据处理
if( d['新增确诊'] < 0 ){
d['新增确诊'] = 0;
}
} )
//set去掉重复日期
alldates = Array.from( new Set(data.map( d => d['日期']) ));
//日期的排序 从早到晚排序
alldates = alldates.sort( (a,b) => {
return new Date(a) - new Date(b);
} );
//构造每一天数据的二维数组
sequantial = [];
alldates.forEach( d => {
sequantial.push([])
} );
data.forEach( d => {
//根据alldates中日期的索引,将data中日期相同的数据放在sequantial同一个数组
sequantial[ alldates.indexOf(d['日期'])].push(d);
} );
renderinit(data);
let c = 0;
let intervalId = setInterval( () => {
if( c >= alldates.length ){
clearInterval(intervalId);
}else{
renderUpdate(sequantial[c]);
c = c + 1;
}
}, aduration)
console.log(sequantial);
} )
</script>
</body>
</html>


 7926
7926


 被折叠的 条评论
为什么被折叠?
被折叠的 条评论
为什么被折叠?
 到【灌水乐园】发言


