127.在 Vue3 中使用 OpenLayers 实现绘制矩形 —— 利用 createBox 来处理

📌 作者:小彭努力中
📅 时间:2025-05-14
💻 技术栈:Vue3 + OpenLayers + Element Plus + TailwindCSS(可选)


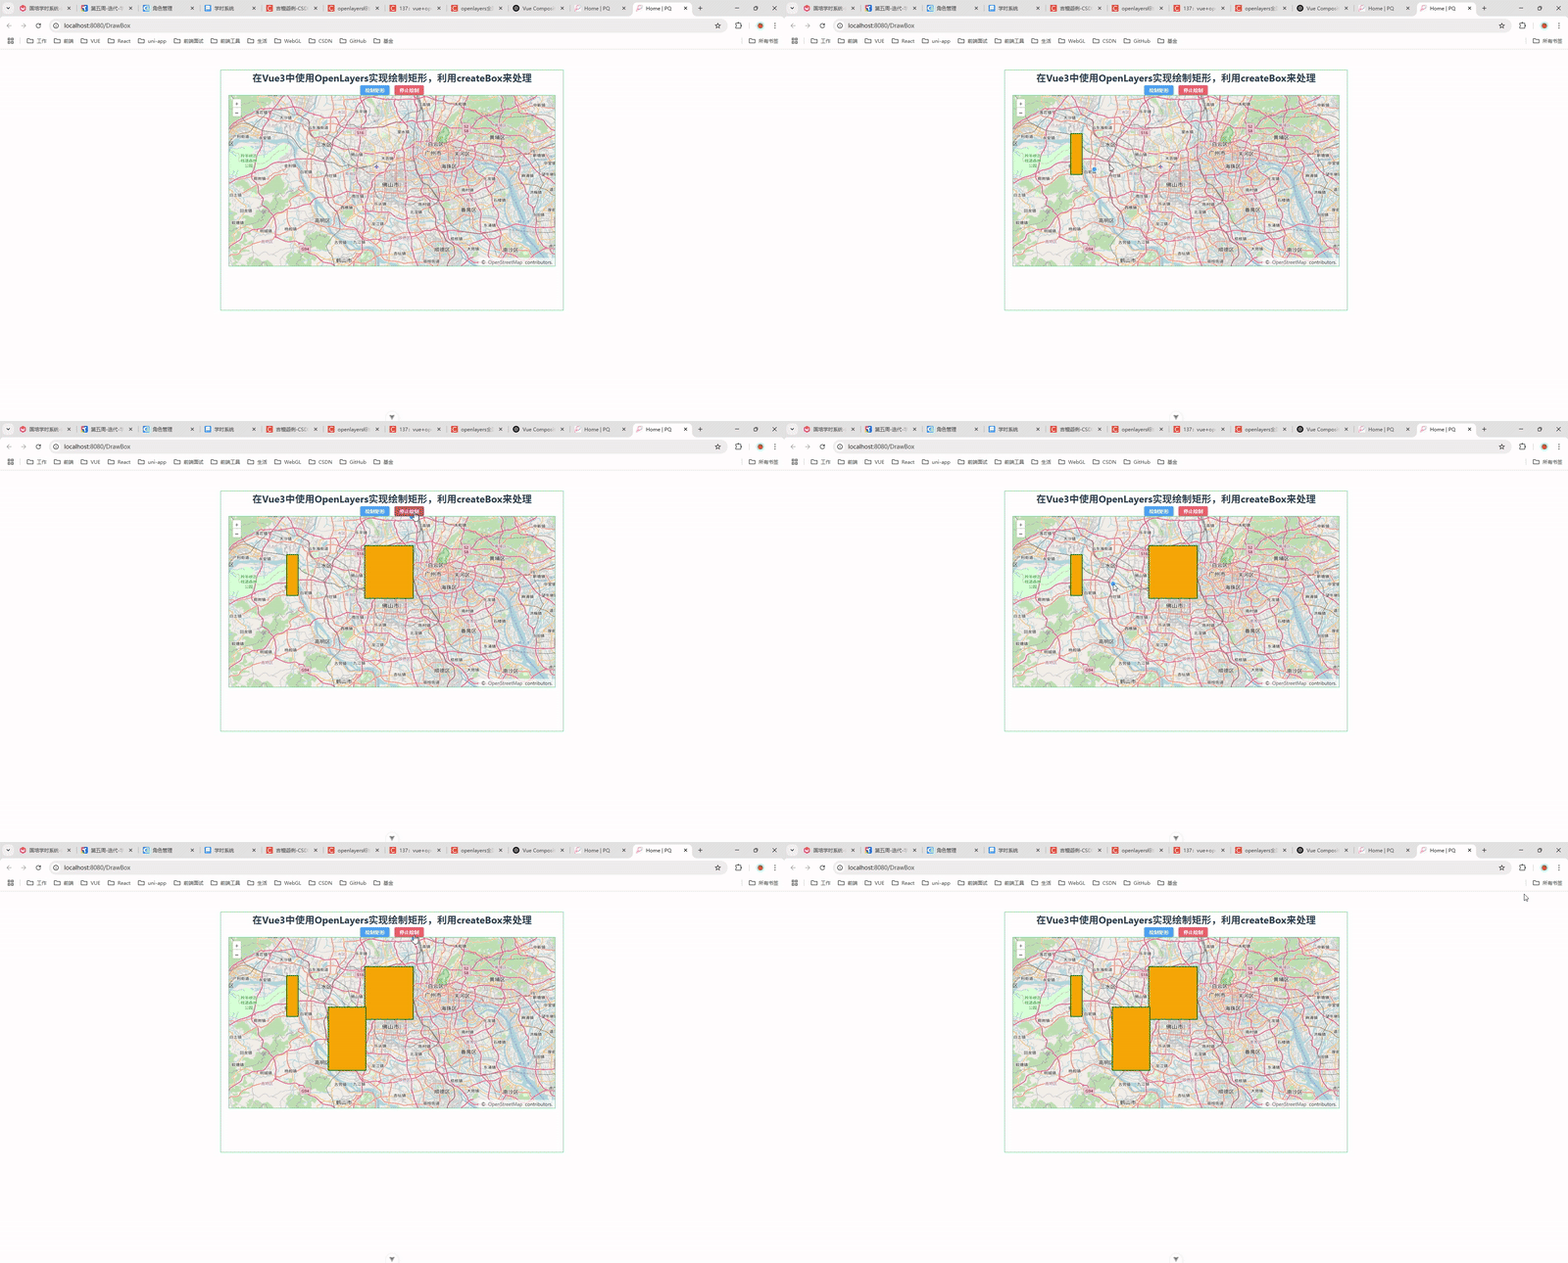
🎬 运行效果展示(先看效果)

点击“绘制矩形”按钮,鼠标拖动即可画出矩形:

✨ 前言

在 WebGIS 项目开发中,图形绘制是非常常见的功能,比如绘制点、线、面、圆等。OpenLayers 作为功能强大的开源地图框架,提供了丰富的交互组件,其中就包括通过 Draw 组件绘制各种图形。

本文将介绍如何在 Vue3 中通过 Composition API 结合 OpenLayers 的 createBox 工具函数,实现矩形绘制功能,整个过程简洁高效,适合在各种 Web 地图项目中直接使用或扩展。


🧠 技术点解析

    你可以使用Vue.jsOpenLayers库来实现绘制折线并计算折线距离。下面是一个基本的实现示例: 首先,确保你已经安装了Vue.jsOpenLayers依赖: ```bash npm install vue openlayers ``` 然后,在你的Vue组件中,引入OpenLayers和样式表: ```javascript import &#39;ol/ol.css&#39;; import { Map, View } from &#39;ol&#39;; import { Tile as TileLayer, Vector as VectorLayer } from &#39;ol/layer&#39;; import { OSM, Vector as VectorSource } from &#39;ol/source&#39;; import { Draw, Modify } from &#39;ol/interaction&#39;; import { createBox } from &#39;ol/interaction/Draw&#39;; export default { mounted() { // 创建地图 const map = new Map({ target: &#39;map&#39;, layers: [ new TileLayer({ source: new OSM() }) ], view: new View({ center: [0, 0], zoom: 2 }) }); // 创建绘制交互 const source = new VectorSource(); const vector = new VectorLayer({ source: source }); map.addLayer(vector); const draw = new Draw({ source: source, type: &#39;LineString&#39; }); map.addInteraction(draw); // 创建修改交互 const modify = new Modify({ source: source }); map.addInteraction(modify); // 计算折线距离 draw.on(&#39;drawend&#39;, (event) => { const feature = event.feature; const geometry = feature.getGeometry(); const coordinates = geometry.getCoordinates(); let distance = 0; for (let i = 1; i < coordinates.length; i++) { const coord1 = coordinates[i]; const coord2 = coordinates[i - 1]; distance += getDistance(coord1, coord2); } console.log(&#39;折线距离:&#39;, distance); }); // 计算两点之间的距离 function getDistance(coord1, coord2) { const dx = coord2[0] - coord1[0]; const dy = coord2[1] - coord1[1]; return Math.sqrt(dx * dx + dy * dy); } } } ``` 在上面的代码中,我们创建了一个地图实例,并添加了一个基本的OSM图层。然后,我们创建了一个矢量图层和一个绘制交互,允许用户绘制线段。在绘制结束时,我们计算折线的距离,并输出到控制台。 注意,我们使用了`ol/ol.css`样式表来确保地图正确显示。你可以根据自己的需求进行样式调整。 最后,在你的Vue模板中,添加一个具有指定ID的容器元素: ```html <template> <div> <div id="map"></div> </div> </template> ``` 这样,当你在浏览器中运行该Vue组件时,你将能够在地图上绘制折线,并计算折线的距离。 希望对你有所帮助!
    评论
    添加红包

    请填写红包祝福语或标题

    红包个数最小为10个

    红包金额最低5元

    当前余额3.43前往充值 >
    需支付:10.00
    成就一亿技术人!
    领取后你会自动成为博主和红包主的粉丝 规则
    hope_wisdom
    发出的红包

    打赏作者

    吉檀迦俐

    你的鼓励奖是我创作的最大动力

    ¥1 ¥2 ¥4 ¥6 ¥10 ¥20
    扫码支付:¥1
    获取中
    扫码支付

    您的余额不足,请更换扫码支付或充值

    打赏作者

    实付
    使用余额支付
    点击重新获取
    扫码支付
    钱包余额 0

    抵扣说明:

    1.余额是钱包充值的虚拟货币,按照1:1的比例进行支付金额的抵扣。
    2.余额无法直接购买下载,可以购买VIP、付费专栏及课程。

    余额充值