


vue echarts 漏斗
最近有一个需求漏斗统计,采用的echarts来实现
需要实现如下效果
最初版本

旁边有描述,里面要有值;
第一步 首先在项目里安装echarts;
npm install echarts --save
第二步 在 main.js 里面引入echarts(可以按需引入,这里就不做按需引入);
import * as echarts from 'echarts';
Vue.prototype.$echarts = echarts;
第三部 在相关页面中使用echarts;
<template>
  <div class='wrap'>
  	<div ref="myechart" style="width: 500px; height: 800px"></div>
  </div>
</template>

//script
mounted() {//挂载后初始化echarts
    this.echartsInit();
},
methods:{
	echartsInit(){
	let that = this
      var myChart = that.$echarts.init(that.$refs.myechart);
      var option = {
        //  title: {
        //    text: 'Funnel'
        //  },
        tooltip: {
          trigger: 'item',
          formatter: '{a} <br/>{b} : {c}%'
        },
        // toolbox: {
        //   feature: {
        //     dataView: {
        //       readOnly: false
        //     },
        //     restore: {},
        //     saveAsImage: {}
        //   }
        // },
        // legend: {
        //   data: ['Show', 'Click', 'Visit', 'Inquiry', 'Order']
        // },
        series: [{
          name: 'Funnel',
          type: 'funnel',
          left: '10%',
          top: 60,
          bottom: 60,
          width: '80%',
          min: 0,
          max: 100,
          minSize: '0%',
          maxSize: '100%',
          sort: 'descending',
          gap: 2,
          label: {
            show: true,
            position: 'left',
            fontSize:18
          },
          labelLine: {
            length: 10,
            lineStyle: {
              width: 1,
              type: 'solid'
            }
          },
          itemStyle: {
            borderColor: '#fff',
            borderWidth: 1
          },
          emphasis: {
            label: {
              fontSize: 20
            }
          },
          data: [{
              value: 60,
              name: 'Visit'
            },
            {
              value: 40,
              name: 'Inquiry'
            },
            {
              value: 20,
              name: 'Order'
            },
            {
              value: 80,
              name: 'Click'
            },
            {
              value: 100,
              name: 'Show'
            }
          ]
        },
        {
          name: 'Funnel',
          type: 'funnel',
          left: '10%',
          top: 60,
          bottom: 60,
          width: '80%',
          min: 0,
          max: 100,
          minSize: '0%',
          maxSize: '100%',
          sort: 'descending',
          gap: 2,
          label: {
            show: true,
            position: 'inside',
            formatter:'{c}%',
            color:'#fff'
          },
          labelLine: {
            length: 10,
            lineStyle: {
              width: 1,
              type: 'solid'
            }
          },
          itemStyle: {
            borderColor: '#fff',
            borderWidth: 1
          },
          emphasis: {
            label: {
              fontSize: 20
            }
          },
          data: [{
              value: 60,
              name: 'Visit'
            },
            {
              value: 40,
              name: 'Inquiry'
            },
            {
              value: 20,
              name: 'Order'
            },
            {
              value: 80,
              name: 'Click'
            },
            {
              value: 100,
              name: 'Show'
            }
          ],
          z: 100
        }]
      }
      myChart.setOption(option);
	}
}
实现这个功能实际上是 套了两层数据,如果有更好的方法,可以留言
又是漏斗,昨天实现完这个功能后发现了一个问题,如果数值小的情况下,或者相等;漏斗图就会改变,
变成奇奇怪怪具体看下图

所以优化了一下这个漏斗图;不随值的改变去改变他的形状;
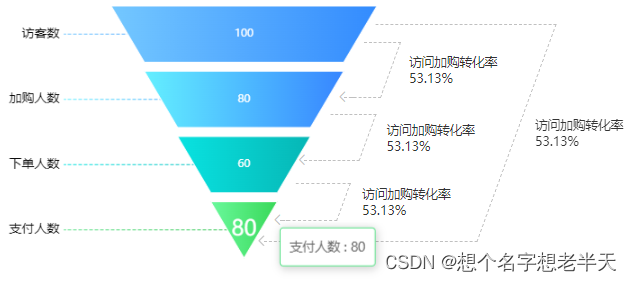
最后的效果图如下:

具体看代码
在上面的代码基础上;
option里面需要修改tooltip //提示框
tooltip: {
          trigger: 'item',
          formatter(e){
            return `${e.name} : ${e.data.values}`//将他动态设置 name就是名字 values是我给他新添加的真实数据
          }
        },
data里面需要新增一个字段 //values
data: [{
              value: 80,
              name: '访客数',
              values:100
            },
            {
              value: 60,
              name: '加购人数',
              values:80
            },
            {
              value: 40,
              name: '下单人数',
              values:60
            },
            {
              value: 20,
              name: '支付人数',
              values:80
            },
          ],
// 弹窗 和 真实字段都有了 现在金字塔内也需要显示这个真实数据
label: {
            show: true,
            position: 'inside',
            formatter(e){
              return `${e.data.values}`
            },
            color:'#fff',
            size:22,
            textBorderColor:'#fff'
          },
这样就大功告成了!
最终完整代码
<template>
	<div class='headerBox'>
      <div class='title'>交易漏斗模型</div>
      <div class='flexstart' style="position:relative;width:1200px; height: 400px">
        <div ref="myechart" style="position:relative;width: 1200px; height: 400px;z-index:2"></div>
        <div class='conversionBoxAsk flexstart coversionBox'>
          <div class='lineBox'>
            <i style='color:#c0c0c0;' class='el-icon-arrow-left icons'></i>
            <div class='lines'></div>
            <div class='line'></div>
          </div>
          <div>
            <div class='titles'>访问加购转化率</div>
            <div class='nums'>53.13%</div>
          </div>
        </div>
        <div class='conversionBoxAdd flexstart coversionBox'>
          <div class='lineBox'>
            <i style='color:#c0c0c0;' class='el-icon-arrow-left icons'></i>
            <div class='lines'></div>
            <div class='line'></div>
          </div>
          <div>
            <div class='titles'>访问加购转化率</div>
            <div class='nums'>53.13%</div>
          </div>
        </div>
        <div class='conversionBoxBuy flexstart coversionBox'>
          <div class='lineBox'>
            <i style='color:#c0c0c0;' class='el-icon-arrow-left icons'></i>
            <div class='lines'></div>
            <div class='line'></div>
          </div>
          <div>
            <div class='titles'>访问加购转化率</div>
            <div class='nums'>53.13%</div>
          </div>
        </div>
        <div class='conversionBoxOut flexstart coversionBox'>
          <div class='lineBox'>
            <i style='color:#c0c0c0;' class='el-icon-arrow-left icons'></i>
            <div class='lines'></div>
            <div class='line'></div>
          </div>
          <div>
            <div class='titles'>访问加购转化率</div>
            <div class='nums'>53.13%</div>
          </div>
        </div>
      </div>
    </div>
</template>

<script>
	export default {
  		data() {
    		return {}
    	},
    	mounted() {
    		this.echartsInit();
  		},
  		methods: {
  			echartsInit() {
      let that = this
      var myChart = that.$echarts.init(that.$refs.myechart);
      var option = {
        tooltip: {
          trigger: 'item',
          formatter(e){
            return `${e.name} : ${e.data.values}`
          }
        },
        color: [
           new that.$echarts.graphic.LinearGradient(0, 0, 1, 0, [{
              offset: 0,
              color: '#64F0FF'
            },
            {
              offset: 1,
              color: '#3785FF'
            }
          ]),
          new that.$echarts.graphic.LinearGradient(0, 0, 1, 0, [{
              offset: 0,
              color: '#74C8FF'
            },
            {
              offset: 1,
              color: '#338BFE'
            }
          ]),
          new that.$echarts.graphic.LinearGradient(0, 0, 1, 0, [{
              offset: 0,
              color: '#09E3E1'
            },
            {
              offset: 1,
              color: '#06B6B5'
            }
          ]),
          new that.$echarts.graphic.LinearGradient(0, 0, 1, 0, [{
              offset: 0,
              color: '#61E38E'
            },
            {
              offset: 1,
              color: '#33C550'
            }
          ]),

        ],
        series: [{
          name: 'Funnel',
          type: 'funnel',
          left: '10%',
          top: 60,
          bottom: 60,
          width: '41%',
          min: 0,
          max: 100,
          minSize: '0%',
          maxSize: '0%',
          sort: 'descending',
          gap: 10,
          label: {
            show: true,
            position: 'left',
            fontSize:14
          },
          labelLine: {
            length: 250,
            lineStyle: {
              width: 1,
              type: 'dashed'
            },
          },
          itemStyle: {
            borderColor: '#fff',
            borderWidth: 1
          },
          emphasis: {
            label: {
              fontSize: 24
            }
          },
          data: [{
              value: 80,
              name: '访客数',
              values:100
            },
            {
              value: 60,
              name: '加购人数',
              values:80
            },
            {
              value: 40,
              name: '下单人数',
              values:60
            },
            {
              value: 20,
              name: '支付人数',
              values:80000000
            },
          ]
        },
        {
          name: 'Funnel',
          type: 'funnel',
          left: '10%',
          top: 60,
          bottom: 60,
          width: '41%',
          min: 0,
          max: 100,
          minSize: '0%',
          maxSize: '100%',
          sort: 'descending',
          gap: 10,
          label: {
            show: false
          },
          itemStyle: {
            borderColor: '#fff',
            borderWidth: 1
          },
          emphasis: {
            label: {
              fontSize: 24
            }
          },
          data: [{
              value: 80,
              name: '访客数',
              values:100
            },
            {
              value: 60,
              name: '加购人数',
              values:80
            },
            {
              value: 40,
              name: '下单人数',
              values:60
            },
            {
              value: 20,
              name: '支付人数',
              values:40
            },
          ]
        },
        {
          name: 'Funnel',
          type: 'funnel',
          left: '10%',
          top: 60,
          bottom: 60,
          width: '41%',
          min: 0,
          max: 100,
          minSize: '0%',
          maxSize: '100%',
          sort: 'descending',
          gap: 10,
          label: {
            show: true,
            position: 'inside',
            formatter(e){
              return `${e.data.values}`
            },
            color:'#fff',
            size:22,
            textBorderColor:'#fff'
          },
          labelLine: {
            length: 10,
            lineStyle: {
              width: 1,
              type: 'solid'
            }
          },
          itemStyle: {
            borderColor: '#fff',
            borderWidth: 1
          },
          emphasis: {
            label: {
              fontSize: 24,
              color:'#000'
            }
          },
          data: [{
              value: 80,
              name: '访客数',
              values:100
            },
            {
              value: 60,
              name: '加购人数',
              values:80
            },
            {
              value: 40,
              name: '下单人数',
              values:60
            },
            {
              value: 20,
              name: '支付人数',
              values:80000000
            },
          ],
          z: 100
        }]
      }
     			 myChart.setOption(option);
      			this.series = option.series[0]
    		},
		}
    }
</script>

<style lang="less"scoped>
	.flexstart{
		display: flex;
 	 	justify-content: flex-start;
  		align-items: center;
	}
	.headerBox {
  min-width: 1200px;
  padding: 20px 24px;
  margin-bottom: 16px;
  background: #fff;

  .title{
    color: #2E3458;
    font-size: 15px;
    padding-bottom: 10px;
    border-bottom: 1px solid #F0F0F0;
    margin-bottom: 20px;
  }

  .fgLine{
    width: 1px;
    height: 42px;
    background: #D8D8D8;
    margin-right: 50px;
  }

  .dataBox {
    min-width: 180px;
    margin-right:40px;
    .titlt{
      color:#A7A7A7;
      font-size: 14px;
    }
    .line {
      width: 1px;
      height: 24px;
      border-left: 2px solid #1064FF;
      margin-right: 5px;
    }
    .newBox {
      color: #333333;
      font-size: 26px;
      font-weight: bold;
    }
    .remark{
      color: #7d7d7d;
      font-size: 14px;
    }
    .rateBox{
      padding: 5px;
      margin-left: 7px;
      background: #F7F8FA;
      img{
        width: 8px;
        height: 14px;
        margin-left: 5px;
      }
    }
  }

  .conversionBoxAsk{
    position: absolute;
    left: 42%;
    top: 25%;
    .lineBox{
      position: relative;
      display: flex;
      justify-content: flex-start;
      align-items: flex-end;
      margin-right: 20px;

      .lines{
        width: 15px;
        height: 2px;
        border-bottom: 1px dashed #c0c0c0;
        margin-left: 5px;
      }

      .line{
        width: 30px;
        height: 60px;
        border: 1px dashed #c0c0c0;
        transform: skew(-20deg);
        border-left: 0;
      }

      .icons{
        position: absolute;
        bottom: -7px;
        left: -10px;
      }
    }
  }

  .conversionBoxAdd{
    position: absolute;
    left: 38%;
    top: 45%;
    .lineBox{
      position: relative;
      display: flex;
      justify-content: flex-start;
      align-items: flex-end;
      margin-right: 20px;

      .lines{
        width: 20px;
        height: 2px;
        border-bottom: 1px dashed #c0c0c0;
      }

      .line{
        width: 50px;
        height: 50px;
        border: 1px dashed #c0c0c0;
        transform: skew(-20deg);
        border-left: 0;
      }

      .icons{
        position: absolute;
        bottom: -7px;
        left: -10px;
      }
    }
  }

  .conversionBoxBuy{
    position: absolute;
    left: 35%;
    top: 64%;
    .lineBox{
      position: relative;
      display: flex;
      justify-content: flex-start;
      align-items: flex-end;
      margin-right: 20px;

      .lines{
        width: 10px;
        height: 2px;
        border-bottom: 1px dashed #c0c0c0;
      }

      .line{
        width: 70px;
        height: 40px;
        border: 1px dashed #c0c0c0;
        transform: skew(-20deg);
        border-left: 0;
      }

      .icons{
        position: absolute;
        bottom: -7px;
        left: -10px;
      }
    }
  }

  .conversionBoxOut{
    position: absolute;
    left: 33%;
    top: 20%;
    .lineBox{
      position: relative;
      display: flex;
      justify-content: flex-start;
      align-items: flex-end;
      margin-right: 20px;

      .line{
        width: 200px;
        height: 240px;
        border: 1px dashed #c0c0c0;
        border-left: 0;
        transform: skew(-20deg);
      }

      .lines{
        width: 120px;
        height: 2px;
        border-bottom: 1px dashed #c0c0c0;
      }

      .icons{
        position: absolute;
        bottom: -7px;
        left: -10px;
      }
    }
  }

  .coversionBox{
    .titles,.nums{
      color: #333333;
      font-size: 14px;
    }
  }
}
</style>
最后附上Echarts官方API地址


 889
889

 被折叠的 条评论
为什么被折叠?
被折叠的 条评论
为什么被折叠?
 到【灌水乐园】发言


