


SpringBoot Actuator
1、简介
未来每一个微服务在云上部署以后,我们都需要对其进行监控、追踪、审计、控制等。SpringBoot就抽取了Actuator场景,使得我们每个微服务快速引用即可获得生产级别的应用监控、审计等功能。
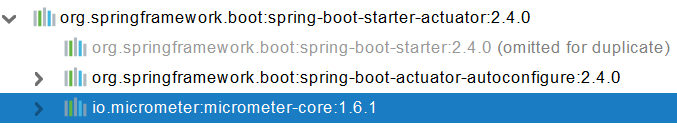
使用时,我们只需要添加下面的依赖:
 		<dependency>
            <groupId>org.springframework.boot</groupId>
            <artifactId>spring-boot-starter-actuator</artifactId>
        </dependency>
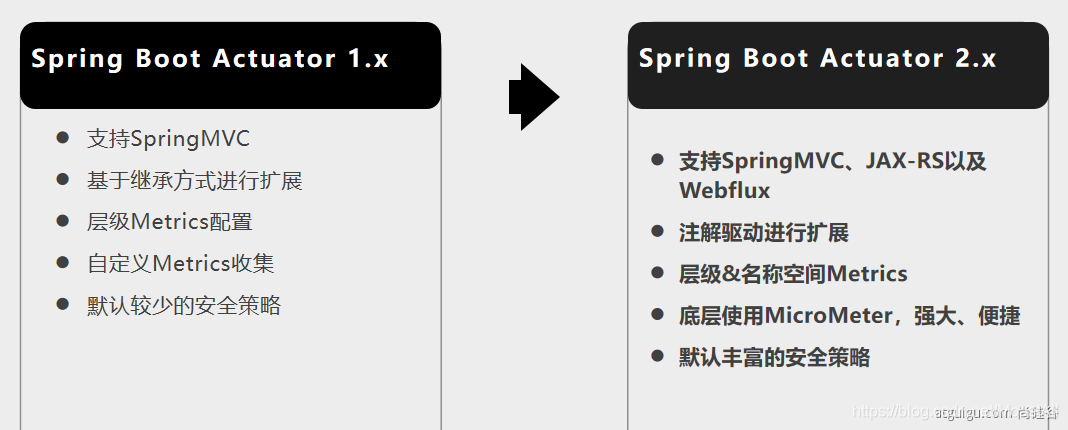
2、1.x与2.x的不同
3、如何使用
引入场景
- 访问 http://localhost:8080/actuator/**
- 暴露所有监控信息为HTTP
如果不在application.yaml中配置下面的信息,则只能访问 /health 和 /info
management:
  endpoints:
    enabled-by-default: true #暴露所有端点信息
    web:
      exposure:
        include: '*'  #以web方式暴露
- 测试
http://localhost:8080/actuator/beans
http://localhost:8080/actuator/configprops
http://localhost:8080/actuator/metrics
http://localhost:8080/actuator/metrics/jvm.gc.pause
http://localhost:8080/actuator/endpointName/detailPath
… …
使用时的测试截图如下:


除此之外,我们还可以利用java自带的jconsole工具来查看性能方面的信息:(jMX)


4、管理Endpoints
1、开启与禁用Endpoints
- 默认所有的Endpoint除过shutdown都是开启的。
- 需要开启或者禁用某个Endpoint。配置模式为
management.endpoint.<endpointName>.enabled = true
management:
  endpoint:
    beans:
      enabled: true
- 或者禁用所有的Endpoint然后手动开启指定的Endpoint
management:
  endpoints:
    enabled-by-default: false
  endpoint:
    beans:
      enabled: true
    health:
      enabled: true
2、暴露Endpoints
支持的暴露方式
- HTTP:默认只暴露health和info Endpoint
- JMX:默认暴露所有Endpoint
- 除过health和info,剩下的Endpoint都应该进行保护访问。如果引入SpringSecurity,则会默认配置安全访问规则
3.定制 Endpoint
我们发现一个问题:访问 /health 时没什么细节方面的信息,如下:

1、定制 Health 信息
给容器中添加下面的bean,注意名字必须是以HealthIndicator结尾
package com.atguigu.admin.acutuator.health;

import org.springframework.boot.actuate.health.AbstractHealthIndicator;
import org.springframework.boot.actuate.health.Health;
import org.springframework.boot.actuate.health.Status;
import org.springframework.stereotype.Component;

import java.util.HashMap;
import java.util.Map;


@Component
public class MyComHealthIndicator extends AbstractHealthIndicator {

    /**
     * 真实的检查方法
     * @param builder
     * @throws Exception
     */
    @Override
    protected void doHealthCheck(Health.Builder builder) throws Exception {
        //mongodb。  获取连接进行测试
        Map<String,Object> map = new HashMap<>();
        // 检查完成
        if(1 == 1){
//            builder.up(); //健康
            builder.status(Status.UP);
            map.put("count",1);
            map.put("ms",100);
        }else {
//            builder.down();
            builder.status(Status.OUT_OF_SERVICE);
            map.put("err","连接超时");
            map.put("ms",3000);
        }


        builder.withDetail("code",100)
                .withDetails(map);

    }
}
然后还要在application.yaml中配置下面的东西:
management:
    health:
      enabled: true
      show-details: always #总是显示详细信息。可显示每个模块的状态信息
访问http://localhost:8777/actuator/health可以看见下面自己写的东西已经显示出来了

2、定制info信息
常用两种方式
1、编写配置文件
info:
  appName: boot-admin
  version: 2.0.1
  mavenProjectName: @project.artifactId@  #使用@@可以获取maven的pom文件值
  mavenProjectVersion: @project.version@
2、编写InfoContributor
package com.atguigu.admin.acutuator.info;

import org.springframework.boot.actuate.info.Info;
import org.springframework.boot.actuate.info.InfoContributor;
import org.springframework.stereotype.Component;
import java.util.Collections;

@Component
public class AppInfoInfoContributor implements InfoContributor {


    @Override
    public void contribute(Info.Builder builder) {

        builder.withDetail("msg","你好")
                .withDetail("hello","lzl")
                .withDetails(Collections.singletonMap("world","jjy"));
    }
}

3、定制Metrics信息
class MyService{
    Counter counter;
    public MyService(MeterRegistry meterRegistry){
         counter = meterRegistry.counter("myservice.method.running.counter");
    }

    public void hello() {
        counter.increment();
    }
}


//也可以使用下面的方式
@Bean
MeterBinder queueSize(Queue queue) {
    return (registry) -> Gauge.builder("queueSize", queue::size).register(registry);
}
4、定制Endpoint
@Component
@Endpoint(id = "container")
public class DockerEndpoint {


    @ReadOperation
    public Map getDockerInfo(){
        return Collections.singletonMap("info","docker started...");
    }

    @WriteOperation
    private void restartDocker(){
        System.out.println("docker restarted....");
    }

}
5、可视化
想要对某个项目进行可视化监控,就先得导入下面的依赖:该项目端口是7777
        <dependency>
            <groupId>de.codecentric</groupId>
            <artifactId>spring-boot-admin-starter-client</artifactId>
            <version>2.3.1</version>
        </dependency>
并在yaml中配置:
spring:
  boot:
    admin:
      client:
        url: http://localhost:8888
        instance:
          prefer-ip: true  #使用ip注册进来
  application:
    name: 卢泽龙的应用
再创建一个项目,并勾选web模块,导入下面的依赖作为检测者:该项目端口是8888
        <dependency>
            <groupId>de.codecentric</groupId>
            <artifactId>spring-boot-admin-starter-server</artifactId>
            <version>2.3.1</version>
        </dependency>
现在启动两个项目,访问http://localhost:8888/即可看到下面的界面:


 10万+
10万+


 被折叠的 条评论
为什么被折叠?
被折叠的 条评论
为什么被折叠?
 到【灌水乐园】发言


