


目录
一、前言
想知道整个系统前端和后端所有方法的执行时间。是的你没有听错,是每个方法。这个需求一提出来就被整蒙了,给每个方法计算执行时间,这不是平白给系统压力吗?
二、思路
既然提了,先给思路吧。其实很简单,每个方法执行前记录一个时间戳,执行结束后记录一个时间戳,相减就是执行时间。但是去每个方法里改是不现实的,那么多代码,如果去侵入那工作量也太大了,而且如果有一天项目经理又不要这个功能了呢?
一听到这个需求,就应该想到AOP,用了那么久的Spring,IOC、AOP背的滚瓜烂熟,现在就是应用的时候了。
三、使用AOP记录时间
AOP的概念就不在这里提了,面向切面,无侵入开发,正适合这个需求。而且20行代码可以解决问题。
3.1 引入Aop依赖
<dependency>
    <groupId>org.springframework.boot</groupId>
    <artifactId>spring-boot-starter-aop</artifactId>
</dependency>
3.2 配置切点
首先配置一个切入点,我这里要让切面在TestController这个类中的所有方法上生效
import lombok.extern.slf4j.Slf4j;
import org.aspectj.lang.ProceedingJoinPoint;
import org.aspectj.lang.annotation.Around;
import org.aspectj.lang.annotation.Aspect;
import org.aspectj.lang.annotation.Pointcut;
import org.springframework.core.annotation.Order;
import org.springframework.stereotype.Component;

@Slf4j
@Component
@Aspect
@Order(10)
public class LogAspect {

    //配置切入点,即执行的位置
    @Pointcut("execution(* com.example.springbootstatistictime.demos.web.TestController.*(..))")
    public void pointCut() {
    }

    //使用环绕通知,在方法的执行前后分别记录一个时间相减
    @Around("pointCut()")
    public Object doLog(ProceedingJoinPoint proceedingJoinPoint) {
        long startTime = System.currentTimeMillis();
        Object object = null;
        try {
            object = proceedingJoinPoint.proceed();
        } catch (Throwable throwable) {
            throwable.printStackTrace();
        } finally {
            long endTime = System.currentTimeMillis();
            log.info(proceedingJoinPoint.getSignature().toShortString() + "方法执行了:" + (endTime - startTime) + "ms");
        }
        return object;
    }
}
3.3 编写测试方法
import org.springframework.web.bind.annotation.GetMapping;
import org.springframework.web.bind.annotation.RequestMapping;
import org.springframework.web.bind.annotation.RestController;

@RestController
@RequestMapping("/testApi")
public class TestController {

    @GetMapping("/test1")
    public String testAop(){
        try {
            Thread.sleep(1000);
        } catch (InterruptedException e) {
            e.printStackTrace();
        }
        return "testAop";
    }
}
3.4 结果
启动springBoot,使用postman调用(http://127.0.0.1:8080/testApi/test1)得到结果

四、 自定义注解 + Aop 记录时间
现在已经可以满足项目经理的需求了,如果以后新的代码没有在切入点的范围内,就又不生效了,因此在以上代码的基础上做出改变,定义一个注解,要记录时直接写个注解。
4.1 引入Aop依赖
<dependency>
    <groupId>org.springframework.boot</groupId>
    <artifactId>spring-boot-starter-aop</artifactId>
</dependency>
4.2 编写注解
@Target(value = ElementType.METHOD)
@Retention(value = RetentionPolicy.RUNTIME)
@Documented
public @interface LogAnnotation {
}
4.3 配置切点
将注解接口路径配置到切点中,而不是配置测试方法的路径。
import lombok.extern.slf4j.Slf4j;
import org.aspectj.lang.ProceedingJoinPoint;
import org.aspectj.lang.annotation.Around;
import org.aspectj.lang.annotation.Aspect;
import org.aspectj.lang.annotation.Pointcut;
import org.springframework.core.annotation.Order;
import org.springframework.stereotype.Component;
@Slf4j
@Component
@Aspect
@Order(10)
public class LogAspect {
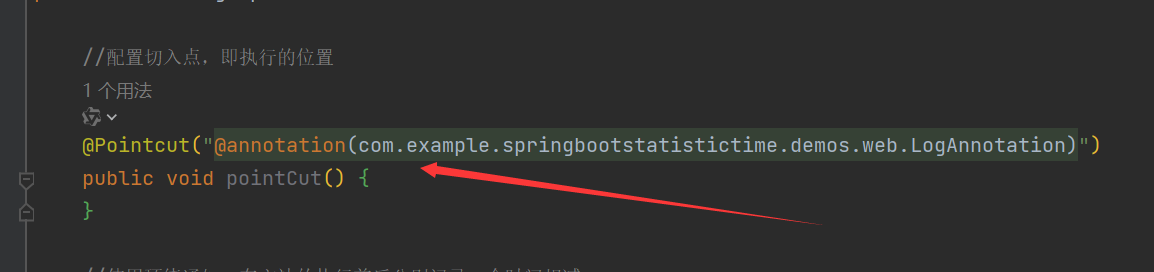
//配置切入点,即执行的位置
@Pointcut("@annotation(com.example.springbootstatistictime.demos.web.LogAnnotation)")
public void pointCut() {
}
//使用环绕通知,在方法的执行前后分别记录一个时间相减
@Around("pointCut()")
public Object doLog(ProceedingJoinPoint proceedingJoinPoint) {
long startTime = System.currentTimeMillis();
Object object = null;
try {
object = proceedingJoinPoint.proceed();
} catch (Throwable throwable) {
throwable.printStackTrace();
} finally {
long endTime = System.currentTimeMillis();
log.info(proceedingJoinPoint.getSignature().toShortString() + "方法执行了:" + (endTime - startTime) + "ms");
}
return object;
}
}4.4 编写测试方法
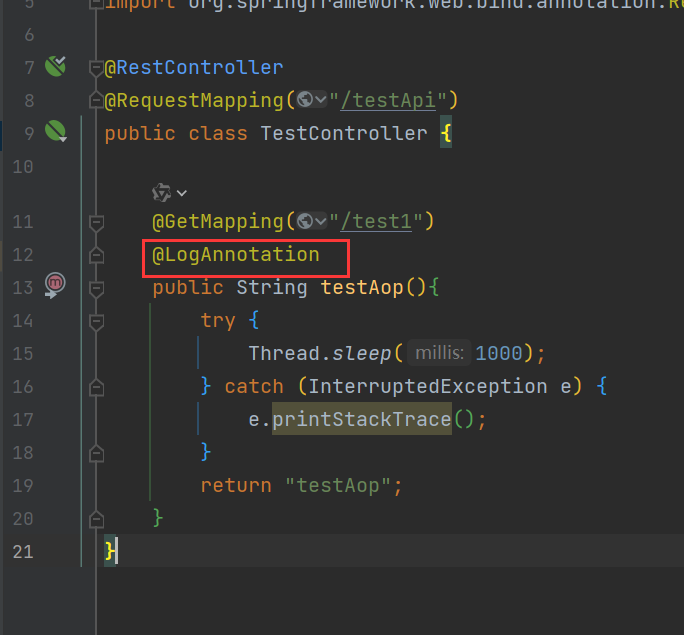
在测试方法上加上注解。
import org.springframework.web.bind.annotation.GetMapping;
import org.springframework.web.bind.annotation.RequestMapping;
import org.springframework.web.bind.annotation.RestController;

@RestController
@RequestMapping("/testApi")
public class TestController {

    @GetMapping("/test1")
    @LogAnnotation
    public String testAop(){
        try {
            Thread.sleep(1000);
        } catch (InterruptedException e) {
            e.printStackTrace();
        }
        return "testAop";
    }
}
4.5 结果
启动springBoot,使用postman调用(http://127.0.0.1:8080/testApi/test1)得到结果

五、关于记录数据的问题
项目经理还希望可以随时查某个时间的方法执行时间,那就必须存下来这些数据了。
现在这个系统共有4万人使用,如果存入数据库,我在表里定义三个字段:时间、调用人员、调用时间,调用方法,一条数据大约在40字节大小。按四万个人的使用,一天最少也要产生4000万条数据,大约1.5G。数据量倒是没关系,对数据库写入的压力就更大了。
如果存在日志里也一样,日志会变得特别大,而且排查起来不方便。
最终,在和项目经理一顿讲理之后,终于改变了他的想法,只记录执行时间超过200ms的方法,并且数据就记录下日志里,这个需求也算是通过沟通和小部分代码就解决了。


 975
975

 被折叠的 条评论
为什么被折叠?
被折叠的 条评论
为什么被折叠?
 到【灌水乐园】发言


