


Android饼状图的绘制
在Github上看到一个不错的Android图标绘制的开源项目MPAndroidChart[https://github.com/PhilJay/MPAndroidChart],今天在这里介绍一下里面饼状图的使用,很少写博客,写得不好,同行见谅,勿喷。
先来看看官网的效果:

MPAndroidChart的使用
第一步,当然是引用这个库
- 在AndroidStudio的project的build.gradle添加下面的内容:
allprojects {
    repositories {
            maven { url "https://jitpack.io" }
    }
}
- 1
- 2
- 3
- 4
- 5

- 1
- 2
- 3
- 4
- 5
- 在要使用的module的build.gradle添加:
dependencies {
    compile 'com.github.PhilJay:MPAndroidChart:v3.0.0-beta1'
}
- 1
- 2
- 3

- 1
- 2
- 3
第二步,在布局文件里面添加饼状图控件
<?xml version="1.0" encoding="utf-8"?>
<LinearLayout xmlns:android="http://schemas.android.com/apk/res/android"
    android:orientation="vertical"              android:layout_width="match_parent"
    android:layout_height="match_parent"
    android:background="@color/white">

    <com.github.mikephil.charting.charts.PieChart
        android:id="@+id/consume_pie_chart"
        android:layout_width="match_parent"
        android:layout_marginRight="16dp"
        android:layout_marginLeft="16dp"
        android:layout_height="320dip" />
</LinearLayout>
- 1
- 2
- 3
- 4
- 5
- 6
- 7
- 8
- 9
- 10
- 11
- 12
- 13
- 1
- 2
- 3
- 4
- 5
- 6
- 7
- 8
- 9
- 10
- 11
- 12
- 13
第三步,在Activity或者Fragment里面使用
pieChart.setUsePercentValues(true);//设置value是否用显示百分数,默认为false
pieChart.setDescription("全年消费情况");//设置描述
pieChart.setDescriptionTextSize(20);//设置描述字体大小
//pieChart.setDescriptionColor(); //设置描述颜色
//pieChart.setDescriptionTypeface();//设置描述字体

pieChart.setExtraOffsets(5, 5, 5, 5);//设置饼状图距离上下左右的偏移量

pieChart.setDragDecelerationFrictionCoef(0.95f);//设置阻尼系数,范围在[0,1]之间,越小饼状图转动越困难

pieChart.setDrawCenterText(true);//是否绘制中间的文字
pieChart.setCenterTextColor(Color.RED);//中间的文字颜色
pieChart.setCenterTextSize(24);//中间的文字字体大小

pieChart.setDrawHoleEnabled(true);//是否绘制饼状图中间的圆
pieChart.setHoleColor(Color.WHITE);//饼状图中间的圆的绘制颜色
pieChart.setHoleRadius(58f);//饼状图中间的圆的半径大小

pieChart.setTransparentCircleColor(Color.BLACK);//设置圆环的颜色
pieChart.setTransparentCircleAlpha(110);//设置圆环的透明度[0,255]
mChart.setTransparentCircleRadius(60f);//设置圆环的半径值

// enable rotation of the chart by touch
pieChart.setRotationEnabled(true);//设置饼状图是否可以旋转(默认为true)
pieChart.setRotationAngle(10);//设置饼状图旋转的角度

pieChart.setHighlightPerTapEnabled(true);//设置旋转的时候点中的tab是否高亮(默认为true)

Legend l = mChart.getLegend();
      l.setPosition(Legend.LegendPosition.RIGHT_OF_CHART_CENTER);//设置每个tab的显示位置
l.setXEntrySpace(0f);
l.setYEntrySpace(0f);//设置tab之间Y轴方向上的空白间距值
l.setYOffset(0f);

// entry label styling
pieChart.setDrawEntryLabels(true);//设置是否绘制Label
pieChart.setEntryLabelColor(Color.BLACK);//设置绘制Label的颜色
//pieChart.setEntryLabelTypeface(mTfRegular);
pieChart.setEntryLabelTextSize(10f);//设置绘制Label的字体大小

pieChart.setOnChartValueSelectedListener(this);//设值点击时候的回调
pieChart.animateY(3400, Easing.EasingOption.EaseInQuad);//设置Y轴上的绘制动画
ArrayList<PieEntry> pieEntries = new ArrayList<>();
        for(ConsumeTypeMoneyPo typeMoneyVo : consumeTypeMoneyVoList){
            PieEntry pieEntry = new PieEntry((float)typeMoneyVo.getTotalMoney(), typeMoneyVo.getConsumeTypeName());
            pieEntries.add(pieEntry);
            totalMoney += typeMoneyVo.getTotalMoney();
        }
        String centerText = mQueryYear+"年消费\n¥"+totalMoney;
pieChart.setCenterText(centerText);//设置中间的文字
PieDataSet pieDataSet = new PieDataSet(pieEntries, "");
pieDataSet.setColors(getPieChartColors());
pieDataSet.setSliceSpace(3f);//设置选中的Tab离两边的距离
pieDataSet.setSelectionShift(5f);//设置选中的tab的多出来的
PieData pieData = new PieData();
pieData.setDataSet(pieDataSet);

pieData.setValueFormatter(new PercentFormatter());
pieData.setValueTextSize(12f);
pieData.setValueTextColor(Color.BLUE);

pieChart.setData(pieData);
// undo all highlights
pieChart.highlightValues(null);
pieChart.invalidate();
- 1
- 2
- 3
- 4
- 5
- 6
- 7
- 8
- 9
- 10
- 11
- 12
- 13
- 14
- 15
- 16
- 17
- 18
- 19
- 20
- 21
- 22
- 23
- 24
- 25
- 26
- 27
- 28
- 29
- 30
- 31
- 32
- 33
- 34
- 35
- 36
- 37
- 38
- 39
- 40
- 41
- 42
- 43
- 44
- 45
- 46
- 47
- 48
- 49
- 50
- 51
- 52
- 53
- 54
- 55
- 56
- 57
- 58
- 59
- 60
- 61
- 62
- 63
- 64
- 65
运行起来效果就是如下所示:
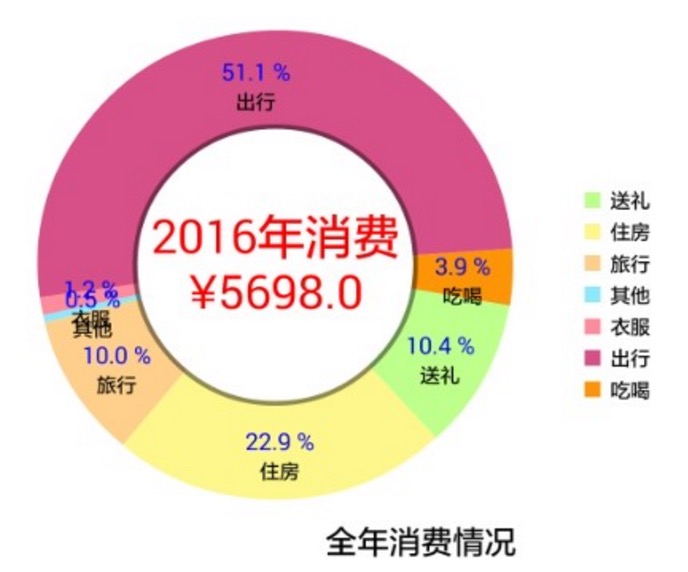
几个可能没有表述清楚的地方:
pieChart.setHighlightPerTapEnabled(true);//设置旋转的时候点中的tab是否高亮(默认为true)
- 1
- 1
看下图红色部分,选中的一块与相邻两边有一块白色的距离,并且选中的这一块变长了,如果设置为false将没有这种效果。
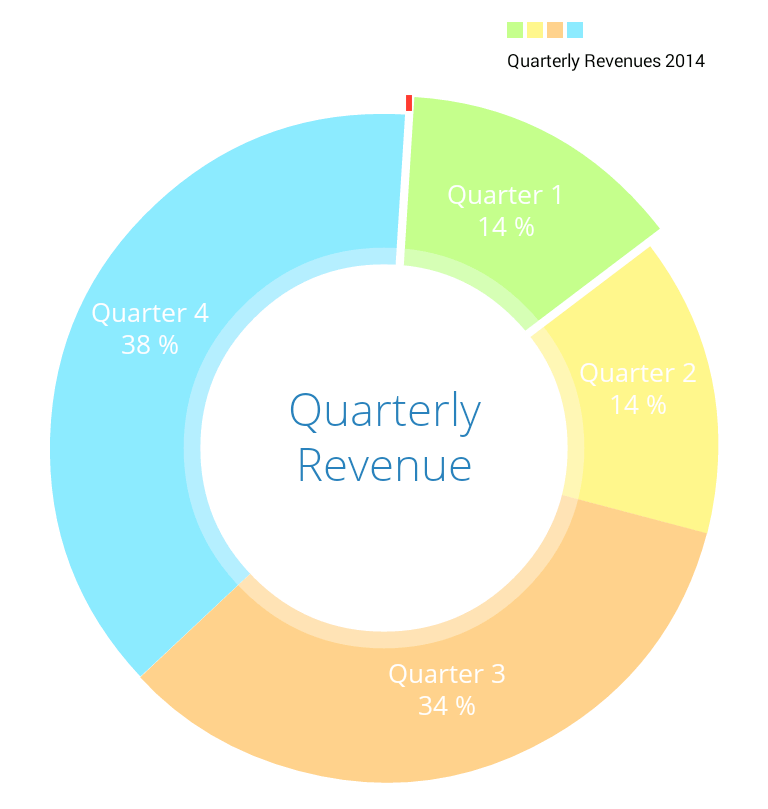
pieDataSet.setSliceSpace(3f);//设置选中的Tab离两边的距离,这个白色的部分的宽度就是通过setSliceSpace这个方法设置。
pieDataSet.setSelectionShift(5f);//设置选中的tab的多出来的
如下图,Quarter 1凸出来长度就是通过setSelectionShift方法设置
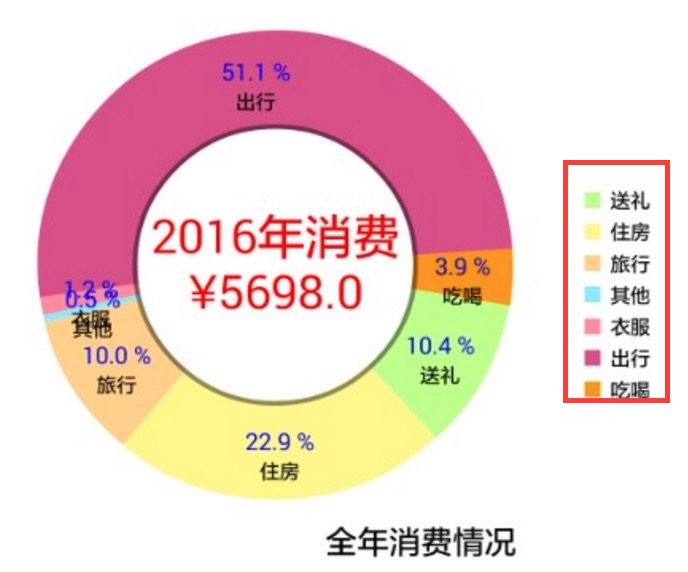
Legend l = mChart.getLegend();
l.setPosition(Legend.LegendPosition.RIGHT_OF_CHART_CENTER);//设置每个tab的显示位置(这个位置是指下图右边红色方框框起来部分的位置 )
l.setXEntrySpace(0f);
l.setYEntrySpace(0f);//设置tab之间Y轴方向上的空白间距值
l.setYOffset(0f);


 778
778

 被折叠的 条评论
为什么被折叠?
被折叠的 条评论
为什么被折叠?
 到【灌水乐园】发言


