


目录
1.介绍
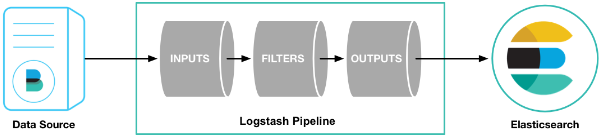
ELK是Elasticsearch、Logstash、Kibana的简称,这三者是核心套件,但并非全部。
Elasticsearch是实时全文搜索和分析引擎,提供搜索、分析、存储数据三大功能;是一套开放REST和JAVA API等结构提供高效搜索功能,可扩展的分布式系统。它构建于Apache Lucene搜索引擎库之上。
Logstash官方定位为数据采集器(Data Shipper),可以发现比Beats定位少了Lightweight,意味着Logstash将占用更多资源,但同时功能肯定更强大。它担任ETL角色(英文Extract-Transform-Load的缩写),用来描述将数据从来源端经过抽取(extract)、转换(transform)、加载(load)至目的端的过程。我们通常的数据导入ES集群就可以使用logstash。
Kibana是一个基于Web的图形界面,用于搜索、分析和可视化 存储在 Elasticsearch中的数据。它利用Elasticsearch的REST接口来检索数据,不仅允许用户创建他们自己的数据的定制仪表板视图,还允许他们以特殊的方式查询和过滤数据。


2.Elastic Stack安装
2.1 ES安装配置和启动常见问题
- 官网下载
https://www.elastic.co/cn/downloads/
Elastic的相关产品各个版本都可以在这里下载。

- 安装和启动

注:
1. 环境要求jdk1.8+。
2. 后台启动:/elasticsearch-6.X.X/bin/elasticsearch -d
3. 不能使用root用户启动
- 配置文件
在解压的config目录下修改elastic.yml配置。
# ======================== Elasticsearch Configuration =========================
#
# NOTE: Elasticsearch comes with reasonable defaults for most settings.
#       Before you set out to tweak and tune the configuration, make sure you
#       understand what are you trying to accomplish and the consequences.
#
# The primary way of configuring a node is via this file. This template lists
# the most important settings you may want to configure for a production cluster.
#
# Please consult the documentation for further information on configuration options:
# https://www.elastic.co/guide/en/elasticsearch/reference/index.html
#
# ---------------------------------- Cluster -----------------------------------
#
# Use a descriptive name for your cluster:
# 集群名称
cluster.name: es-cluster
#
# ------------------------------------ Node ------------------------------------
#
# Use a descriptive name for the node:
#该节点名称,不同节点配置不同的名称
node.name: node-1
#
# Add custom attributes to the node:
#
#node.attr.rack: r1
#
# ----------------------------------- Paths ------------------------------------
#
# Path to directory where to store the data (separate multiple locations by comma):
#数据目录
path.data: /home/elasticsearchdata/data
#
# Path to log files:
#日志目录
path.logs: /home/elasticsearchdata/log
#
# ----------------------------------- Memory -----------------------------------
#
# Lock the memory on startup:
#锁定物理内存地址,防止es内存被交换出去,也就是避免es使用swap交换分区,频繁的交换,会导致IOPS变高。
bootstrap.memory_lock: true
#
# Make sure that the heap size is set to about half the memory available
# on the system and that the owner of the process is allowed to use this
# limit.
#
# Elasticsearch performs poorly when the system is swapping the memory.
#
# ---------------------------------- Network -----------------------------------
#
# Set the bind address to a specific IP (IPv4 or IPv6):
#服务器当前IP
network.host: 192.168.23.10
#
# Set a custom port for HTTP:
#端口
http.port: 9200
#
# For more information, consult the network module documentation.
#
# --------------------------------- Discovery ----------------------------------
#
# Pass an initial list of hosts to perform discovery when new node is started:
# The default list of hosts is ["127.0.0.1", "[::1]"]
#集群所有节点
discovery.zen.ping.unicast.hosts: ["192.168.23.10", "192.168.23.11", "192.168.23.12"]
#
# Prevent the "split brain" by configuring the majority of nodes (total number of master-eligible nodes / 2 + 1):
#和节点数有关,避免脑裂(节点数/2+1)
discovery.zen.minimum_master_nodes: 2
#
# For more information, consult the zen discovery module documentation.
#
# ---------------------------------- Gateway -----------------------------------
#
# Block initial recovery after a full cluster restart until N nodes are started:
#
#gateway.recover_after_nodes: 3
#
# For more information, consult the gateway module documentation.
#
# ---------------------------------- Various -----------------------------------
#
# Require explicit names when deleting indices:
#
#action.destructive_requires_name: true
- 启动常见问题
- 问题一:Exception in thread “main” SettingsException[Failed to load settings from [elasticsearch.yml]]; nested: ElasticsearchParseException[malformed, expected settings to start with ‘object’, instead was [VALUE_STRING]];
加载解析配置文件异常,参数与值之间需要空格,比较难以发现。
node.name:node-1  ##错误
node.name: node-1 ##正确
- 问题二:org.elasticsearch.bootstrap.StartupException: java.lang.RuntimeException: can not run elasticsearch as root.
处于对root用户的安全保护,需要使用其他用户组进行授权启动
# 新增用户组授权启动
    groupadd es
    useradd es -g es -p es
    chown -R es:es  elasticsearch-6.X.X
# 切换用户,重新启动
    su es
    ./elasticsearch-6.X.X/bin/elasticsearch -d
- 问题三:OpenJDK 64-Bit Server VM warning: INFO: os::commit_memory(0x0000000085330000, 2060255232, 0) failed; error=‘Cannot a …’(errno=12);
对es的内存分配过高,超出系统内存,在虚拟机上安装时经常出现。需要修改es的 jvm.options 配置。
## JVM configuration

################################################################
## IMPORTANT: JVM heap size
################################################################
##
## You should always set the min and max JVM heap
## size to the same value. For example, to set
## the heap to 4 GB, set:
##
## -Xms4g
## -Xmx4g
-Xms3g
-Xmx3g
##
## See https://www.elastic.co/guide/en/elasticsearch/reference/current/heap-size.html
## for more information
##
################################################################

# Xms represents the initial size of total heap space
# Xmx represents the maximum size of total heap space
- 问题四:ERROR: [3] bootstrap checks failed
启动检查不通过,在虚拟机上安装时经常出现。详细错误信息如下:
[2020-03-20T12:35:47,152][INFO ][o.e.b.BootstrapChecks    ] [SUcoFrg] bound or publishing to a non-loopback address, enforcing bootstrap checks
ERROR: [4] bootstrap checks failed
[1]: max file descriptors [4096] for elasticsearch process is too low, increase to at least [65536]
[2]: max number of threads [3802] for user [elsearch] is too low, increase to at least [4096]
[3]: max virtual memory areas vm.max_map_count [65530] is too low, increase to at least [262144]
[4]: memory locking requested for elasticsearch process but memory is not locked
[2020-03-20T12:35:47,170][INFO ][o.e.n.Node               ] [SUcoFrg] stopping ...
[2020-03-20T12:35:47,316][INFO ][o.e.n.Node               ] [SUcoFrg] stopped
[2020-03-20T12:35:47,316][INFO ][o.e.n.Node               ] [SUcoFrg] closing ...
[2020-03-20T12:35:47,336][INFO ][o.e.n.Node               ] [SUcoFrg] closed
解决:
[1]: max file descriptors [4096] for elasticsearch process is too low, increase to at least [65536]
[2]: max number of threads [3802] for user [elsearch] is too low, increase to at least [4096]
[4]: memory locking requested for elasticsearch process but memory is not locked
step1:修改安全限制配置文件
# 使用root权限 修改安全配置
su root
vi /etc/security/limits.conf

# End of file
*	soft	nproc         4096
*	hard	nproc         4096
es	hard	nofile        65536
es	soft	nofile        65536
* 	hard	memlock		unlimited
*	soft	memlock 	unlimited


# 备注: es为用户名 也可以使用*进行通配所有用户
# nofile 	最大打开文件数目
# nproc 	最大打开线程数目
# memlock 	内存锁
[3]: max virtual memory areas vm.max_map_count [65530] is too low, increase to at least [262144]
step2:修改系统配置文件
vi /etc/sysctl.conf
备注:行末加上vm.max_map_count = 655360 满足错误提示值即可。
# sysctl settings are defined through files in
# /usr/lib/sysctl.d/, /run/sysctl.d/, and /etc/sysctl.d/.
#
# Vendors settings live in /usr/lib/sysctl.d/.
# To override a whole file, create a new file with the same in
# /etc/sysctl.d/ and put new settings there. To override
# only specific settings, add a file with a lexically later
# name in /etc/sysctl.d/ and put new settings there.
#
# For more information, see sysctl.conf(5) and sysctl.d(5).
vm.max_map_count = 655360
以上一些系统配置,修改后可能需要重启,否则不会立即生效。
- 问题五:org.elasticsearch.bootstrap.StartupException: java.lang.IllegalStateException: failed to obtain node locks, tried [[/home/elasticsearch-6.X.X/data/elasticsearch]] with lock id [0]; maybe these locations are not writable or multiple nodes were started without increasing [node.max_local_storage_nodes] (was [1])?
线程占用,杀掉历史进程,重新启动。
# 找到进程
ps -ef | grep elastic
kill -9 进程号
# 重新启动
su es
/elasticsearch-6.X.X/bin/elasticsearch -d
2.2 Kibana安装配置和一些功能介绍
- 安装和启动

同样需要后台启动:nohup bin/kibana &
停止杀掉kibana,找到kibana的端口号有下面3种方式:
netstat -ntulp|grep 5601;
lsof -i:5601;
ps -ef|grep node
- 配置文件
在解压的config目录下修改kibana.yml配置。
# 将默认配置改成如下:

# Kibana的host和port
server.port: 5601
server.host: "192.168.23.10"
# 指向之前安装的es实例(只需要配置主节点ip即可,如果配置整个集群,有节点挂掉,kibana也会出现问题。)
elasticsearch.hosts: ["http://127.0.0.1:9200"]
- 常用功能介绍
- Discover 数据搜索查看
- Visualize 图表制作
- Dashboard 仪表盘制作(将Visualize中制作的各种图表放到Dashboard上综合展示)
- Timelion 时序数据的高级可视化分析(写一些简单的查询语言帮助快速分析数据)
- DevTools 开发者工具(常用的),与es交互(增删改查)。

- Monitoring 监控集群、索引状态(常用)


- Management 配置
可查询索引数据量、mapping等信息。Management >Index Management。

2.3 Logstash安装配置和常见问题
- 安装和启动

注:
核心在于 logstash.conf 配置文件,主要配置数据来源(input)、过滤转换规则(filter)以及输出端(output)
注意: 启动时参数 -f 后支持目录,可执行目录下所有配置。 但一定要注意两点:
1.-f conf/,不要写成 -f conf/*,这样只会执行第一个配置文件。
2. 每一个配置文件的input中都要设置一个变量(一般为type),这样在filter、output中可以通过type来区分判断不同的数据来源,否则数据导入错乱,切记切记,勿谓言之不预!!!
原因:logstash虽然支持执行一个目录下的多个配置文件,但本质还是只启动了一个pipeline,多个配置文件会融合为一个大的配置文件。
- 配置文件(XXX-logstash.conf)
- 简单的JDBC数据库数据导入es示例:
input {
 # stdin { }
    jdbc {
        jdbc_connection_string => "jdbc:mysql://ip:3306/database"
        jdbc_user => "wf"
        jdbc_password => "wf@123"
		# 需要上传对应数据库连接jar
   		jdbc_driver_library => "/usr/local/logstash-6.3.2/mysql-connector-java-5.1.46.jar"
        jdbc_driver_class => "com.mysql.jdbc.Driver"
        jdbc_paging_enabled => "true"
        statement => "SELECT * FROM tabeName t"
        # statement_filepath => "/usr/local/logstash-5.6.10/mysql2es.sql"
        # 定时:分 时 天 月 年
        #schedule => "* * * * *"
        type => "indexname"
    }
 }

#filter {}

 output {
  if [type] == "indexname" {
     stdout {
        codec => json_lines
    }

    elasticsearch {
        hosts => ["http://localhost:9200"]
        index => "indexname"
        document_type => "typename"
        #document_id => "%{id}"
    }
  }
}
- 从txt文本数据导入es的例子
input{
	file {
		# 指定数据所在目录(支持多级目录模糊匹配如:/**/file*.csv)
		path => ["/home/ELK6/logstash-6.3.1/config/hdfs2es/data/company/*.txt"]
		# 设置多长时间检测文件是否修改(单位:秒)
		stat_interval => 1
		# 监听文件的起始位置,默认是end
		start_position => beginning
		# 监听文件读取信息记录的位置
		sincedb_path => "/home/ELK6/logstash-6.3.1/config/hdfs2es/since_db.txt"
		# 设置多长时间会写入读取的位置信息(单位:秒)
		sincedb_write_interval => 5
		# 设置读取数据文件的编码
		codec => plain {
			charset=>"UTF-8"
		}
		type => "indexname"
	}
}

filter {
  if [type] == "indexname" {
	ruby{
		# 文本数据列名(按顺序)
		init => "@kname=['id','social_no','com_code','org_code','tax_code','com_name']"
		# 分隔符
		code => 'event.append(LogStash::Event.new(Hash[@kname.zip(event.get("message").split("\t"))]))'
		# 过滤掉默认加上的字段
		remove_field => ["host", "tags", "path", "message"]
	}
 }
}

output{
  if [type] == "indexname" {
	elasticsearch{
		#Kibana中配置的用户信息
		user => "es"
		password => "es"
		#es集群地址
		hosts => ["192.168.31.194:9200","192.168.31.195:9200"]
		index => "company"
		document_type => "company"
	}
 }
}
- 从其他es集群数据导入es的例子
在这里插入代码片
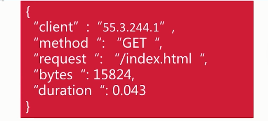
- 强大的 filter
input {
	stdin { }
}

filter {  # 配置过滤器
	# 基于正则表达式提供了丰富可复用的模式(pattern)。可以将非结构化数据转化为结构化。
    grok {
        match => {
         "message" =>"%{IP:client} %{WORD:method} %{URIPATHPARAM:request} %{NUMBER:bytes} %{NUMBER:duration}"
        }
    }
	# mutate可以对结构化后的数据进行增加、删除、修改、替换等字段的处理。
    mutate {
		remove_field => ["message","ecs","input","tags"]
		convert => ["duration", "integer"]
    }

    date {
    	match => [ "log_timestamp", "yyyy-MMM-dd HH:mm:ss" ]
    	locale => "cn"
  	}
}

output {

  	stdout {
    	codec => json_lines  # 以json格式客户端输出
  	}

  	elasticsearch {
    	hosts => ["http://localhost:9200"]
    	# 日志索引按日期生成格式nginx-7.3.0-2019.08.12
    	index => "nginx-%{[@metadata][version]}-%{+YYYY.MM.dd}"
	}
}
grok规则解释:%指明这是一个Grok;IP、WORD、URIPATHPARAM、NUMBER是Grok中已经有的pattern(即正则表达式);后面的client、method等是结构化后的字段名。
客户端输入输出如下:

- 常见问题
- 问题一:logstash 停留到 waiting input 输入直接退出,导致logstash-input-jdbc插件不能运行。
解决:查看配置发现jdbc.conf中 input存在stdin{} 配置,此配置是从控制台输入,此时后台运行会报错卡主等待,注解掉重启测试解决。 - 问题二:Logstash could not be started because there is already another instance …详细日志如下:
Sending Logstash logs to /usr/local/logstash/logstash-6.3.2/logs which is now configured via log4j2.properties
[2020-03-28T12:23:45,931][WARN ][logstash.config.source.multilocal] Ignoring the 'pipelines.yml' file because modules or command line options are specified
[2020-03-28T12:23:46,088][FATAL][logstash.runner          ] Logstash could not be started because there is already another instance using the configured data directory.  If you wish to run multiple instances, you must change the "path.data" setting.
[2020-03-28T12:23:46,130][ERROR][org.logstash.Logstash    ] java.lang.IllegalStateException: Logstash stopped processing because of an error: (SystemExit) exit
解决:一般是历史logstash进程没杀掉,如果杀掉了进程,还是启动报这个错误,可以通过检查 conf/logstash.yml 配置文件找到 path.data路径:
# ------------ Data path ------------------
#
# Which directory should be used by logstash and its plugins
# for any persistent needs. Defaults to LOGSTASH_HOME/data
#
# path.data:
进入该路径,删除掉 .lock 文件。
data$ ls -alh
总用量 20K
drwxr-sr-x  4 tingshuo staff 4.0K 11月 20 11:42 .
drwxr-sr-x 14 tingshuo staff 4.0K 11月 20 11:42 ..
drwxr-sr-x  2 tingshuo staff 4.0K 11月 20 11:42 dead_letter_queue
-rw-r--r--  1 tingshuo staff    0 11月 20 11:42 .lock
drwxr-sr-x  2 tingshuo staff 4.0K 11月 20 11:42 queue
-rw-r--r--  1 tingshuo staff   36 11月 20 11:42 uuid
data$ rm .lock
- 问题三:Expected one of #, input, filter, output at line 1, column 1 (byte 1) after…
# 测试命令文件是否正常
logstash -f  config/logstash-simple-dev.conf -t
这种情况如果反复检查确实配置文件没有语法错误,那极有可能是编码问题。配置文件的编码应该是UTF-8 without bom 而不是 UTF-8。
批量修改编码的方式,我选择的是设置好notpad++默认编码UTF-8 without bom,然后批量打开配置文件(建议一次性最多打开20个),这个过程notpad++会自动转码。
到这里,我们的Elastic Stack,ES的一套组件基本就安装完成了。
3.补充
3.1 IK分词器离线安装
- 为什么要装IK分词器?
es默认的提供的分词器,对中文支持很差。如关键字“湖北省武汉市”将被分词为“湖 北 省 武 汉 市”,这样的分词,分词查询性能和效果很差。 - IK分词有两种:ik_max_word 和 ik_smart
ik_max_word :会将文本做最细粒度的拆分;尽可能多的拆分出多词语 。
ik_smart:会做最粗粒度的拆分;已被分出的词语将不会再次被其它词语占有。
还是以“湖北省武汉市”为例,这两者的分词效果如下:
ik_max_word:湖 北 省 武 汉 市 湖北 湖北省 武汉 武汉市
ik_smart:湖北 省 武汉 市
(1) ik分词器安装十分简单,下载好对应zip包
下载地址:https://github.com/medcl/elasticsearch-analysis-ik/releases/download/v5.5.1/elasticsearch-analysis-ik-6.2.2.zip
(2) 解压到elasticsearch的安装目录下面的plugins 目录就行了
/home/ELK6/elasticsearch-6.6.2/plugins/elasticsearch-ik
(3) 再次修改目录权限,后台启动es
chown -R es:es elasticsearch-6.6.2/

./elasticserch -d


 379
379


 被折叠的 条评论
为什么被折叠?
被折叠的 条评论
为什么被折叠?
 到【灌水乐园】发言


