


前言:
图1是第一版本,又做出了整改,整改也会放在下面,对地图对航线对海运线等做出的一些调整。
简单的概述一下,并把中英文地图的坐标点,以及以中国为中心的json放在后面,做一个积累吧。
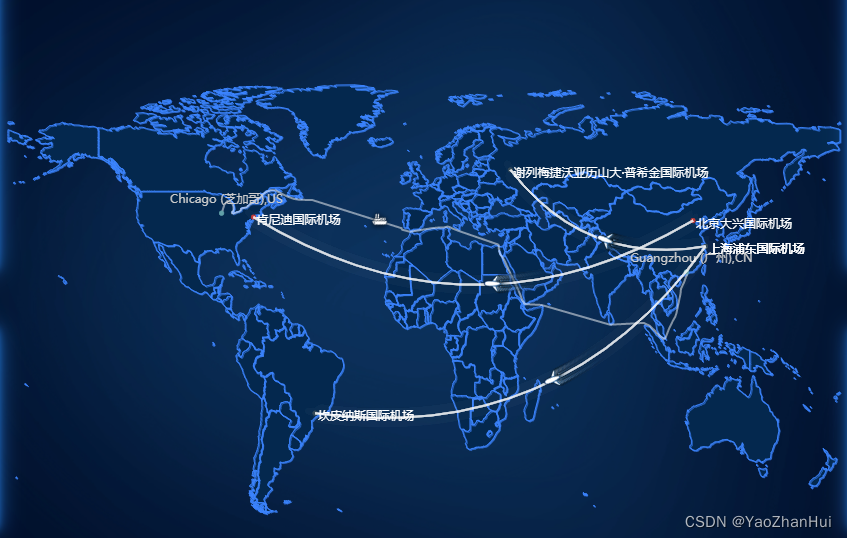 图1
图1
物流运输可视化大屏
主要是关于特种运输空运和海运的展示搭配一些折线图,饼状图做的大屏可视化,上图只是一个简单的dome Map 组件。
碰到tooltip 点击事件问题 :
问题 : 点击事件要用 onclick 事件一定要全局 window。
created() {
            window.handleDetail = this.handleDetail
},

methods: {
        handleDetail: function (record, type) {
            const obj = {
                id: record
            }, modalForm = this.$refs[`modalForm${type}`]
            this.form = type

            if (type && modalForm ) {
                modalForm.edit(obj, type);
                modalForm.title = "详情";
                modalForm.disableSubmit = true;
            }

        },
}

Eachrts
let option = {

tooltip: {
                    show: true,
                    trigger: 'item',
                    triggerOn: 'mousemove|click',    // 提示框触发的条件('mousemove',鼠标移动时触发;'click',鼠标点击时触发;'mousemove|click',同时鼠标移动和点击时触发;'none',不在 'mousemove' 或 'click' 时触发)
                    hideDelay: 1000,
                    enterable: true,
                    extraCssText: 'z-index:3',
                    backgroundColor: 'rgba(77, 186, 242, 0.5)',    // 提示框浮层的背景颜色
                    formatter: function (params) {
                        if (params.seriesType == "scatter" && params.name != tempData[0]) {
                            return "<br>" + params.seriesName + " ---> " + params.data.name + "<br />数量:" + params.data.value[2];
                        } else if (params.seriesType == "lines") {
                            if (params.data.type == 1) {
                                return "<span onclick='handleDetail(" + params.data.id + " ,1)'> 运单号:" + params.data.mawb + " <br/> 预计到达时间:" + params.data.etaTime + "</span>"
                            } else {
                                return "<span onclick='handleDetail(" + params.data.id + " ,2)'> 运单号:" + params.data.mawb + " <br/> 预计到达时间:" + params.data.etaTime + "</span>"
                            }
                        } else {
                            return params.name;
                        }
                    }
                },
}
更改后的代码
 以中国为中心的地图
客户需求的需求是: 尽量贴近现实情况,比如说航线从太平洋或者大西洋走,按照实际现实且按照起飞或者出港时间来算当前位置的。
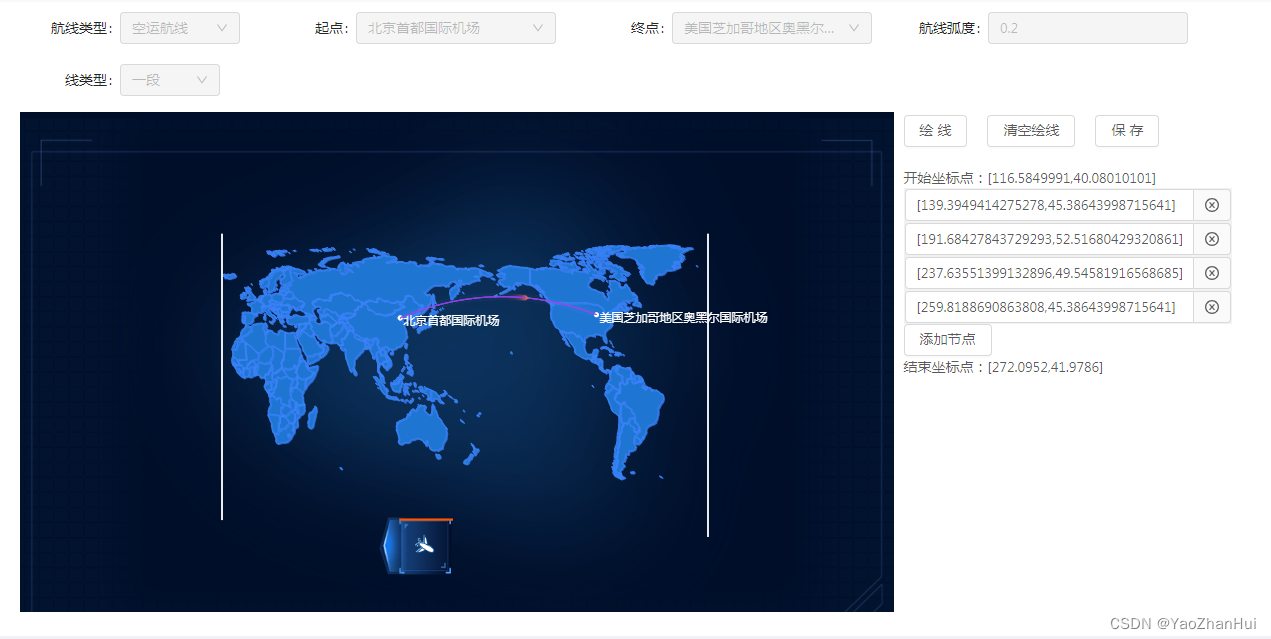 图2
图2
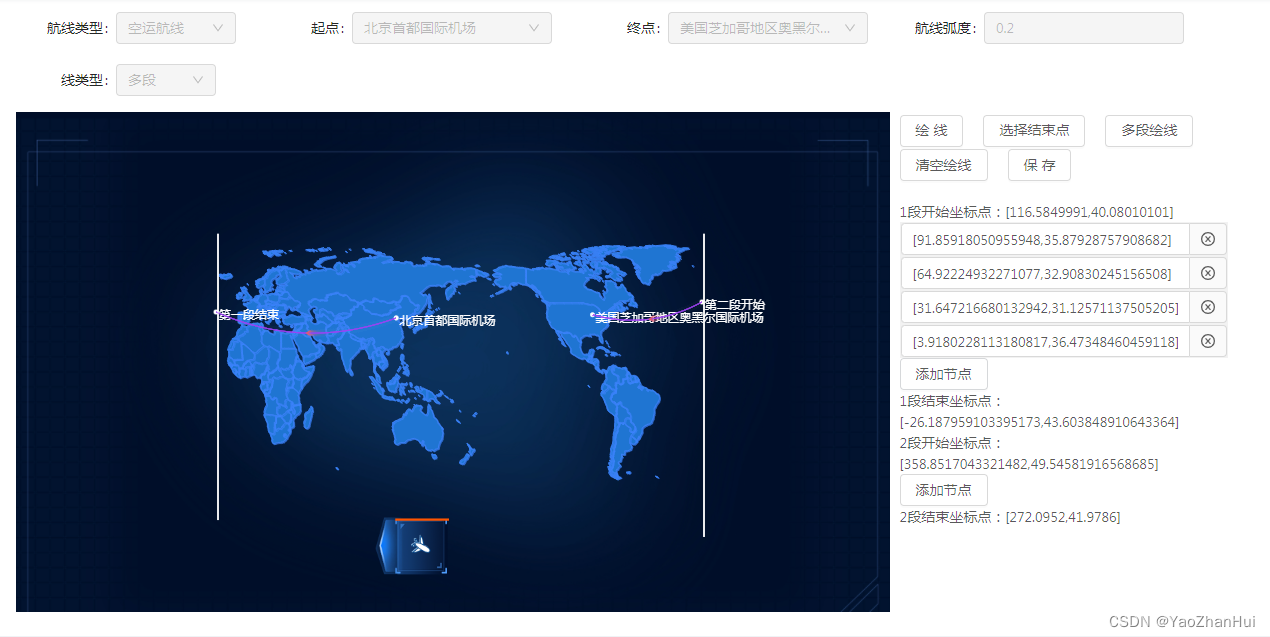
图3
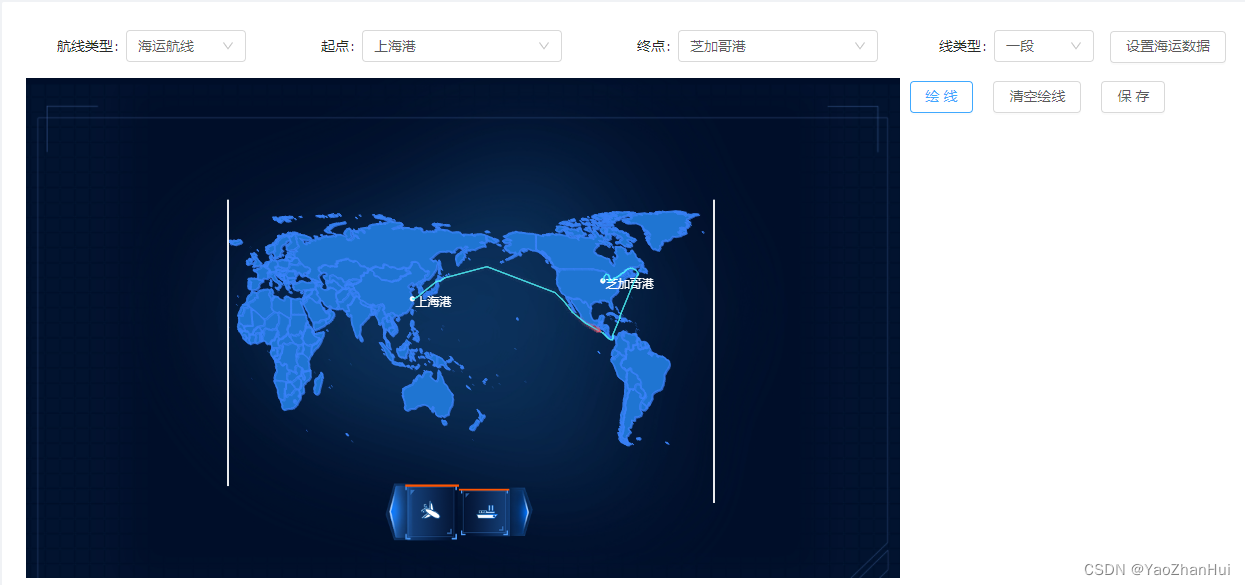
图4
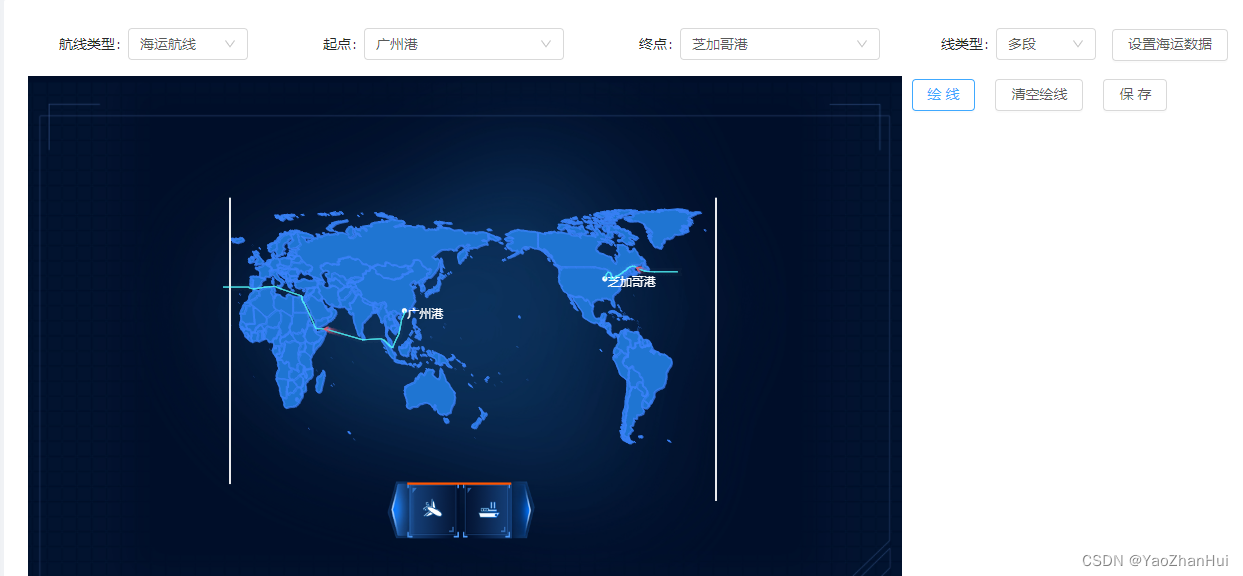
图5
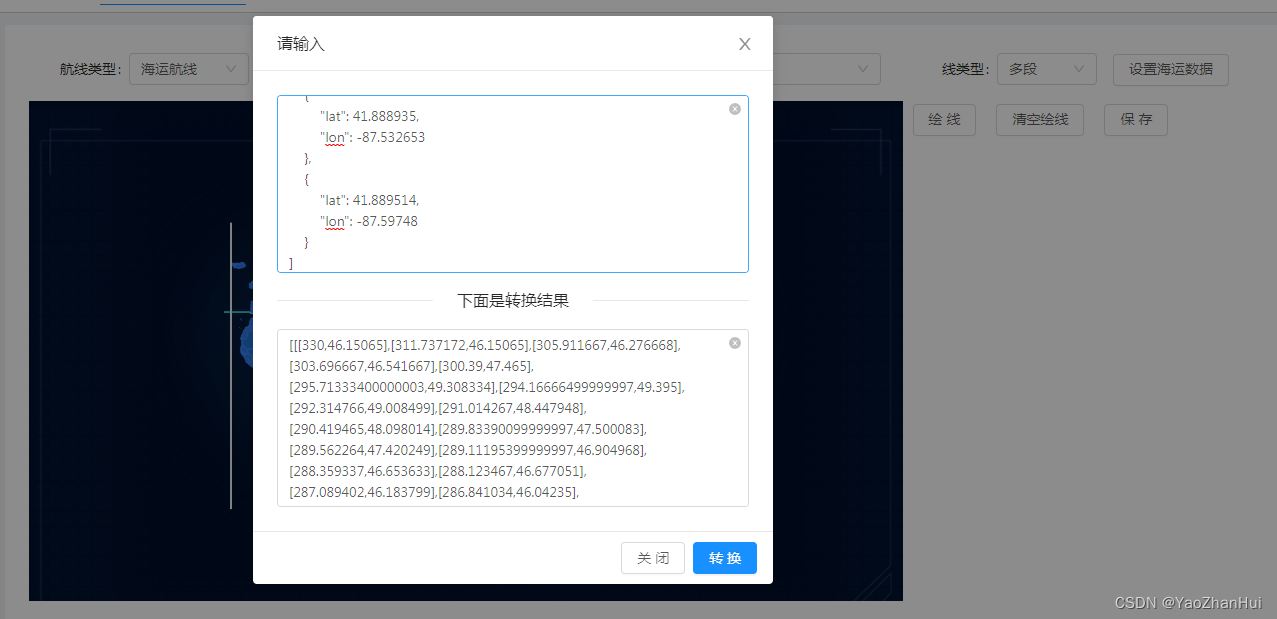
图6
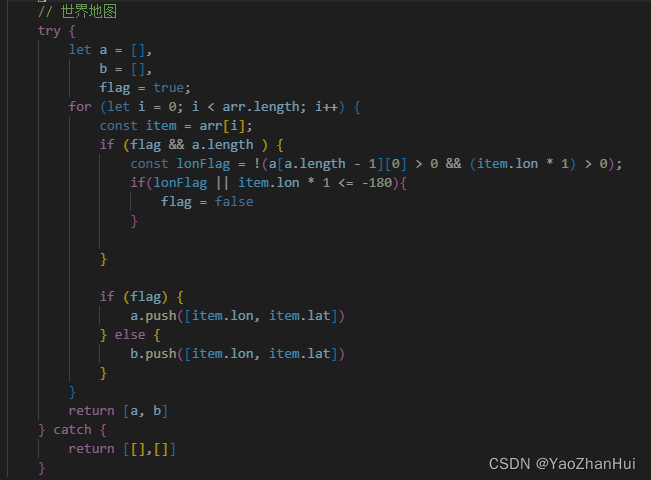
已世界地图为例的海运线绘制方法
备注:航线是在船讯网拿到的数据 船讯网-航线

已中国为地图为例的海运线绘制方法
图2 - 图6 为以中国为地图的线路的绘制以及根据航线去打点做出的飞机在途在那个位置的显示
<template>
<div>
<div id="chart-panel"></div>
</div>
</template>
<script>
import echarts from '@/views/window/components/js/echats.min.js'
import { imgsky, imgsea, iconair, iconsea, iconair2, iconsea2, left, right, left02, right02 } from './base64'
export default {
name: 'Map',
props: {
pageType: {
//页面类型 1 大屏 2获取坐标
type: Number,
default: 1,
},
},
data() {
return {
myChart: null,
list: [],
color: ['#1f75d2', '#0464cc', '#387ff4', 'rgba(59, 132, 255, 0.6)'],
}
},
created() {
window.handleDetail = this.handleDetail
},
mounted() {
this.initMap()
},
methods: {
initMap(type = 'load', width = '50%', roam = false) {
const that = this
this.myChart = echarts.init(document.getElementById('chart-panel'))
echarts.registerMap('world', window._geoJson || {})
let option = {
backgroundColor: 'rgba(255, 255, 255, 0)',
width: width,
tooltip: {
show: true,
trigger: 'item',
triggerOn: 'mousemove|click', // 提示框触发的条件('mousemove',鼠标移动时触发;'click',鼠标点击时触发;'mousemove|click',同时鼠标移动和点击时触发;'none',不在 'mousemove' 或 'click' 时触发)
hideDelay: 1000,
enterable: true,
extraCssText: 'z-index:3',
backgroundColor: 'rgba(77, 186, 242, 0.5)', // 提示框浮层的背景颜色
formatter: function (params) {
if (params.seriesType == 'effectScatter' && params.data.tipzoom == 1) {
console.log(params)
var str = ''
var datas = params.data.list
str += `<div style="width: 100%;max-height: 100px;font-size: 12px; overflow:hidden;overflow-y:auto;background-color:'#1C4D85'">
<table border="0" width="100%" cellspacing="0" cellpadding="0" rules="all">
<thead style="color:#ffffff;font-weight:500;background-color:#1C4D85;">
<tr>
<th colspan="1" rowspan="1" style="font-size:12px;padding:4px 4px;border:0px">${
params.data.lang == 'en' ? 'OrderNumber' : '订单号'
}</th>
<th colspan="1" rowspan="1" style="font-size:12px;padding:4px 4px;border:0px">${
params.data.lang == 'en' ? 'Airline/VESSEL' : '航班/船名'
}</th>
<th colspan="1" rowspan="1" style="font-size:12px;padding:4px 4px;border:0px">${
params.data.lang == 'en' ? 'Start-End' : '出发地-目的地'
}</th>
<th colspan="1" rowspan="1" style="font-size:12px;padding:4px 4px;border:0px">${
params.data.lang == 'en' ? 'Expected Delivery Time' : '预计到达时间'
}</th>
</tr>
</thead>`
datas.forEach((item) => {
str += `<tbody style="color:#ffffff;font-weight:500;background-color:#1C4D85;">
<tr style=";" onclick='handleDetail(${JSON.stringify(item.id)},${
item.orderType
})'>
<td rowspan="1" solspan="1" style="padding:4px 4px;border:0px">${
item.mawb
}</td>
<td rowspan="1" solspan="1" style="padding:4px 4px;border:0px">${
item.airline || item.vessel
}</td>
<td rowspan="1" solspan="1" style="padding:4px 4px;border:0px">${
item.portOfExport
}-${item.portOfArrival}</td>
<td rowspan="1" solspan="1" style="padding:4px 4px;border:0px">${item.etaTime.substring(
0,
10
)}</td>
</tr>
</tbody>`
})
str += `</table>
</div>`
return str
}
if (params.seriesType == 'lines' && params.seriesName == '历史海运') {
var str = ''
var datas = params.data.list
str += `<div style="width: 100%;max-height: 100px;font-size: 12px; overflow:hidden;overflow-y:auto;background-color:'#1C4D85'">
<table border="0" width="100%" cellspacing="0" cellpadding="0" rules="all">
<thead style="color:#ffffff;font-weight:500;background-color:#1C4D85;">
<tr>
<th colspan="1" rowspan="1" style="font-size:12px;padding:4px 4px;border:0px">${
params.data.lang == 'en' ? 'OrderNumber' : '订单号'
}</th>
<th colspan="1" rowspan="1" style="font-size:12px;padding:4px 4px;border:0px">${
params.data.lang == 'en' ? 'Airline/VESSEL' : '航班/船名'
}</th>
<th colspan="1" rowspan="1" style="font-size:12px;padding:4px 4px;border:0px">${
params.data.lang == 'en' ? 'Start-End' : '出发地-目的地'
}</th>
<th colspan="1" rowspan="1" style="font-size:12px;padding:4px 4px;border:0px">${
params.data.lang == 'en' ? 'Expected Delivery Time' : '预计到达时间'
}</th>
</tr>
</thead>`
datas.forEach((item) => {
str += `<tbody style="color:#ffffff;font-weight:500;background-color:#1C4D85;">
<tr style=";" onclick='handleDetail(${JSON.stringify(item.id)},${
item.orderType
})'>
<td rowspan="1" solspan="1" style="padding:4px 4px;border:0px">${
item.mawb
}</td>
<td rowspan="1" solspan="1" style="padding:4px 4px;border:0px">${
item.airline || item.vessel
}</td>
<td rowspan="1" solspan="1" style="padding:4px 4px;border:0px">${
item.portOfExport
}-${item.portOfArrival}</td>
<td rowspan="1" solspan="1" style="padding:4px 4px;border:0px">${item.etaTime.substring(
0,
10
)}</td>
</tr>
</tbody>`
})
str += `</table>
</div>`
return str
}
if (params.seriesType == 'lines' && params.seriesName == '历史空运') {
var str = ''
var datas = params.data.list
str += `<div style="width: 100%;max-height: 100px;font-size: 12px; overflow:hidden;overflow-y:auto;background-color:'#1C4D85'">
<table border="0" width="100%" cellspacing="0" cellpadding="0" rules="all">
<thead style="color:#ffffff;font-weight:500;background-color:#1C4D85;">
<tr>
<th colspan="1" rowspan="1" style="font-size:12px;padding:4px 4px;border:0px">${
params.data.lang == 'en' ? 'OrderNumber' : '订单号'
}</th>
<th colspan="1" rowspan="1" style="font-size:12px;padding:4px 4px;border:0px">${
params.data.lang == 'en' ? 'Airline/VESSEL' : '航班/船名'
}</th>
<th colspan="1" rowspan="1" style="font-size:12px;padding:4px 4px;border:0px">${
params.data.lang == 'en' ? 'Start-End' : '出发地-目的地'
}</th>
<th colspan="1" rowspan="1" style="font-size:12px;padding:4px 4px;border:0px">${
params.data.lang == 'en' ? 'Expected Delivery Time' : '预计到达时间'
}</th>
</tr>
</thead>`
datas.forEach((item) => {
str += `<tbody style="color:#ffffff;font-weight:500;background-color:#1C4D85;">
<tr style=";" onclick='handleDetail(${JSON.stringify(item.id)},1)'>
<td rowspan="1" solspan="1" style="padding:4px 4px;border:0px">${
item.mawb
}</td>
<td rowspan="1" solspan="1" style="padding:4px 4px;border:0px">${
item.airline || item.vessel
}</td>
<td rowspan="1" solspan="1" style="padding:4px 4px;border:0px">${
item.fromName
}-${item.toName}</td>
<td rowspan="1" solspan="1" style="padding:4px 4px;border:0px">${item.etaTime.substring(
0,
10
)}</td>
</tr>
</tbody>`
})
str += `</table>
</div>`
return str
}
},
},
legend: [
{
orient: 'horizontal',
id: 1,
zlevel: 5,
y: '80%',
x: '40.5%',
itemWidth: 74,
itemHeight: 58,
selectorItemGap: 0,
itemGap: -5,
data: [
{
name: '空运',
icon: left02,
},
// {
// name: '历史空运',
// icon: iconair2,
// },
// {
// name: '历史海运',
// icon: iconsea2,
// },
{
name: '海运',
icon: right02,
},
],
selected: {
历史空运: false,
历史海运: false,
},
tooltip: {
show: false,
},
formatter: function (name) {
return echarts.format.truncateText(name)
},
},
{
orient: 'horizontal',
id: 2,
zlevel: 5,
y: '80%',
x: '50.5%',
itemWidth: 74,
itemHeight: 58,
selectorItemGap: 0,
itemGap: -5,
data: [
// {
// name: '空运',
// icon: iconair,
// },
{
name: '历史空运',
icon: right,
},
{
name: '历史海运',
icon: left,
},
// {
// name: '海运',
// icon: iconsea,
// },
],
// selected: {
// 历史空运: false,
// 历史海运: false,
// },
tooltip: {
show: false,
},
formatter: function (name) {
return echarts.format.truncateText(name)
},
},
],
geo: {
map: 'world',
zoom: 1.1,
show: true,
roam: roam,
nameMap: that.$route.query.lang == 'en' ? {} : window._nameMap,
label: {
normal: {
show: false,
},
emphasis: {
show: true,
color: '#fff',
},
},
itemStyle: {
normal: {
//测试高亮
// borderColor: '#f3f3f2',
// shadowColor: '#f3f3f2',
areaColor: this.color[0],
borderColor: this.color[2],
shadowColor: this.color[3],
borderWidth: 1,
shadowOffsetX: 1,
shadowOffsetY: 1,
},
emphasis: {
areaColor: this.color[1],
color: '#fff',
},
},
},
series: [],
}
console.log(option)
this.myChart.setOption(option, true)
this.myChart.on('click', function (params) {
let offsetX = params.event.offsetX
let offsetY = params.event.offsetY
let spot = that.myChart.convertFromPixel('geo', [offsetX, offsetY]) // 转换成坐标
that.$emit('on-spot', spot)
})
if ((type = 'load')) {
that.$emit('load')
}
},
setSpot(list = []) {
//设置城市、航班坐标点
const arrs = [],
num = 10
list.forEach((v) => {
const { dataType = 1, name = 'name', value = [], geoName = '空运' } = v,
data = [
{
type: dataType,
name,
value: value.concat(num), // 坐标点
},
]
arrs.push({
name: geoName,
type: 'effectScatter',
coordinateSystem: 'geo',
zlevel: 2,
rippleEffect: {
//涟漪特效
period: 4, //动画时间,值越小速度越快
brushType: 'stroke', //波纹绘制方式 stroke, fill
scale: 1, //波纹圆环最大限制,值越大波纹越大
color: '#fff',
},
label: {
normal: {
show: true,
position: 'center', //显示位置
offset: [5, 0], //偏移设置
formatter: '{b}', //圆环显示文字
color: '#fff',
textStyle: {
color: '#fff',
},
},
emphasis: {
show: true,
},
},
symbol: 'circle',
symbolSize: function (val) {
return 4 + val[2] / 1000 //圆环大小
},
itemStyle: {
normal: {
show: true,
color: '#fff',
textStyle: {
color: '#fff',
},
},
},
data,
})
})
const series = this.myChart.getOption().series.concat(arrs)
this.myChart.setOption({
series,
})
},
setLine(list = [], bgimg) {
//设置航线、海运线
const arrs = []
console.log(list, 'list')
list.forEach((v) => {
const { dataType = 1, value = [], geoName = '空运', curveness = 0 } = v,
// lineColor = dataType == 1 ? 'rgba(255,255,255, 0.4)' : 'rgba(80, 249, 252, 0.7)',
polyline = dataType == 1 ? false : true,
data = [
{
type: dataType,
coords: value,
},
]
let lineColor = ''
if (bgimg == 1) {
lineColor = dataType == 1 ? 'rgba(255,255,255, 0.4)' : 'rgba(80, 249, 252, 0.7)'
} else if (bgimg == 2) {
//第二套:白色 飞机 / 船
lineColor = dataType == 1 ? '#fc555c' : '#35ec06'
} else {
lineColor = dataType == 1 ? '#9F40F6' : 'rgba(80, 249, 252, 0.7)'
}
arrs.push({
name: geoName,
type: 'lines',
zlevel: 3,
symbol: 'none',
polyline: polyline,
effect: {
show: true,
color: 'rgba(221, 92, 117, 1)',
period: 5, //箭头指向速度,值越小速度越快
trailLength: 0.1, //特效尾迹长度[0,1]值越大,尾迹越长重
symbol: 'arrow', //箭头图标,'circle', 'rect', 'roundRect', 'triangle', 'diamond', 'pin', 'arrow', 'none'
symbolSize: 4, //图标大小,
},
lineStyle: {
normal: {
width: 1, //尾迹线条宽度
// opacity: 0.3, //尾迹线条透明度
curveness: curveness, //尾迹线条曲直度
color: lineColor,
},
},
data,
})
})
const series = this.myChart.getOption().series.concat(arrs)
this.myChart.setOption({
series,
})
},
setHistoryLine(list = []) {
//设置历史航线、历史海运线
const arrs = []
console.log(list, 'list')
list.forEach((v) => {
const {
dataType = 1,
value = [],
geoName = '历史空运',
curveness = 0,
period = 5,
orderList = [],
lang = 'zh',
} = v,
lineColor = dataType == 1 ? 'rgba(255,165,0, 0.5)' : 'rgba(255,165,0, 0.5)',
polyline = dataType == 1 ? false : true,
data = [
{
type: dataType,
coords: value,
lang: lang,
list: orderList,
},
]
console.log(data)
arrs.push({
name: geoName,
type: 'lines',
zlevel: 2,
symbol: 'none',
polyline: polyline,
effect: {
show: true,
color: 'rgba(221, 92, 117, 1)',
period: period, //箭头指向速度,值越小速度越快
trailLength: 0.1, //特效尾迹长度[0,1]值越大,尾迹越长重
symbol: 'arrow', //箭头图标,'circle', 'rect', 'roundRect', 'triangle', 'diamond', 'pin', 'arrow', 'none'
symbolSize: 4, //图标大小,
},
lineStyle: {
normal: {
width: 1, //尾迹线条宽度
// opacity: 0.3, //尾迹线条透明度
curveness: curveness, //尾迹线条曲直度
color: lineColor,
},
},
data,
})
})
const series = this.myChart.getOption().series.concat(arrs)
console.log(series)
this.myChart.setOption({
series,
})
},
setPosition(list = []) {
// 设置飞机的坐标点和船舶的坐标点
const arrs = []
list.forEach((v) => {
const {
dataType = 1,
value = [],
rotate = 0,
geoName = '空运',
symbol = imgsky,
orderList = [],
lang = 'zh',
} = v,
data = [
{
type: dataType,
symbolRotate: rotate,
value: value.concat(100),
symbol: symbol,
symbolSize: 20,
lang: lang,
list: orderList,
tipzoom: 1, //气泡显示
},
]
arrs.push({
name: geoName,
type: 'effectScatter',
coordinateSystem: 'geo',
zlevel: 3,
rippleEffect: {
//涟漪特效
period: 0, //动画时间,值越小速度越快
brushType: 'fill', //波纹绘制方式 stroke, fill
scale: 1, //波纹圆环最大限制,值越大波纹越大
color: '#fff',
},
itemStyle: {
normal: {
textStyle: {
color: '#fff',
},
},
},
data,
})
})
const series = this.myChart.getOption().series.concat(arrs)
console.log(series, '坐标点')
this.myChart.setOption({
series,
})
},
setAround(list = []) {
//设置地图拾取器边线
console.log(list)
const arrs = []
list.forEach((v) => {
const { dataType = 1, value = [] } = v,
lineColor = 'rgba(80, 249, 252, 1)',
data = [
{
// type: dataType,
coords: value,
},
]
console.log(data, 'data')
arrs.push({
name: '四周',
type: 'lines',
zlevel: 3,
symbol: 'none',
lineStyle: {
normal: {
width: 2, //尾迹线条宽度
// opacity: 0.3, //尾迹线条透明度
curveness: 0, //尾迹线条曲直度
color: '#fff',
},
},
data,
})
})
const series = this.myChart.getOption().series.concat(arrs)
this.myChart.setOption({
series,
})
},
handleDetail: function (record, type) {
const obj = {
id: record,
},
modalForm = this.$refs[`modalForm${type}`]
this.form = type
if (type && modalForm) {
modalForm.edit(obj, type)
modalForm.title = '详情'
modalForm.disableSubmit = true
}
},
},
}
</script>
<style scoped>
#chart-panel {
position: absolute;
left: 0;
right: 0;
top: 0;
bottom: 0;
}
</style>补充:
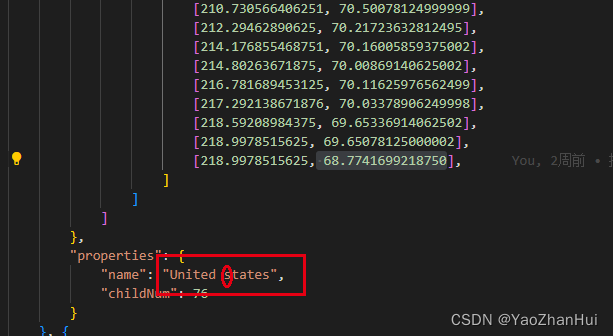
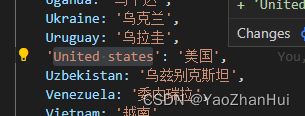
再把以中国为中心的地图的name 都改成中文后,发现唯一的美国会显示在原来的位置,问题查找了很久没有找到,最后只能把美国 改为小写,如果遇到相同问题可以这样做一下。
如果哪位兄台有相同问题,找到原因的可以私聊告诉我一下,感谢!


 3328
3328


 被折叠的 条评论
为什么被折叠?
被折叠的 条评论
为什么被折叠?
 到【灌水乐园】发言


