


一、监控服务器本地资源【内存、负载、磁盘等】
服务端IP:192.168.26.136
客户端IP:192.168.26.137
具体操作(下面136):
1.1 监控客户端服务器磁盘分区,load负载,内存,swap,磁盘IO 【被动模式】
1.2 hosts.cfg添加要监控的客户端主机和主机组
在服务端136 操作,在hosts.cfg添加要监控的客户端主机和主机组 (HOST GROUP)
备份一下
cd /usr/local/nagios/etc/
cp -a objects objects.ori
vim /usr/local/nagios/etc/objects/hosts.cfg
define host{
use linux-server ; Name of host template to use
host_name 137-lnmp-1
alias 137-lnmp-1
address 192.168.26.137
check_command check-host-alive
max_check_attpemts 3
normal_check_interval 2
retry_check_interval 2
check_period 24x7
notification_interval 300
notification_period 24x7
notification_options d,u,r
contact_groups admins
process_perf_data 1
}
# HOST GROUP DEFINITION
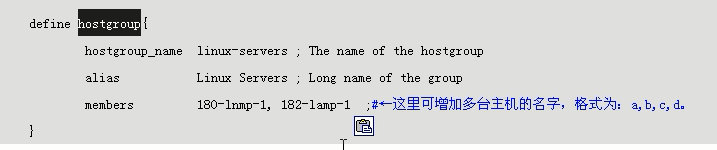
define hostgroup{
hostgroup_name linux-servers ; The name of the hostgroup
alias Linux Servers ; Long name of the group
members 137-lnmp-1 ; Comma separated list of hosts that belong to this group
}
1.3 添加要监控的服务配置到services.cfg
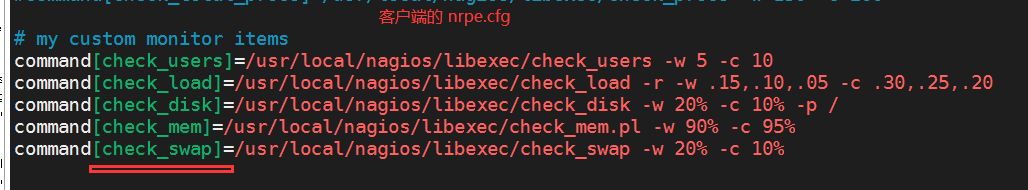
被动模式 check_nrpe!check_load ,对应的是客户端的 nrpe.cfg的command[check_load]
客户端的 /usr/local/nagios/etc/nrpe.cfg
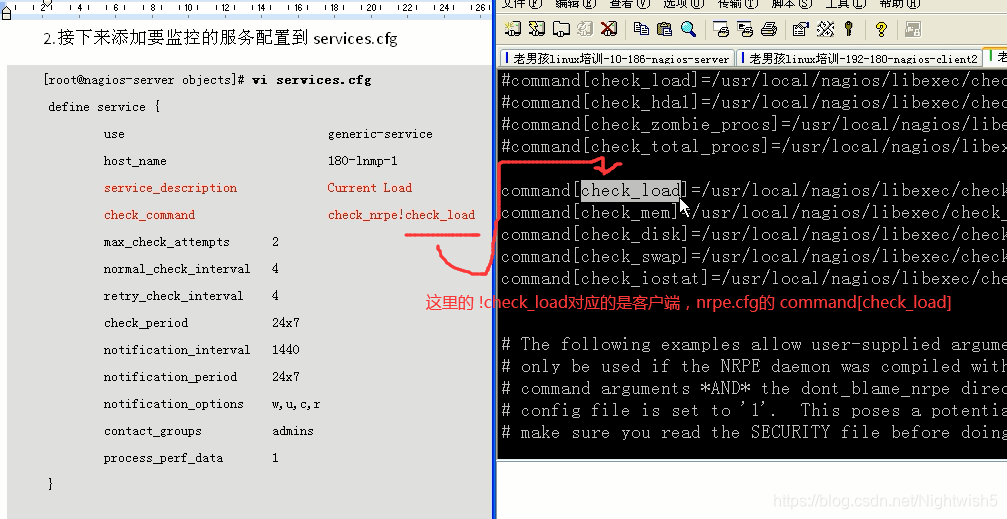


vim /usr/local/nagios/etc/objects/services.cfg
(check_load,check_mem,check_swap,check_disk,check_load)
他们每个service的差异点在 service_description 和 check_command 。 其他的几乎一样
define service{
       use                     generic-service
       host_name               137-lnmp-1
       service_description     Current Load
       check_command           check_nrpe!check_load
       max_check_attempts      2
       normal_check_interval   4
       retry_check_interval    4
       check_period            24x7
       notification_interval   1440
       notification_period     24x7
       notification_options    w,u,c,r
       contact_groups          admins
       process_perf_data       1
}

define service{
       use                     generic-service
       host_name               137-lnmp-1
       service_description     MEM Useage
       check_command           check_nrpe!check_mem
       max_check_attempts      2
       normal_check_interval   4
       retry_check_interval    4
       check_period            24x7
       notification_interval   1440
       notification_period     24x7
       notification_options    w,u,c,r
       contact_groups          admins
       process_perf_data       1
}


define service{
       use                     generic-service
       host_name               137-lnmp-1
       service_description     Swap Useage
       check_command           check_nrpe!check_swap
       max_check_attempts      10
       normal_check_interval   3
       retry_check_interval    4
       check_period            24x7
       notification_interval   480
       notification_period     workhours
       notification_options    w,u,c,r
       contact_groups          admins
       process_perf_data       1
}

define service{
       use                     generic-service
       host_name               137-lnmp-1
       service_description     Disk Partition
       check_command           check_nrpe!check_disk
       max_check_attempts      8
       normal_check_interval   4
       retry_check_interval    4
       check_period            24x7
       notification_interval   360
       notification_period     24x7
       notification_options    w,u,c,r
       contact_groups          admins
       process_perf_data       1
}

define service{
       use                     generic-service
       host_name               137-lnmp-1
       service_description     Disk Iostat
       check_command           check_nrpe!check_load!5!11 ;maybe it occur error,because it doesn't define and install the plugin
       max_check_attempts      2
       normal_check_interval   4
       retry_check_interval    4
       check_period            24x7
       notification_interval   1440
       notification_period     24x7
       notification_options    w,u,c,r
       contact_groups          admins
       process_perf_data       1
}
nagios语法检查
/usr/local/nagios/bin/nagios -v /usr/local/nagios/etc/nagios.cfg
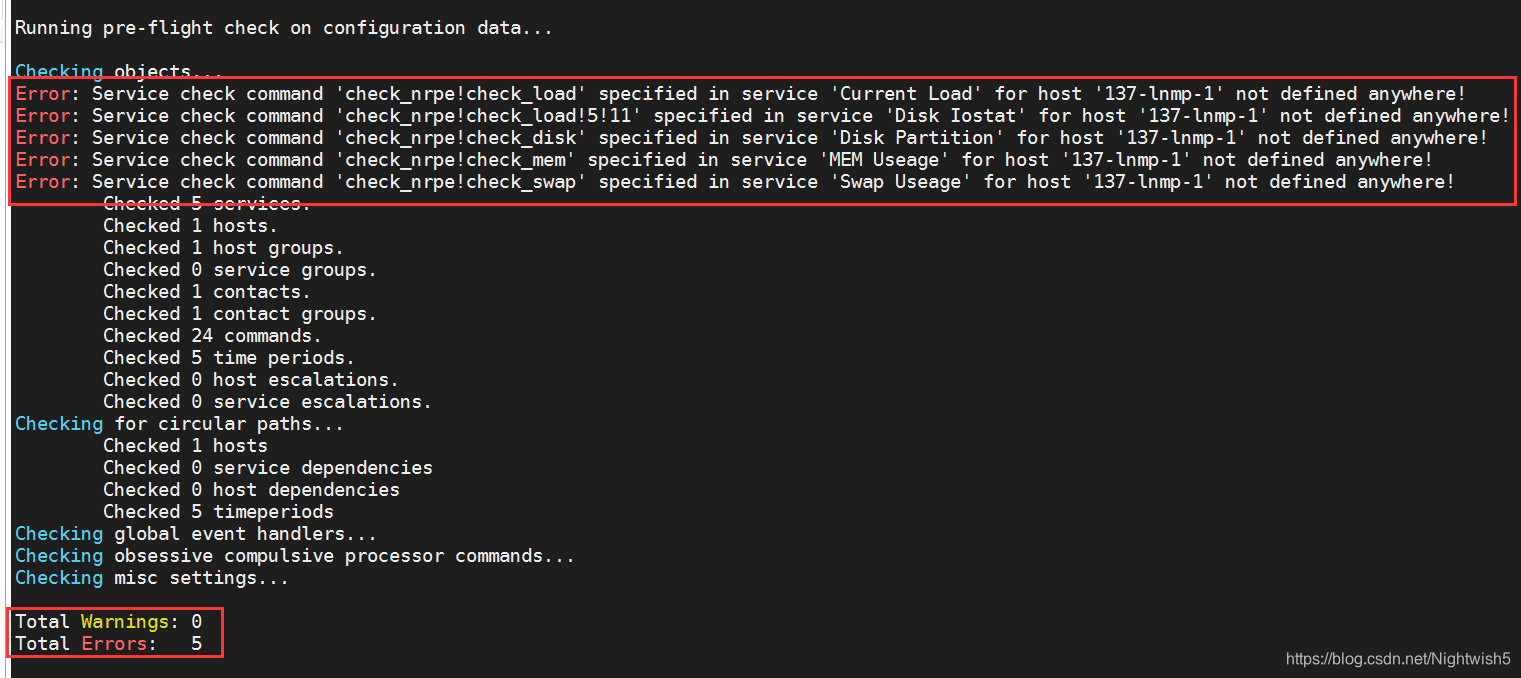
对于这个报错,services.cfg里面的check_nrpe!xxxxx 这个需要在command.cfg定义,处理方式:
vim /usr/local/nagios/etc/objects/commands.cfg 切到末尾进行定义。大致意思是使用
U
S
E
R
1
USER1
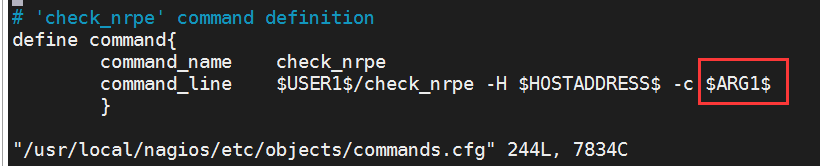
USER1 就是 /usr/local/nagios/libexec 路径下的check_nrpe,-H 远程IP ,-c 远程命令。
# 'check_nrpe' command definition
define command{
        command_name    check_nrpe
        command_line    $USER1$/check_nrpe -H $HOSTADDRESS$ -c $ARG1$
        }
然后再次检查语法。
/etc/init.d/nagios checkconfig
/etc/init.d/nagios reload
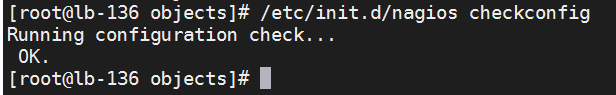
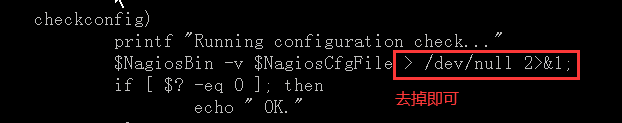
值得注意的是,这里没提示具体错误和警告的数量,只有个OK,可对其源码进行修改:
vim /etc/init.d/nagios +177 (新版本好像不是改这里了,代码已经变了)
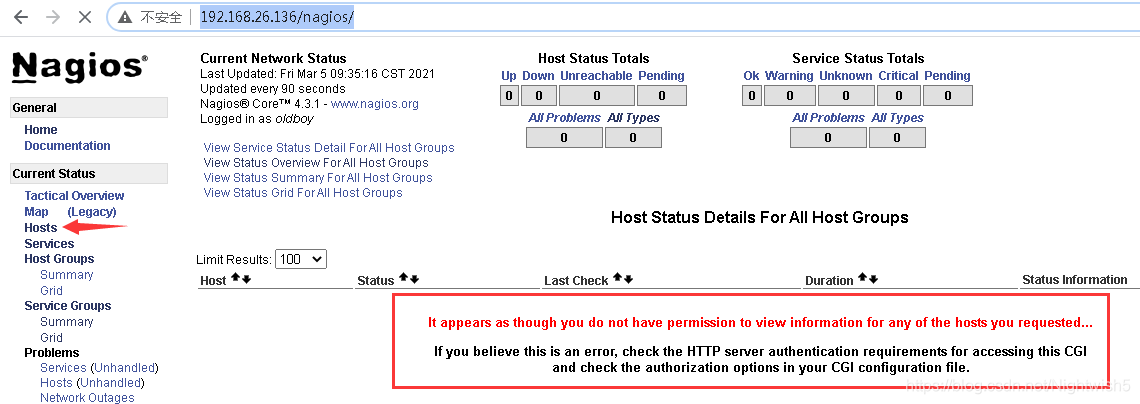
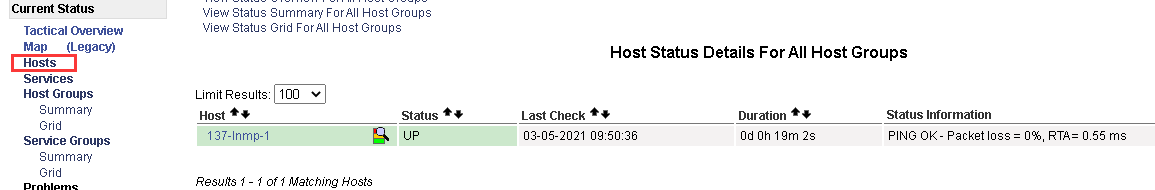
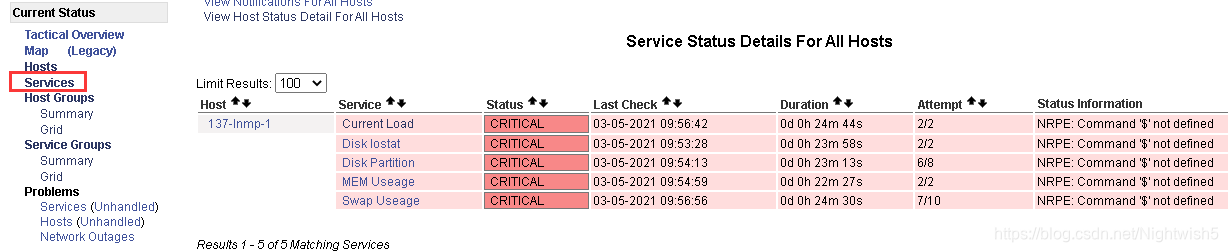
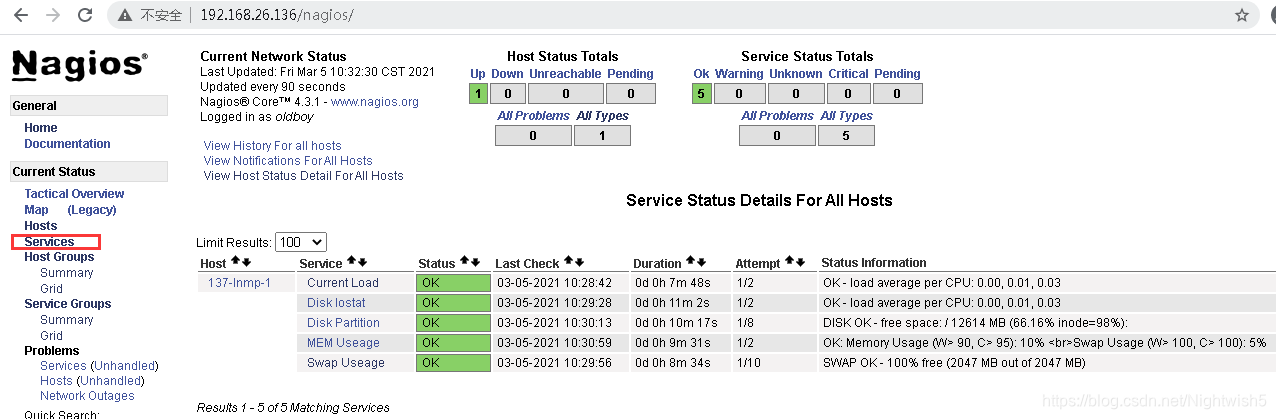
此时访问http://192.168.26.136/nagios/
It appears as though you do not have permission to view information for any of the hosts you requested...
If you believe this is an error, check the HTTP server authentication requirements for accessing this CGI
and check the authorization options in your CGI configuration file.
处理方法:https://www.cnblogs.com/5201351/p/4330204.html
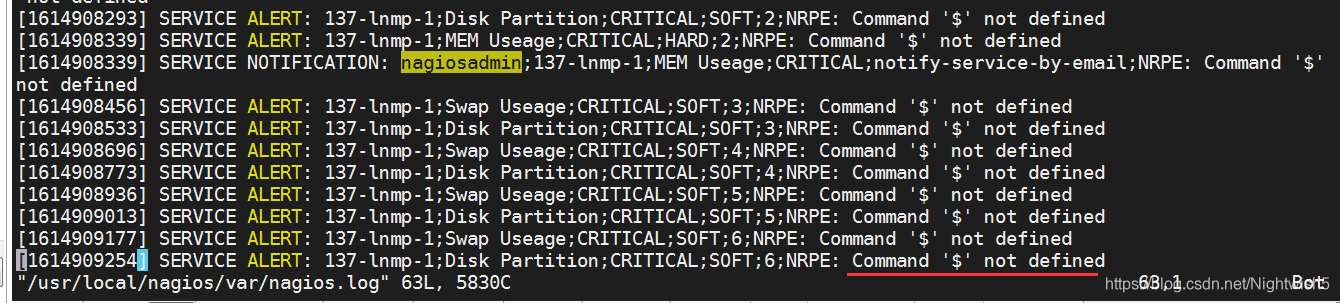
看日志: /usr/local/nagios/var/nagios.log
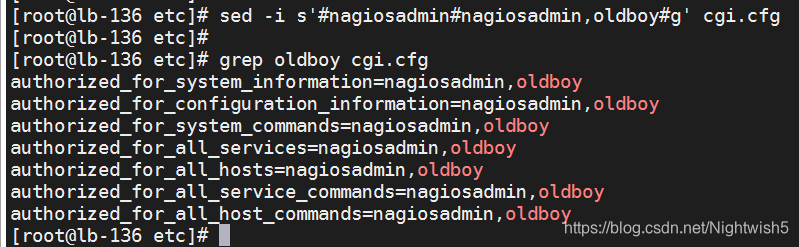
cp cgi.cfg cgi.cfg.ori
#vim /usr/local/nagios/etc/cgi.cfg
sed -i s'#nagiosadmin#nagiosadmin,oldboy#g' cgi.cfg
But:
个byd ,原因是打错字了。
原error: commands.cfg
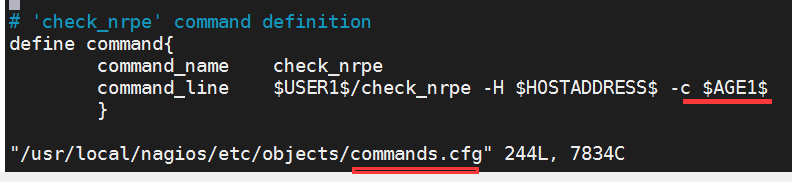
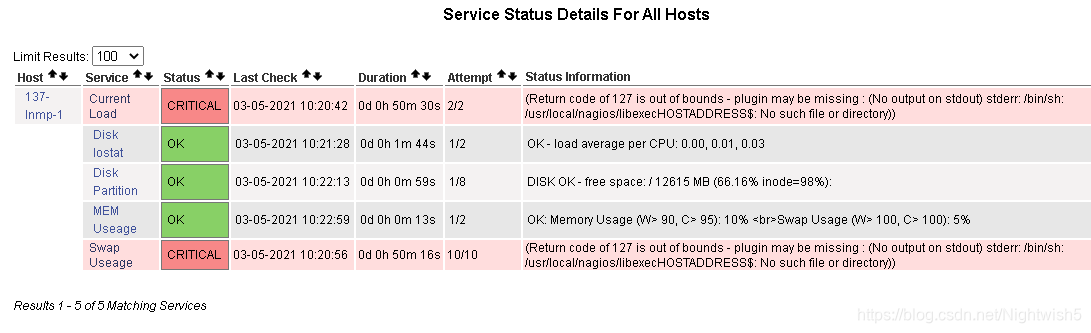
正确的参数配置是:
在之后是另一个报错,但是过了几分钟它自动好了。。。
配置小结:
0、nagios.cfg最初的设置要引用的cfg
1、 hosts.cfg添加要监控的客户端主机和主机组
2、添加要监控的服务配置到services.cfg ,比如(check_load,check_mem,check_swap,check_disk,check_load)
3、检查 commands.cfg ,定义command
4、修改cgi.cfg的 授权权限
5、nrpe.cfg修改 command[check_users] 这语句
二、通过URL及端口方式监控客户端主机提供的服务
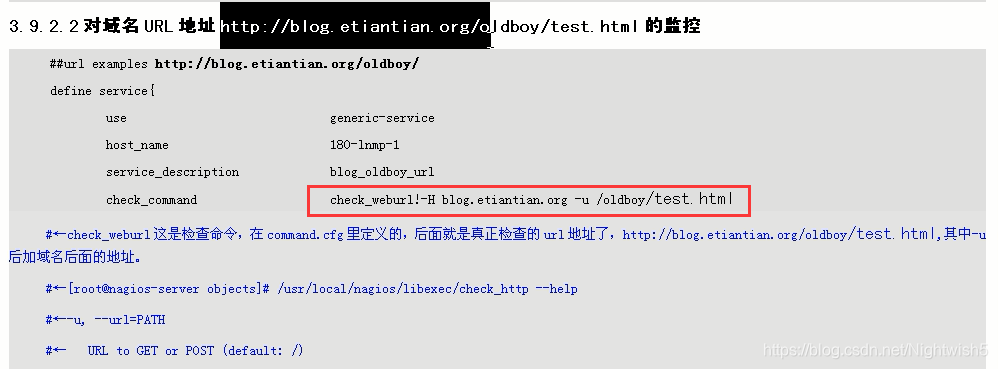
2.1 对域名URL地址https://www.baidu.com的监控
在services.cfg添加监控的服务配置
服务端136 (server端)操作
vim /usr/local/nagios/etc/objects/services.cfg
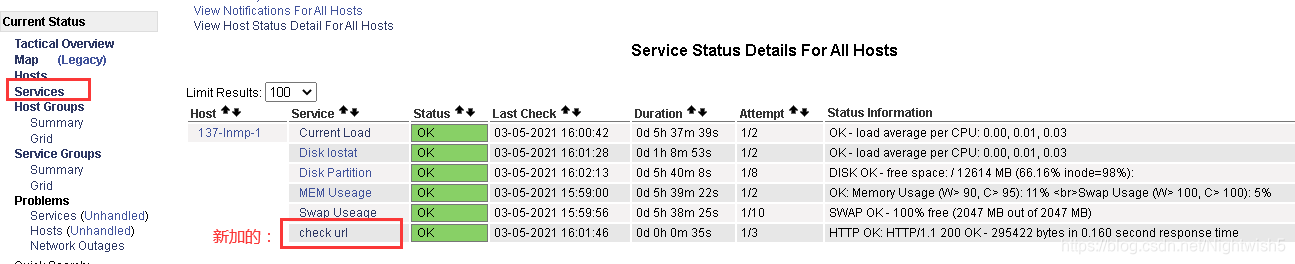
#check url
define service{
use generic-service
host_name 137-lnmp-1
service_description check url
check_command check_weburl!-H www.baidu.com
max_check_attempts 3
normal_check_interval 2
retry_check_interval 1
check_period 24x7
notification_interval 60
notification_period 24x7
notification_options w,u,c,r
contact_groups admins
process_perf_data 1
}
/etc/init.d/nagios checkconfig
报错:
Error: Service check command 'check_weburl!-H www.baidu.com' specified in service 'check url' for host '137-lnmp-1' not defined anywhere!
处理: vim /usr/local/nagios/etc/objects/commands.cfg 末尾加上
# 'check_url' command definition
define command{
        command_name    check_weburl
        command_line    $USER1$/check_http $ARG1$ -w 10 -c 30
        }
/etc/init.d/nagios checkconfig
/etc/init.d/nagios reload
此时就有有个新的check_url
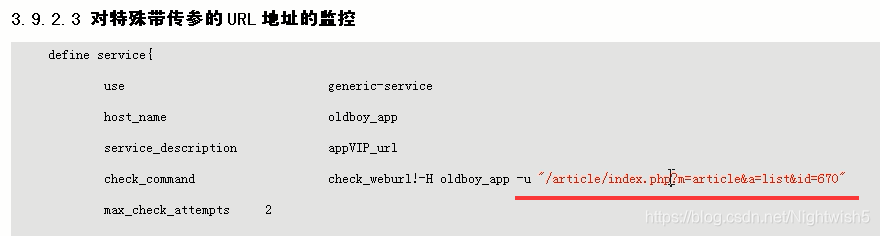
2.2 对域名URL(带参数的):https://xueshu.baidu.com/usercenter/paper/show?paperid=170f06907p7h0ja0bg330af0wt377801进行监控
在services.cfg添加监控的服务配置
#check url :xueshu.baidu.com/usercenter/paper/show?paperid=170f06907p7h0ja0bg330af0wt377801
define service{
       use                     generic-service
       host_name               137-lnmp-1
       service_description     check url with uri
       check_command           check_weburl!-H xueshu.baidu.com -u /usercenter/paper/show?paperid=170f06907p7h0ja0bg330af0wt377801
       max_check_attempts      3
       normal_check_interval   2
       retry_check_interval    1
       check_period            24x7
       notification_interval   60
       notification_period     24x7
       notification_options    w,u,c,r
       contact_groups          admins
       process_perf_data       1
}
/etc/init.d/nagios checkconfig
/etc/init.d/nagios reload
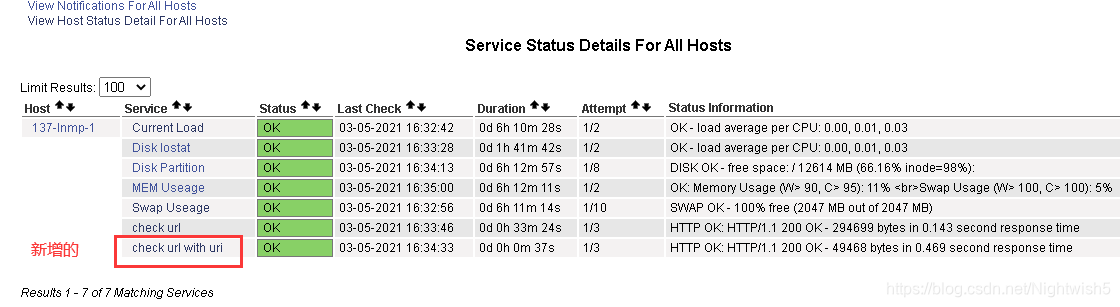
url地址的也是类似:
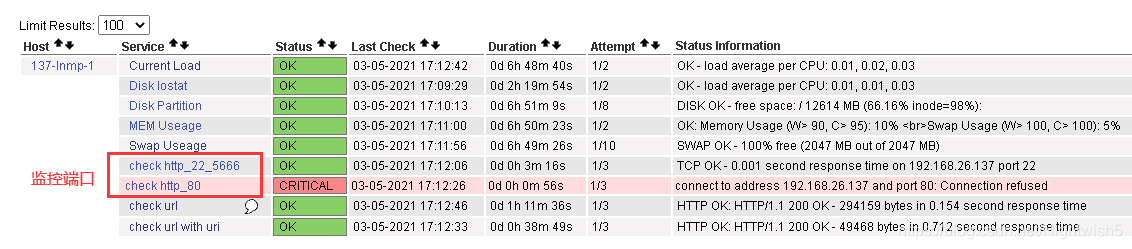
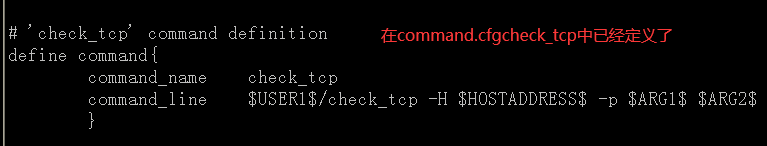
2.3 监控任意端口,如80,8080,22,25等
vim /usr/local/nagios/etc/objects/services.cfg
#check port 22,5666
define service{
       use                     generic-service
       host_name               137-lnmp-1
       service_description     check http_22_5666
       check_command           check_tcp!22!5666
       max_check_attempts      3
       normal_check_interval   2
       retry_check_interval    1
       check_period            24x7
       notification_interval   60
       notification_period     24x7
       notification_options    w,u,c,r
       contact_groups          admins
       process_perf_data       1
}

#check port 80
define service{
       use                     generic-service
       host_name               137-lnmp-1
       service_description     check http_80
       check_command           check_tcp!80
       max_check_attempts      3
       normal_check_interval   2
       retry_check_interval    1
       check_period            24x7
       notification_interval   60
       notification_period     24x7
       notification_options    w,u,c,r
       contact_groups          admins
       process_perf_data       1
}
192.168.26.137的监控80端口, 和监控22端口,5666端口
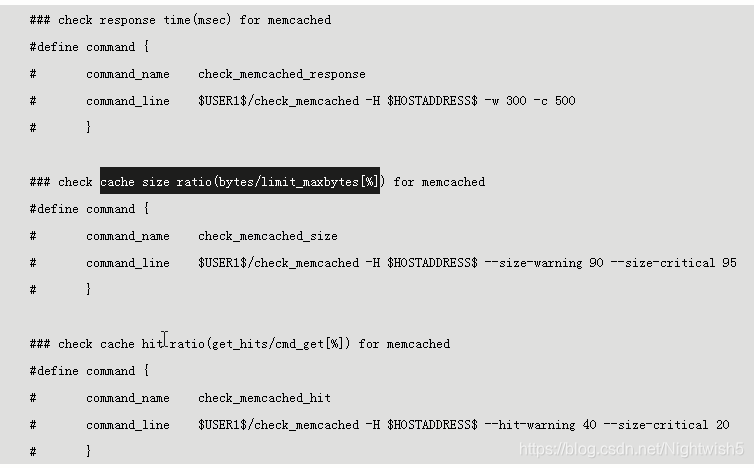
memcache监控 (略)

更多的:
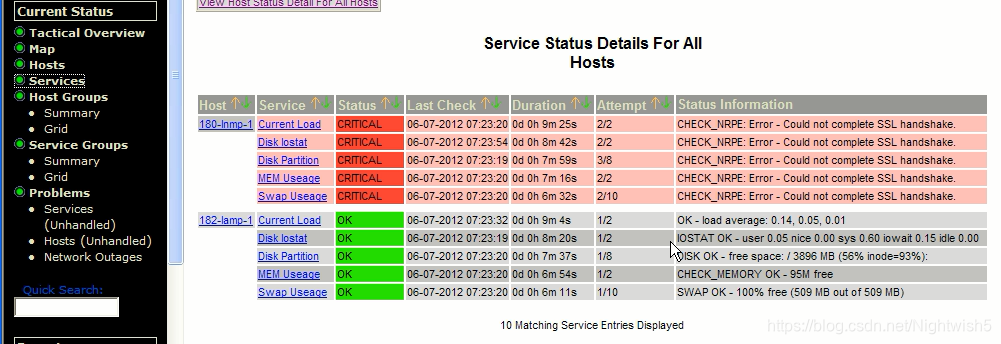
三、nagios排错思路
could not complete SSL handshake
client端操作(被监控端的)
1、关闭防火墙,selinux
2、检查nrpe 端口 netstat -naltp | grep 5666 。 服务端telnet 客户端的5666端口。
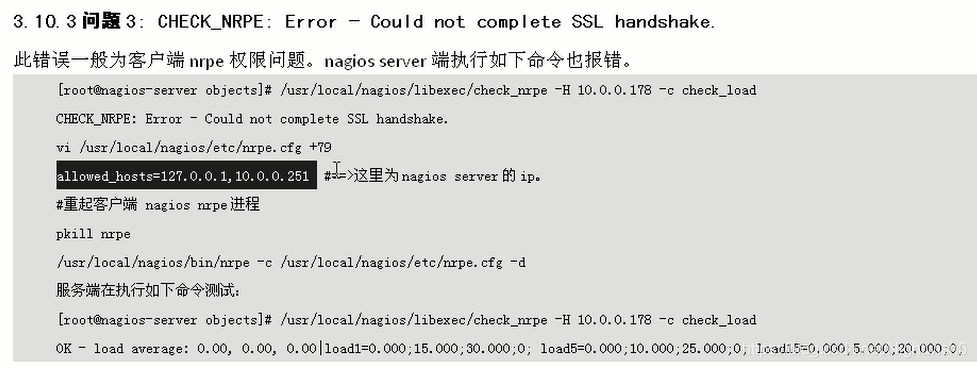
3、vim /usr/local/nagios/etc/nrpe.cfg 查看有没有加允许的主机
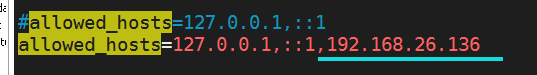
4、重启nrpe 。
ps -ef | grep nrpe
pkill nrpe
/usr/local/nagios/bin/nrpe -d -c /usr/local/nagios/etc/nrpe.cfg
check_nrpe!check_load
此时切到服务端操作(server),可参考 check_nrpe --help
cd /usr/local/nagios/libexec
./check_nrpe --help

[root@lb-136 libexec]# ./check_nrpe -H 192.168.26.137 -c check_load
OK - load average per CPU: 0.00, 0.01, 0.03|load1=0.000;0.150;0.300;0; load5=0.015;0.100;0.250;0; load15=0.025;0.050;0.200;0;
换成客户端执行:
[root@memcache137 etc]# /usr/local/nagios/libexec/check_load -w 15,10,5 -c 30,25,20
OK - load average: 0.00, 0.02, 0.05|load1=0.000;15.000;30.000;0; load5=0.020;10.000;25.000;0; load15=0.050;5.000;20.000;0;
和
[root@memcache137 etc]# /usr/local/nagios/libexec/check_nrpe -H localhost -c check_load
OK - load average per CPU: 0.01, 0.02, 0.03|load1=0.005;0.150;0.300;0; load5=0.020;0.100;0.250;0; load15=0.025;0.050;0.200;0;
如果双方都OK,则表示脚本没问题,数据是行得通的。
分割线=
其他问题:
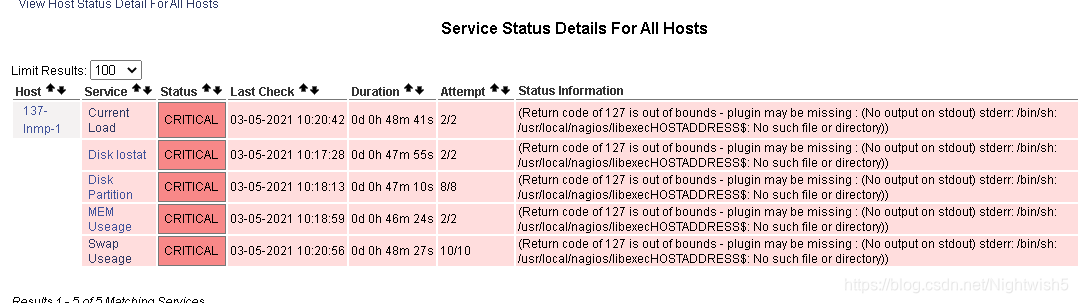
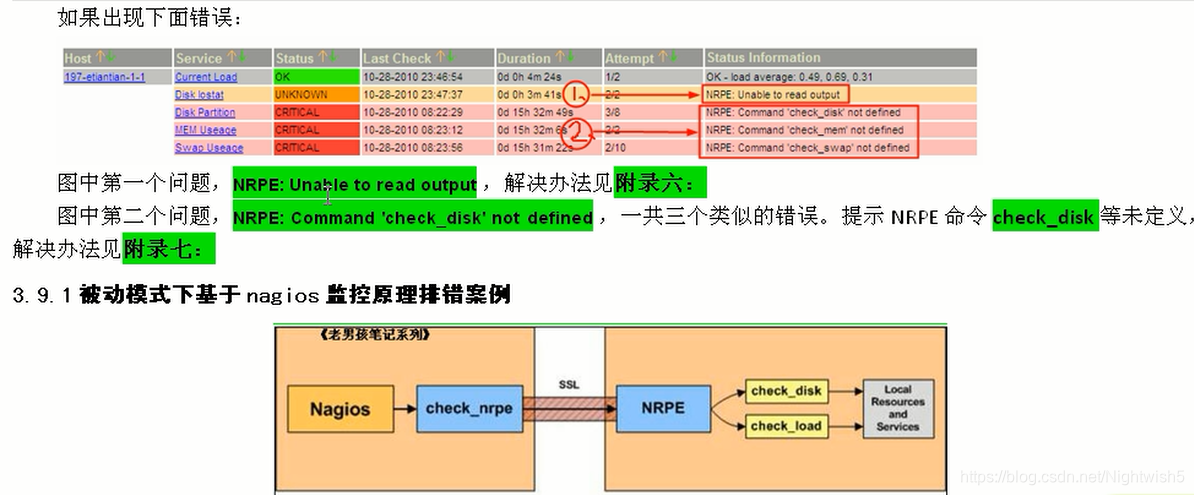
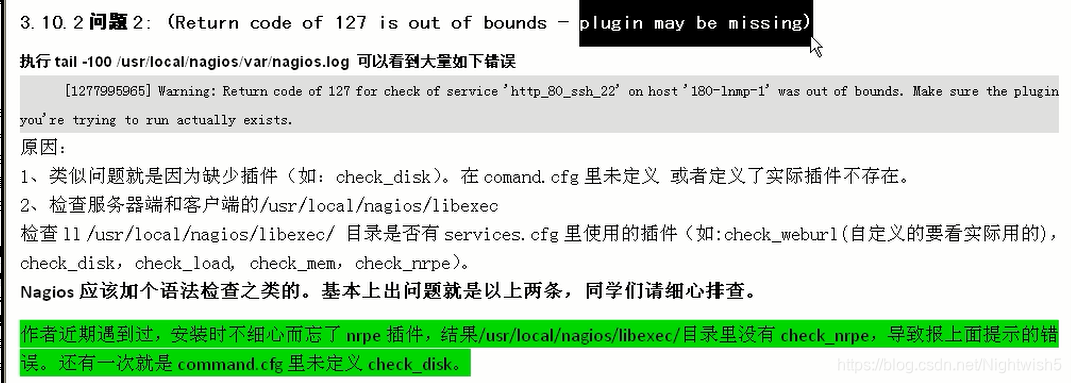
① .Return code of 127 is out of bounds - plugin may be missing
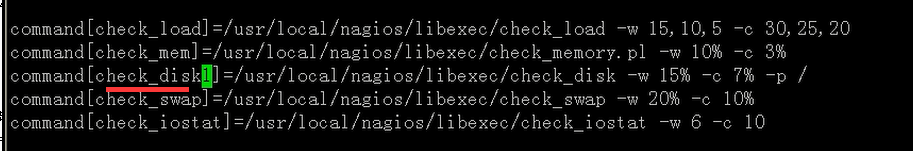
②NRPE:Command ‘check_disk’ not defined
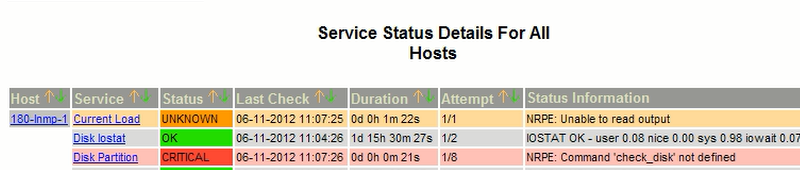
检查客户端client的 /usr/local/nagios/etc/nrpe.cfg的:
③ CHECK_NRPE: Error - Could not complete SSL handshake
END


 105
105


 被折叠的 条评论
为什么被折叠?
被折叠的 条评论
为什么被折叠?
 到【灌水乐园】发言


