


目的是在windows server安装监控 。
参考:https://www.cnblogs.com/guoxiangyue/p/11777227.html
一、每个export都有个固定默认端口,Windows的默认wmi-exporter端口为9182 。
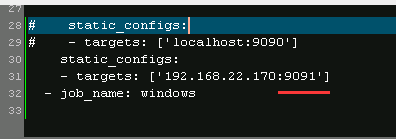
prometheus.yml 的对应配置要一 一对应,不要乱写。 否则target显示是down 。
(错误的配置导致的现象:
Get "http:/ /192.168.22.170:9091/metrics": dial tcp192.168.22.170:9091 : connectex: No connection could be made because the target machine actively refused it.

二、在创建data sources的URL指定的是prometheus的地址。
这里的prometheus地址跟之前启动命令相关联:
prometheus.exe --config.file=prometheus.yml --web.listen-address=:8900 &

(关于url的提示Your access method is Server, this means the URL needs to be accessible from the grafana backend/server.)
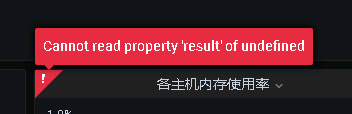
(当时写成了 192.168.22.170:9182 ,导致全报错。)


否则报错 “cannot read property ‘result’ of undefined ”


 4301
4301


 被折叠的 条评论
为什么被折叠?
被折叠的 条评论
为什么被折叠?
 到【灌水乐园】发言


