


1. 前言
在使用OceanBase过程中,当大家通过论坛的问答区或提交工单寻求支持时,往往需要花费大量时间在诊断信息的获取和沟通上。针对大家普遍感到困扰的SQL问题,今天我将为大家介绍如何一键收集诊断并行SQL/慢SQL问题所需的信息,减少沟通时间,让大家能够更早地下班。
2. 补充知识点-并行执行
关于并行执行的内容,大家可以参考以下博客。
| 一 | 并行执行概念 |
| 二 | 如何手动设置并行度 |
| 三 | 并行执行线程资源管理方式 |
| 四 | 并行执行的4种类别 |
| 五 | 并行执行参数的应用技巧 |
| 六 | 如何进行并行执行的诊断与调优 |
| 七 | 快速上手并行执行 |
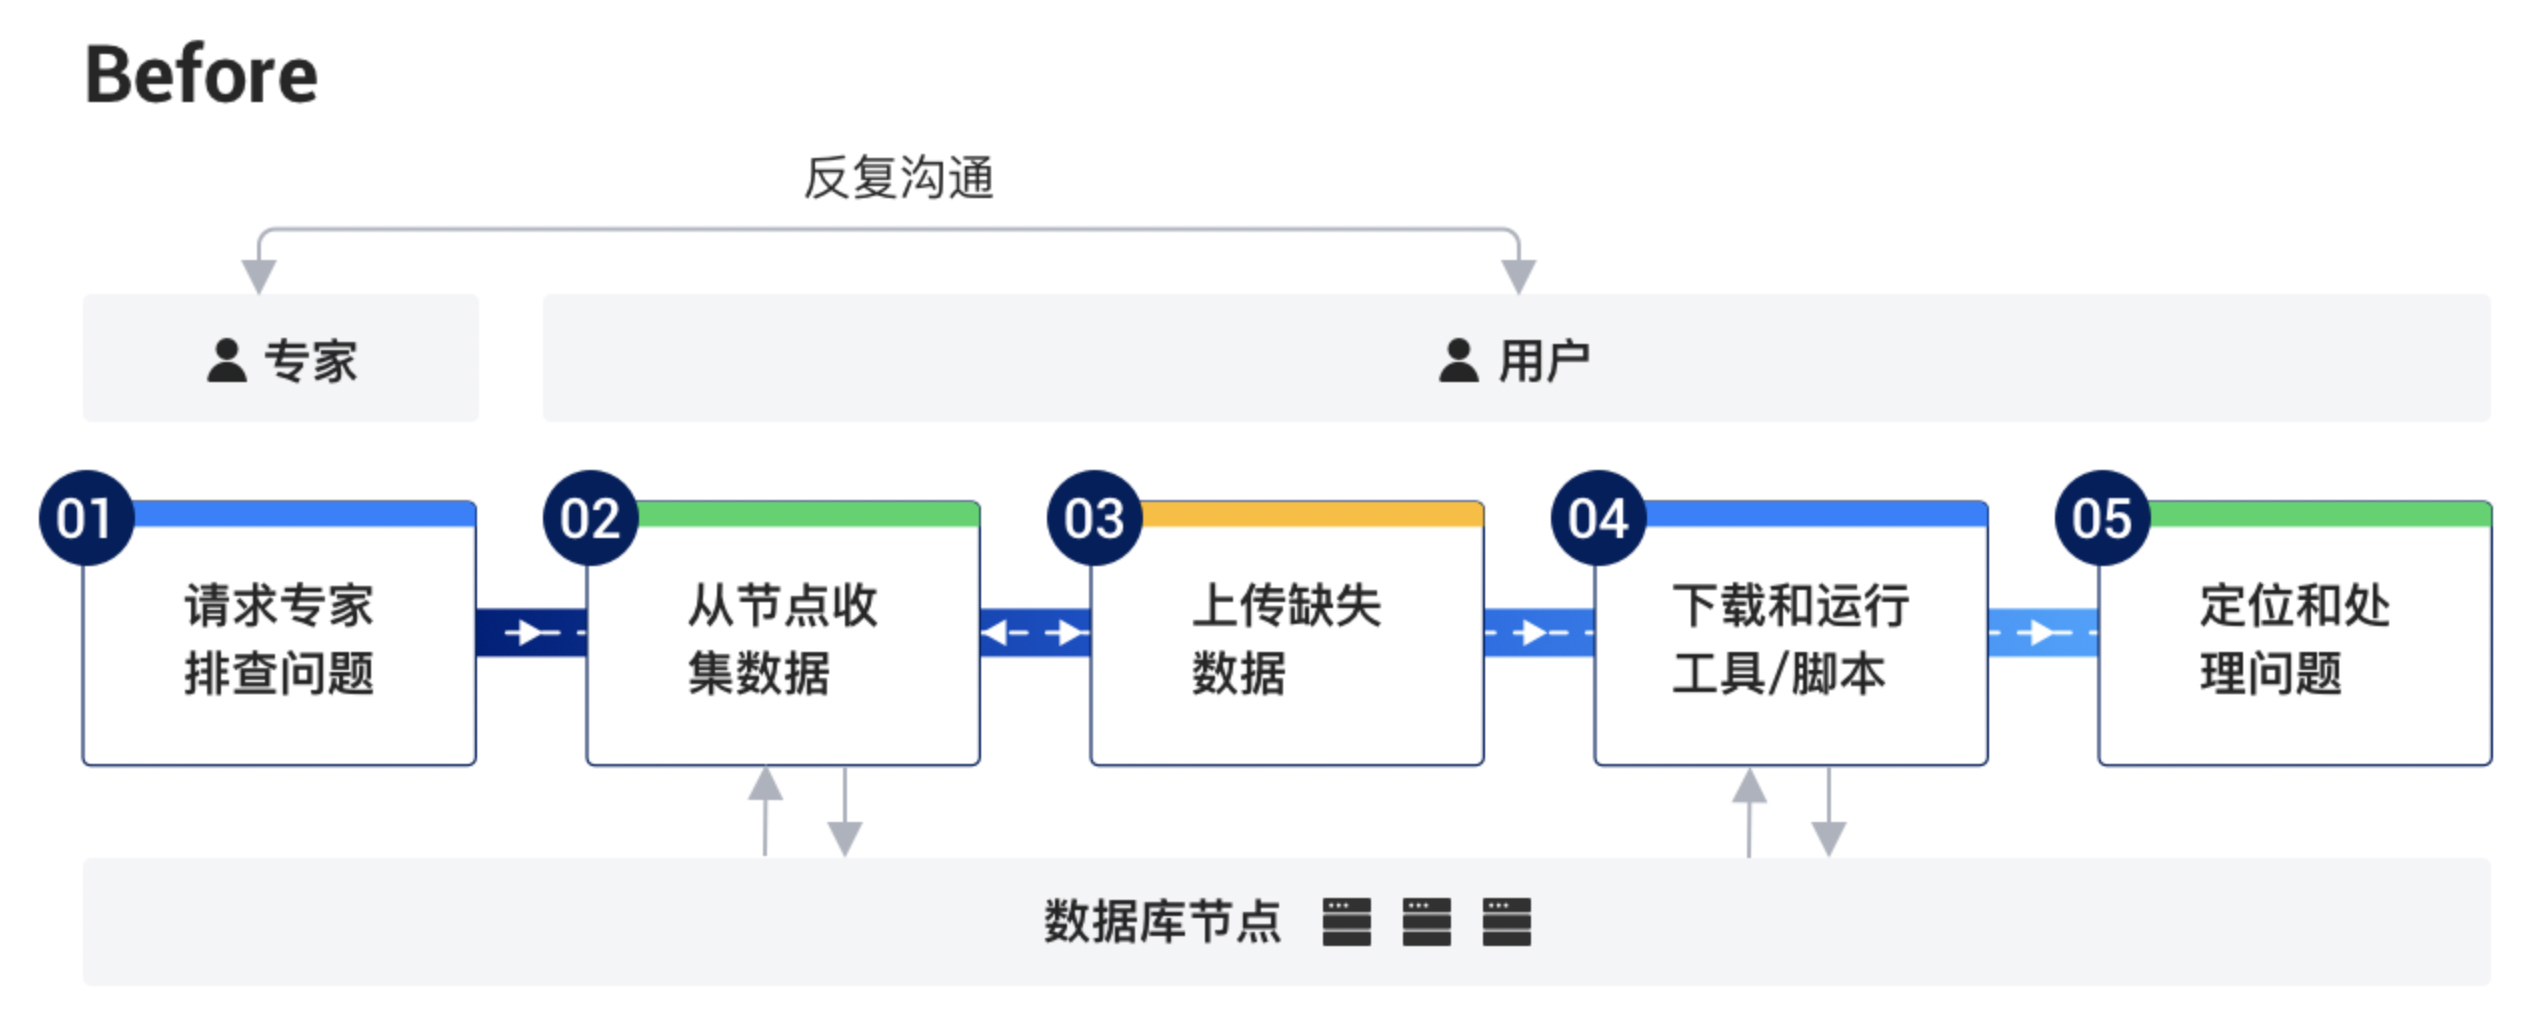
3. 一键收集并行SQL/慢SQL诊断信息
并行我们一般情况下遇到并行SQL问题排查不可避免的都会查如下信息:gv$ob_sql_audit、gv$ob_plan_cache_plan_stat、gv$ob_plan_cache_plan_explain、gv$sql_plan_monitor、explain extend SQL、trace_id相关的日志、统计信息。看完是不是很头大,到底怎么查,用哪些命令,查哪些东西,这些东西查晚一点还会被过期淘汰掉,头大。。。。。
别着急,往下看,obdiag 帮你搞定一键诊断信息收集。
3.1. 一键收集并行SQL/慢SQL诊断信息
步骤一:安装obdiag并配置被诊断集群信息(~/.obdiag/config.yml)
sudo yum install -y yum-utils
sudo yum-config-manager --add-repo https://mirrors.aliyun.com/oceanbase/OceanBase.repo
sudo yum install -y oceanbase-diagnostic-tool
source /usr/local/oceanbase-diagnostic-tool/init.sh

# 配置被诊断集群信息
obdiag config -hxx.xx.xx.xx -uroot@sys -Pxxxx -p*****步骤二:获取需要诊断的SQL的trace_id
从gv$ob_sql_audit中获取或者通过SELECT last_trace_id();获取
通过sql_audit中获取
select query_sql,trace_id from oceanbase.GV$OB_SQL_AUDIT where query_sql like 'xxx%' order by REQUEST_TIME desc limit 5;通过当前session执行SELECT last_trace_id();获取
SELECT last_trace_id();步骤三:一键诊断信息收集
obdiag gather plan_monitor [options]
选项说明如下:
| 选项名 | 是否必选 | 数据类型 | 默认值 | 说明 |
|---|---|---|---|---|
| --trace_id | 是 | string | 默认为空 | OceanBase 数据库 V4.0.0 以下版本可从 gv$sql_audit中查看 trace_id,OceanBase 数据库 V4.0.0 及以上版本可从 gv$ob_sql_audit中查看 trace_id。 |
| --store_dir | 否 | string | 默认为命令执行的当前路径 | 存储结果的本地路径。 |
| -c | 否 | string | ~/.obdiag/config.yml | 配置文件路径 |
| --env | 否 | string | 默认为空 | 要分析的 trace_id 涉及的 SQL 所在的业务租户的连接串,主要用于获取 explain SQL 报告的 |
说明
- 需要确保已经在 obdiag 配置文件
config.yml中配置好需要收集的集群sys连接信息。相关的详细配置介绍,参见 obdiag 配置。
示例:
obdiag gather plan_monitor --trace_id YB420BA2D99B-0005EBBFC45D5A00-0-0 --env "{db_connect='-hxx -Pxx -uxx -pxx -Dxx'}"

gather_plan_monitor start ...

Gather Sql Plan Monitor Summary:
+-----------+-----------+--------+-------------------------------------+
| Cluster   | Status    | Time   | PackPath                            |
+===========+===========+========+=====================================+
| obcluster | Completed | 2 s    | ./obdiag_gather_pack_20240611171324 |
+-----------+-----------+--------+-------------------------------------+
3.2. 举个例子
建测试表
create table game (round int primary key, team varchar(10), score int)
    partition by hash(round) partitions 3;

insert into game values (1, "CN", 4), (2, "CN", 5), (3, "JP", 3);
insert into game values (4, "CN", 4), (5, "US", 4), (6, "JP", 4);
执行并行SQL并获取trace_id
obclient [oceanbase]> select /*+ parallel(3) */ team, sum(score) total from game group by team;
+------+-------+
| team | total |
+------+-------+
| US   |     4 |
| CN   |    13 |
| JP   |     7 |
+------+-------+
3 rows in set (0.006 sec)

obclient [oceanbase]> SELECT last_trace_id();
+-----------------------------------+
| last_trace_id()                   |
+-----------------------------------+
| YF2A0BA2DA7E-000615B522FD3D35-0-0 |
+-----------------------------------+
1 row in set (0.000 sec)
一键诊断信息收集
obdiag gather plan_monitor --trace_id YB420BA2D99B-0005EBBFC45D5A00-0-0 --env "{db_connect='-hxx -Pxx -uxx -pxx -Dxx'}"
gather_plan_monitor start ...
Gather Sql Plan Monitor Summary:
+-----------+-----------+--------+-------------------------------------+
| Cluster | Status | Time | PackPath |
+===========+===========+========+=====================================+
| obcluster | Completed | 2 s | ./obdiag_gather_pack_20240611171324 |
+-----------+-----------+--------+-------------------------------------+
Trace ID: dade865c-27d2-11ef-bc35-cad6cd785756
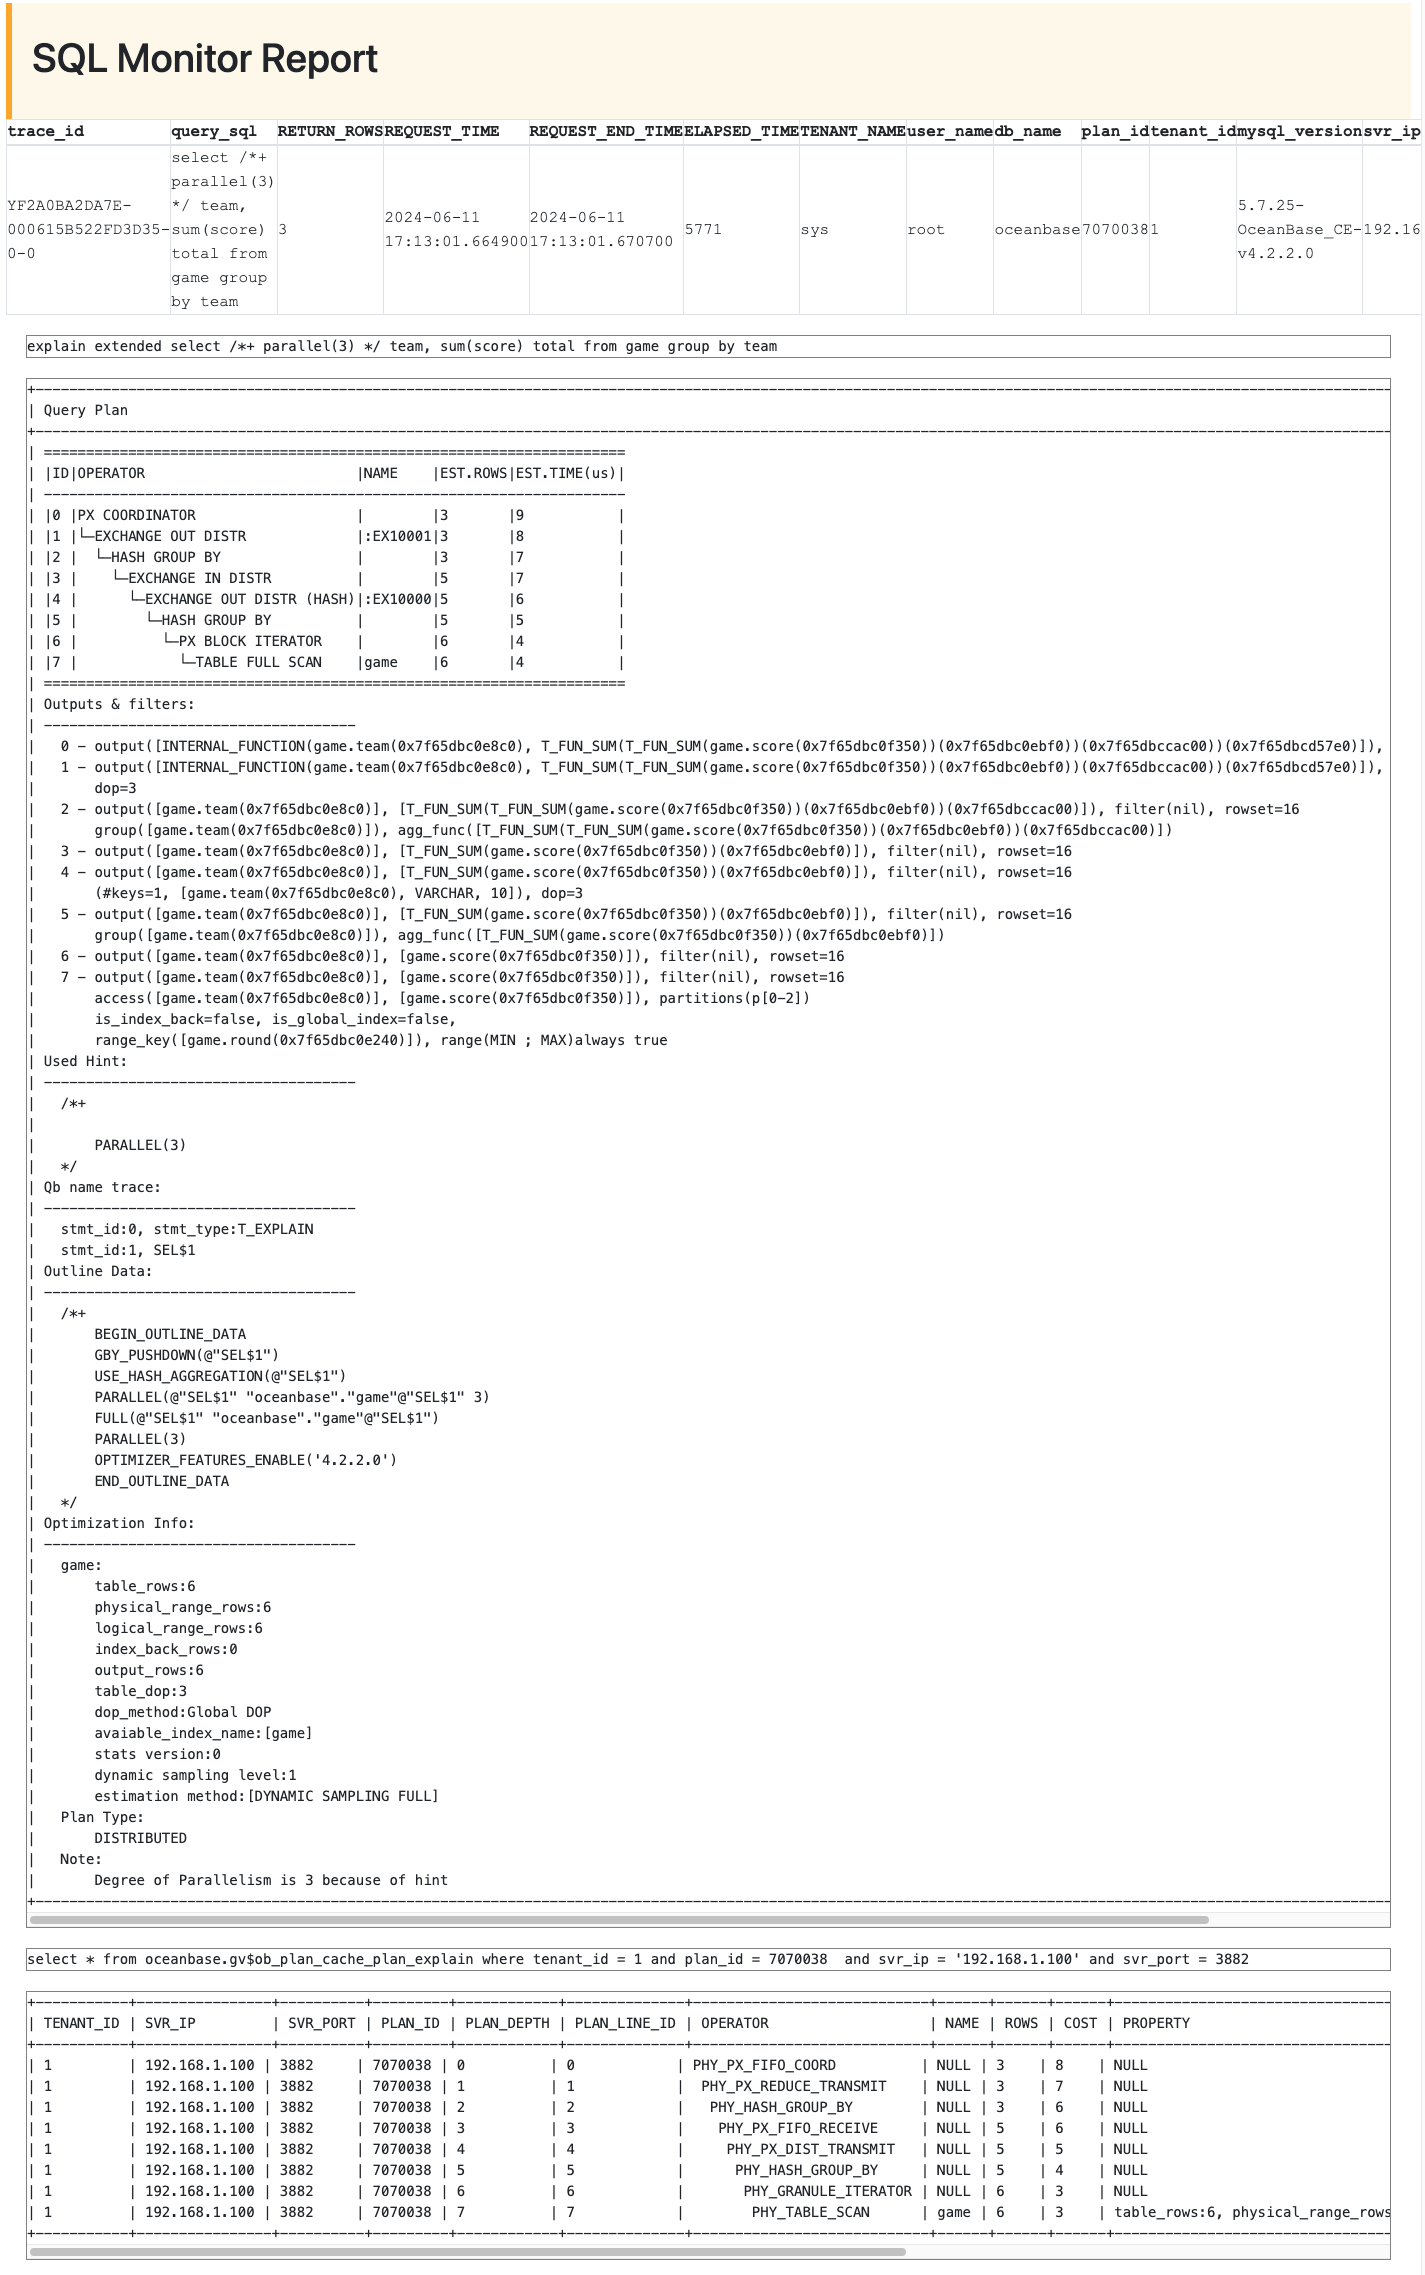
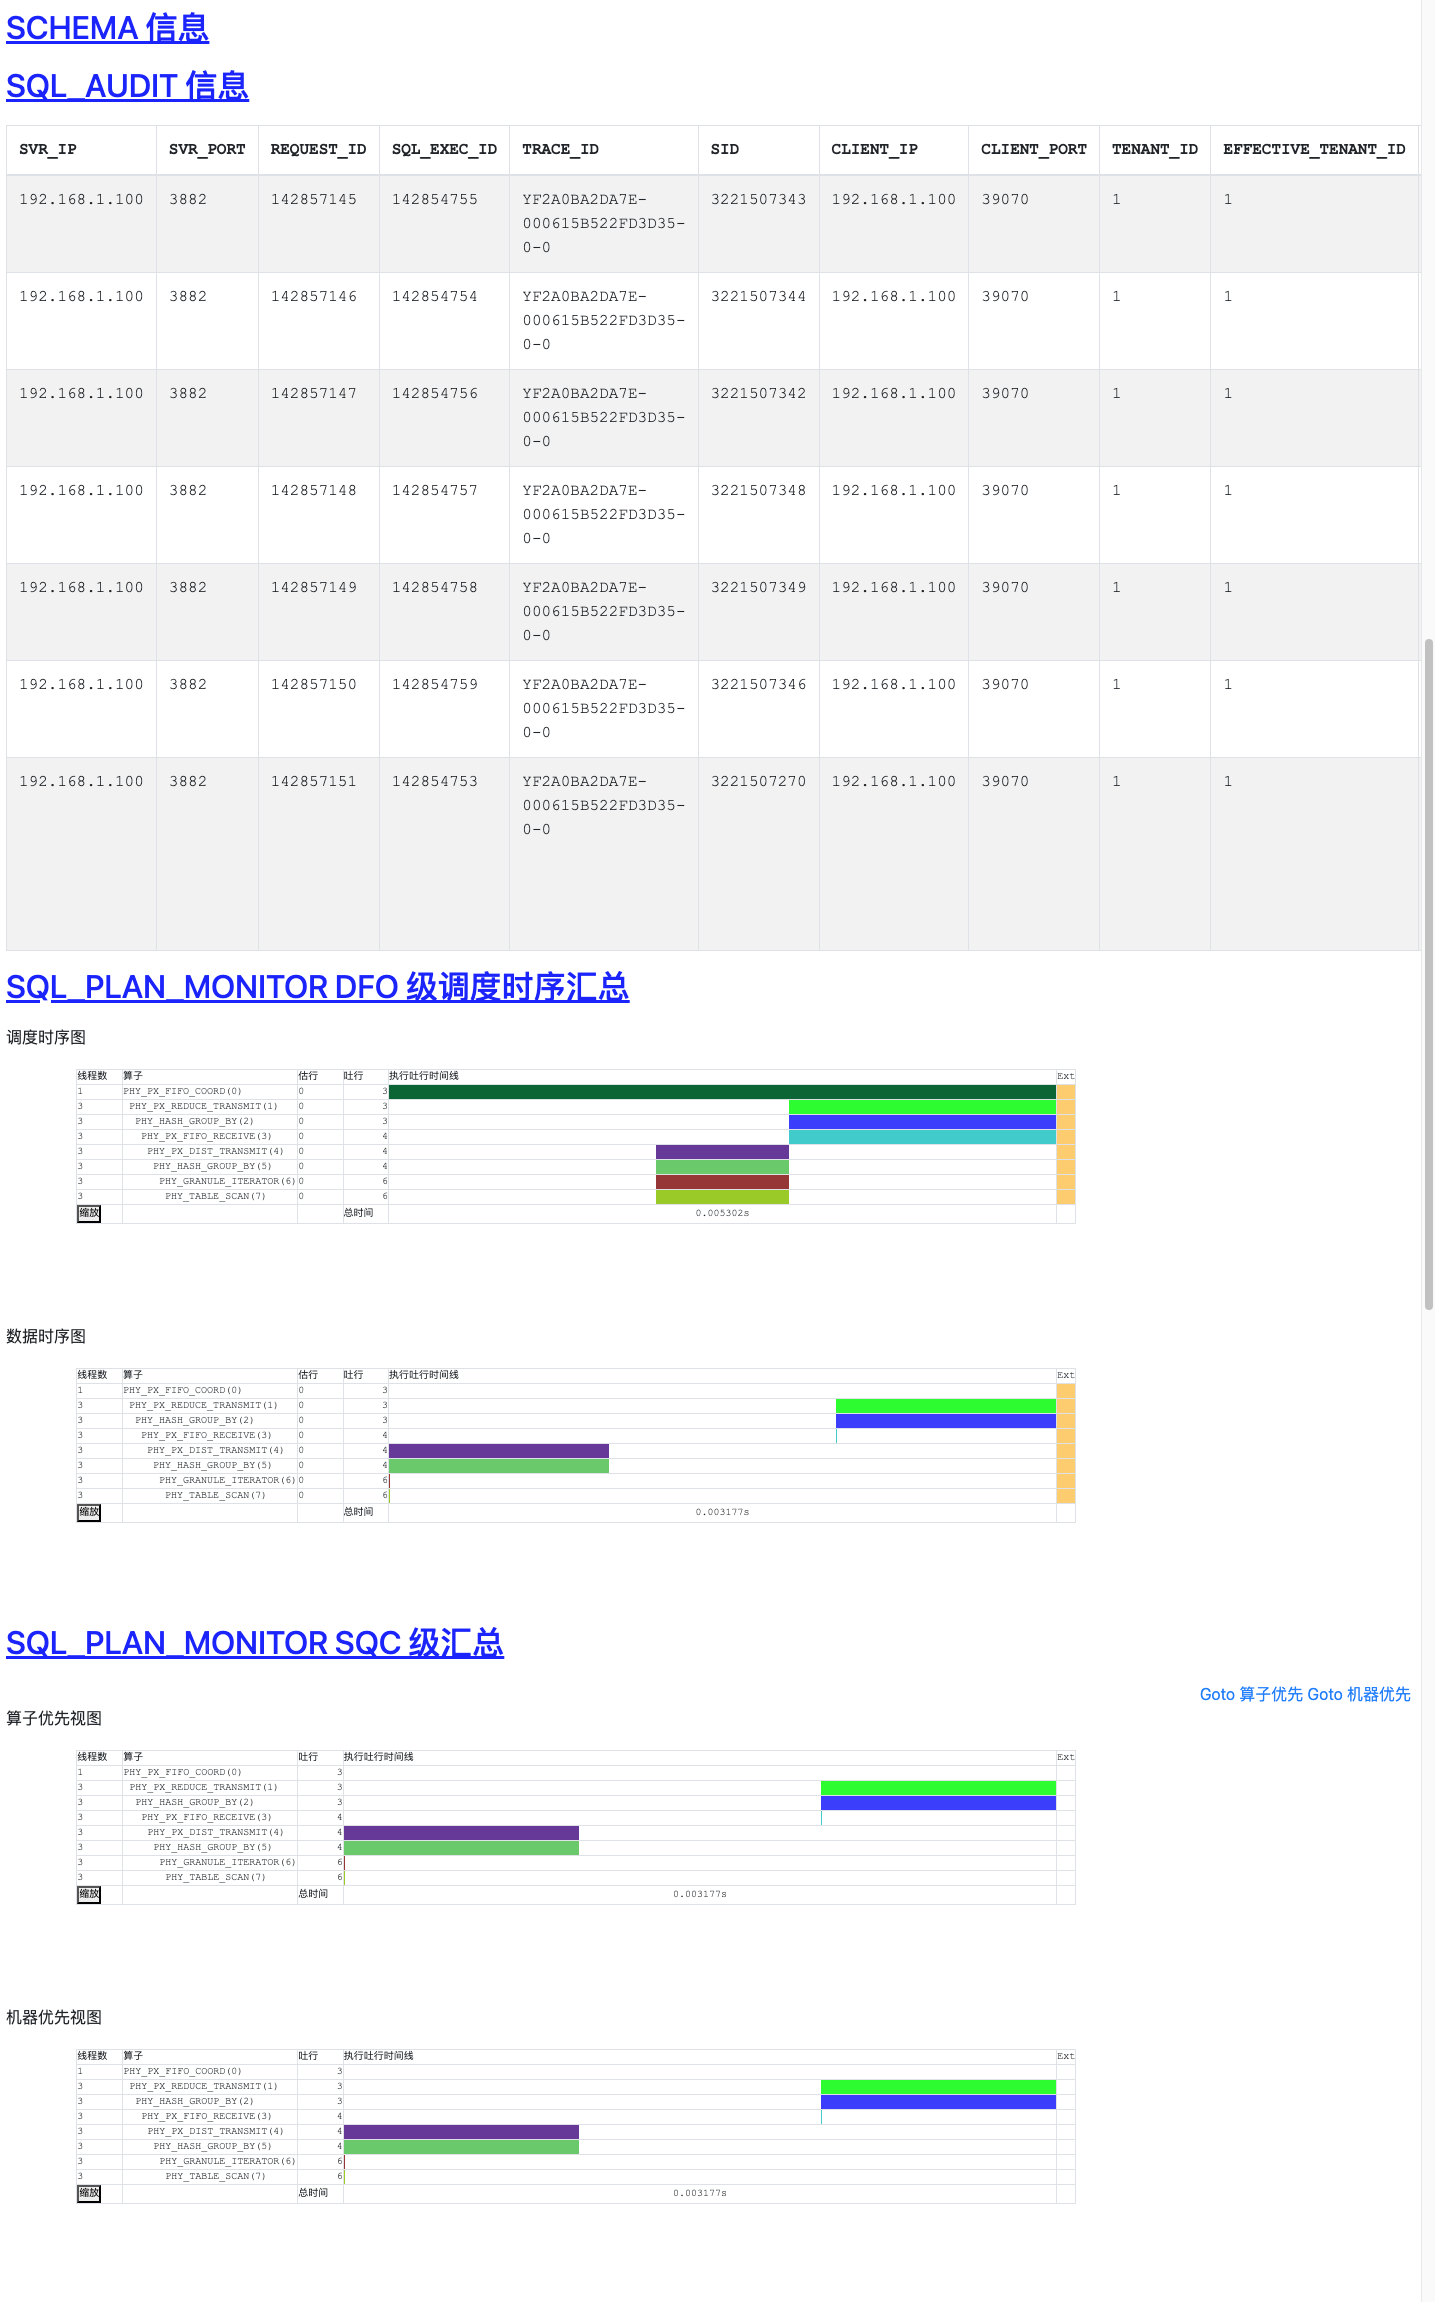
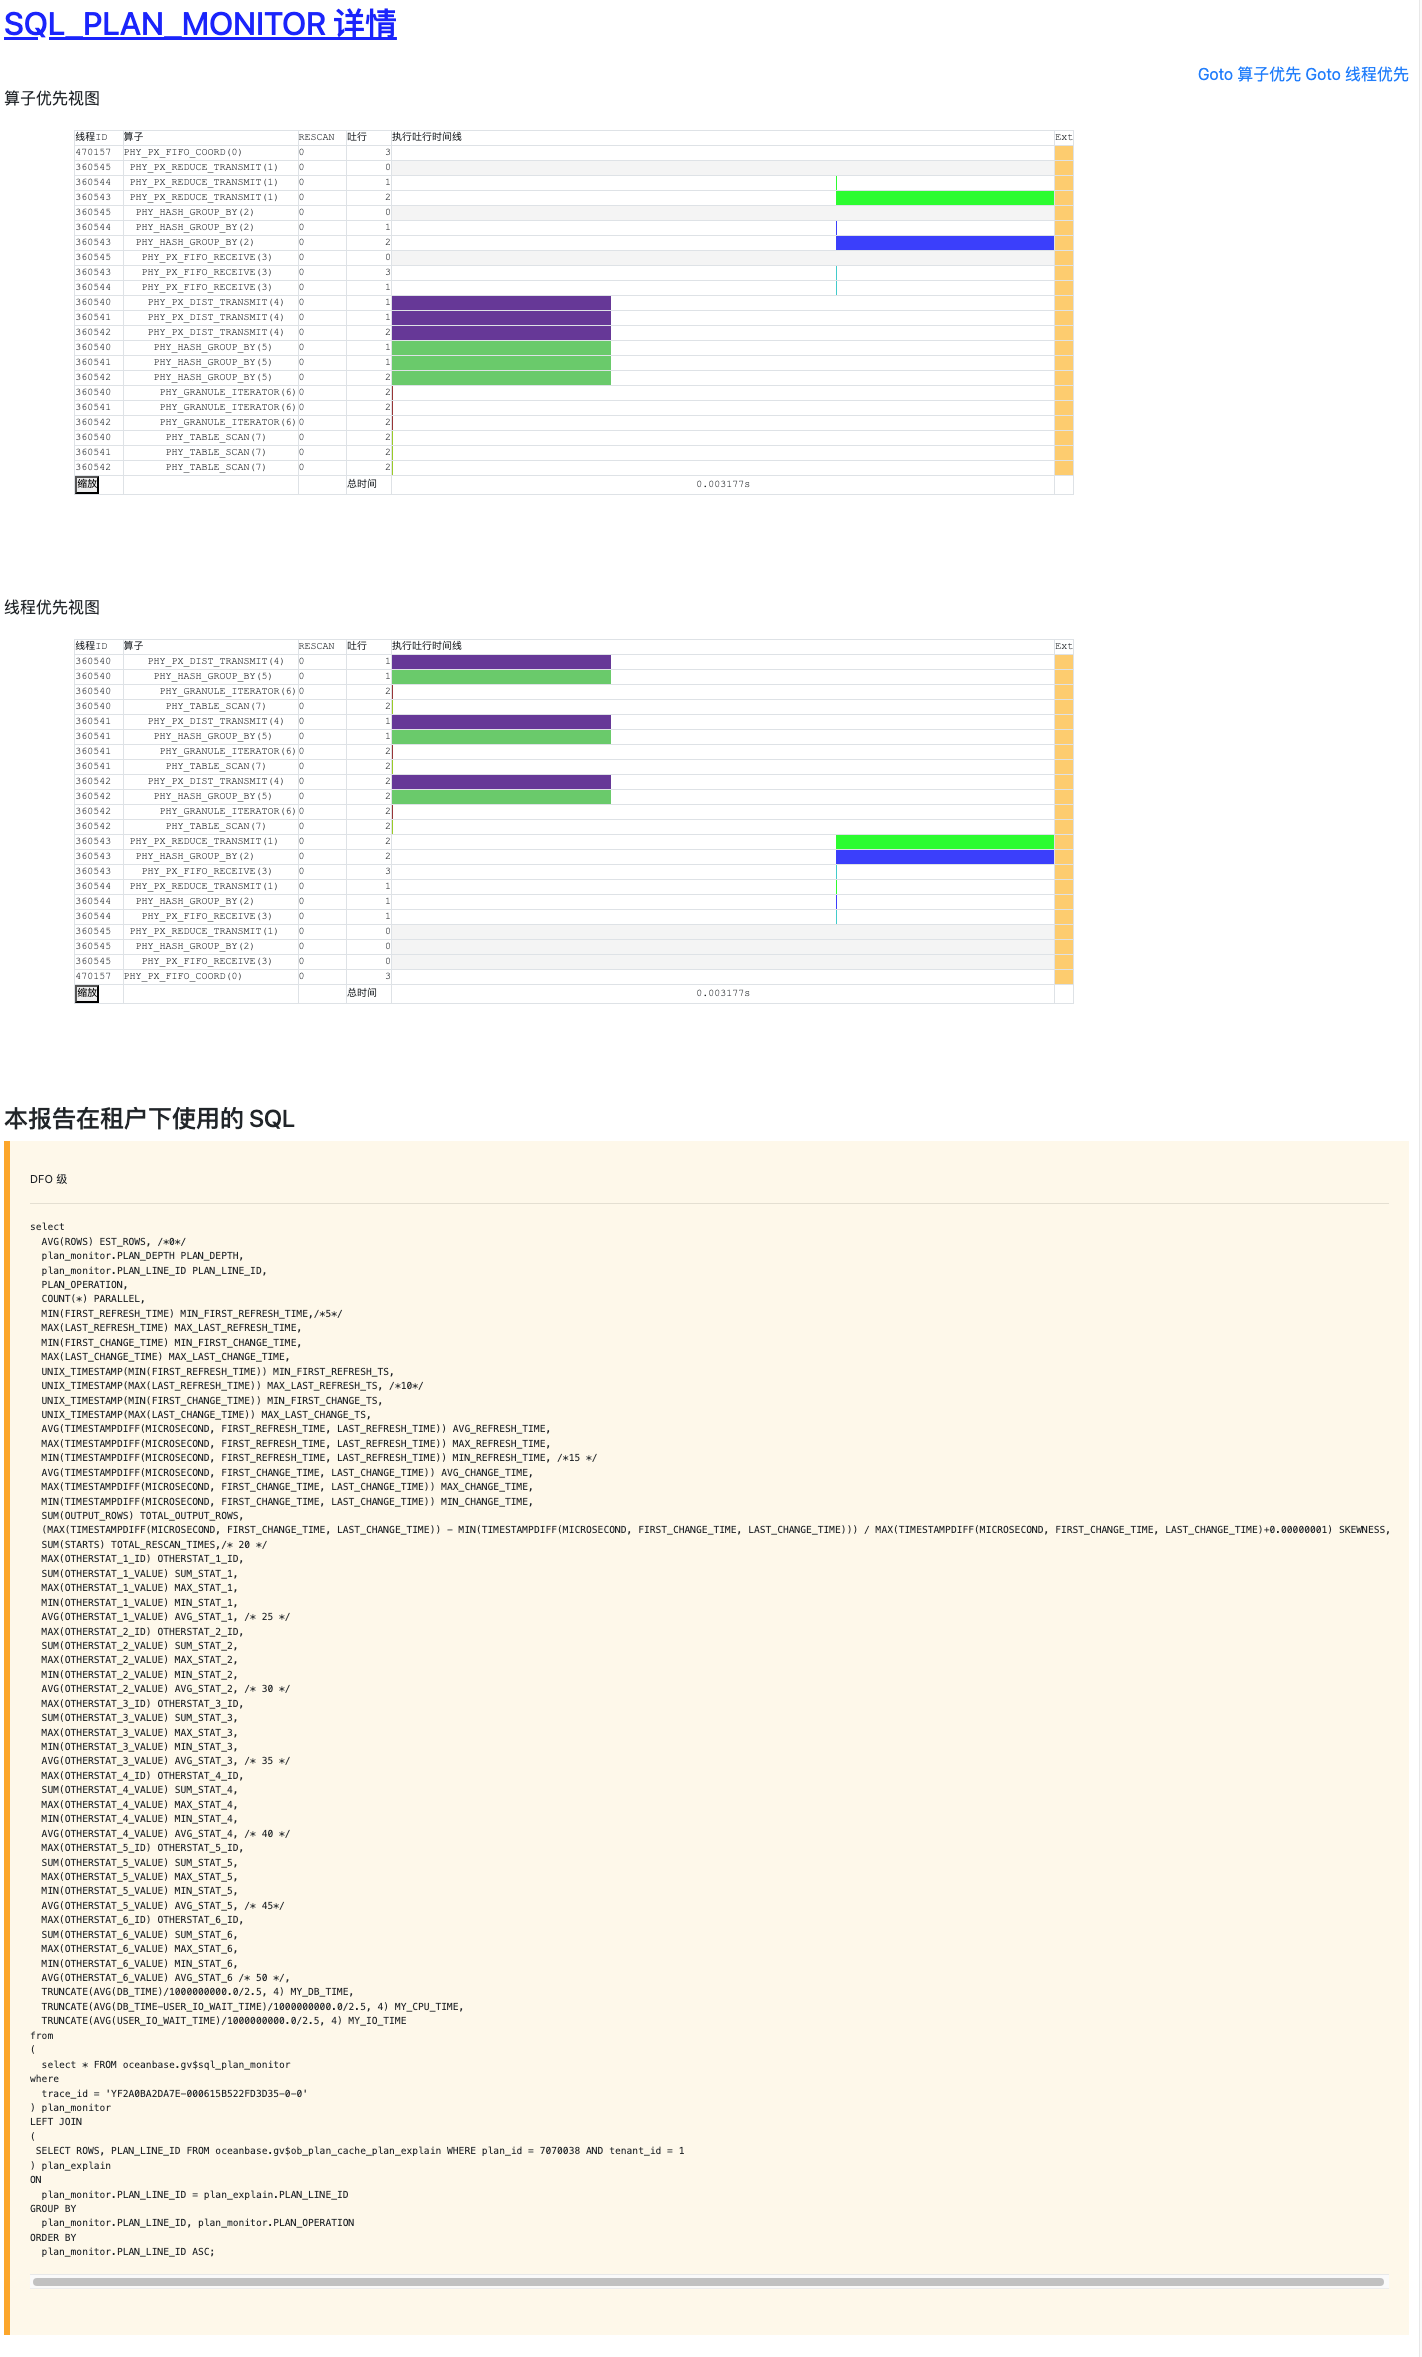
If you want to view detailed obdiag logs, please run: obdiag display-trace dade865c-27d2-11ef-bc35-cad6cd785756结果文件在obdiag_gather_pack_20240611171324中,其中sql_plan_monitor_report.html就是最终的结果,通过浏览器打开可看到完整的报告,不过在浏览器打开的时候请记得将resources问价夹一并放到目录下,否则打开的结果中看不到前端样式
#tree
.
├── resources
│   └── web
│       ├── bootstrap.min.css
│       ├── bootstrap.min.js
│       ├── jquery-3.2.1.min.js
│       └── popper.min.js
├── result_summary.txt
└── sql_plan_monitor_report.html

2 directories, 6 files
结果展示
4. 基于SQL场景的诊断信息收集
上面第三节的内容可以帮助你一条命令就搞定gv$ob_sql_audit、gv$ob_plan_cache_plan_stat、gv$ob_plan_cache_plan_explain、gv$sql_plan_monitor、explain extend SQL、show create table、参数等信息的获取,一般情况下分析问题足够了,但是如果你想额外在获取日志等信息,有没有办法一条命令搞定,答案是:必须有。
#obdiag gather scene list

[Other Problem Gather Scenes]:
---------------------------------------------------------------------------------------
command                                                   info_en               info_cn
---------------------------------------------------------------------------------------
obdiag gather scene run --scene=other.application_error   [application error]   [应用报错问题]
---------------------------------------------------------------------------------------

[Obproxy Problem Gather Scenes]:
----------------------------------------------------------------------------------
command                                           info_en             info_cn
----------------------------------------------------------------------------------
obdiag gather scene run --scene=obproxy.restart   [obproxy restart]   [obproxy无故重启]
----------------------------------------------------------------------------------

[Observer Problem Gather Scenes]:
----------------------------------------------------------------------------------------------------------------------------------------------------------------------------------------------------------
command                                                                                                                                   info_en                                       info_cn
----------------------------------------------------------------------------------------------------------------------------------------------------------------------------------------------------------
obdiag gather scene run --scene=observer.backup                                                                                           [backup problem]                              [数据备份问题]
obdiag gather scene run --scene=observer.backup_clean                                                                                     [backup clean]                                [备份清理问题]
obdiag gather scene run --scene=observer.base                                                                                             [cluster base info]                           [集群基础信息]
obdiag gather scene run --scene=observer.clog_disk_full                                                                                   [clog disk full]                              [clog盘满]
obdiag gather scene run --scene=observer.cluster_down                                                                                     [cluster down]                                [集群无法连接]
obdiag gather scene run --scene=observer.compaction                                                                                       [compaction]                                  [合并问题]
obdiag gather scene run --scene=observer.cpu_high                                                                                         [High CPU]                                    [CPU高]
obdiag gather scene run --scene=observer.delay_of_primary_and_backup                                                                      [delay of primary and backup]                 [主备库延迟]
obdiag gather scene run --scene=observer.io                                                                                               [io problem]                                  [io问题]
obdiag gather scene run --scene=observer.log_archive                                                                                      [log archive]                                 [日志归档问题]
obdiag gather scene run --scene=observer.long_transaction                                                                                 [long transaction]                            [长事务]
obdiag gather scene run --scene=observer.memory                                                                                           [memory problem]                              [内存问题]
obdiag gather scene run --scene=observer.perf_sql --env "{db_connect='-h127.0.0.1 -P2881 -utest@test -p****** -Dtest', trace_id='Yxx'}"   [SQL performance problem]                     [SQL性能问题]
obdiag gather scene run --scene=observer.px_collect_log --env "{trace_id='Yxx', estimated_time='2024-06-11 19:25:08'}"                    [Collect error source node logs for SQL PX]   [SQL PX 收集报错源节点日志]
obdiag gather scene run --scene=observer.recovery                                                                                         [recovery]                                    [数据恢复问题]
obdiag gather scene run --scene=observer.restart                                                                                          [restart]                                     [observer无故重启]
obdiag gather scene run --scene=observer.rootservice_switch                                                                               [rootservice switch]                          [有主改选或者无主选举的切主]
obdiag gather scene run --scene=observer.sql_err --env "{db_connect='-h127.0.0.1 -P2881 -utest@test -p****** -Dtest', trace_id='Yxx'}"    [SQL execution error]                         [SQL 执行出错]
obdiag gather scene run --scene=observer.suspend_transaction                                                                              [suspend transaction]                         [悬挂事务]
obdiag gather scene run --scene=observer.unit_data_imbalance                                                                              [unit data imbalance]                         [unit迁移/缩小 副本不均衡问题]
obdiag gather scene run --scene=observer.unknown                                                                                          [unknown problem]                             [未能明确问题的场景]
----------------------------------------------------------------------------------------------------------------------------------------------------------------------------------------------------------
上面的obdiag gather scene list能查看到所有当前版本支持的场景化的信息采集,其中
obdiag gather scene run --scene=observer.perf_sql --env "{db_connect='-h127.0.0.1 -P2881 -utest@test -p****** -Dtest', trace_id='Yxx'}"专门针对的是sql性能问题的时候来一键获取诊断信息的.
例子:
#obdiag gather scene run --scene=observer.perf_sql --env "{db_connect='-h192.168.1.100 -P3881 -uxxxx -p***** -Dxxxxx', trace_id='YF2A0BA2DA7E-000615B522FD3D6E-0-0'}"
gather_scenes_run start ...
gather from_time: 2024-06-11 19:00:54, to_time: 2024-06-11 19:31:54
execute tasks: observer.base
run scene excute yaml mode in node: 192.168.1.100 start
run scene excute yaml mode in node: 192.168.1.100 end
gather log from_time: 2024-06-11 19:00:59, to_time: 2024-06-11 19:31:59

ZipFileInfo:
+----------------+-----------+
| Node           | LogSize   |
+================+===========+
| 192.168.1.100 | 1.222K    |
+----------------+-----------+
Download 192.168.1.100:/tmp/ob_log_192.168.1.100_20240611190059_20240611193159.zip
Downloading [====================] 100.0% [1.22 KB ]

Gather Ob Log Summary:
+----------------+-----------+--------+--------+-------------------------------------------------------------------------------------------------------+
| Node           | Status    | Size   | Time   | PackPath                                                                                              |
+================+===========+========+========+=======================================================================================================+
| 192.168.1.100 | Completed | 1.222K | 5 s    | /home/admin/obdiag_gather_pack_20240611193054/ob_log_192.168.1.100_20240611190059_20240611193159.zip |
+----------------+-----------+--------+--------+-------------------------------------------------------------------------------------------------------+
gather from_time: 2024-06-11 19:01:04, to_time: 2024-06-11 19:32:04
[WARN] No found the qualified log file on Server [192.168.1.100]
[WARN] 192.168.1.100 The number of log files is 0, The time range for file gather from 2024-06-11 19:01:04 to 2024-06-11 19:32:04, and no eligible files were found. Please adjust the query time limit.

Gather ObProxy Log Summary:
+----------------+----------------------+--------+--------+------------+
| Node           | Status               | Size   | Time   | PackPath   |
+================+======================+========+========+============+
| 192.168.1.100 | Error:No files found | 0.000B | 2 s    |            |
+----------------+----------------------+--------+--------+------------+

Gather Sql Plan Monitor Summary:
+-----------+-----------+--------+-----------------------------------------------+
| Cluster   | Status    | Time   | PackPath                                      |
+===========+===========+========+===============================================+
| obcluster | Completed | 0 s    | /home/admin/obdiag_gather_pack_20240611193054 |
+-----------+-----------+--------+-----------------------------------------------+

Gather scene results stored in this directory: /home/admin/obdiag_gather_pack_20240611193054

Trace ID: 1047fe6e-27e6-11ef-bbb0-cad6cd785756
If you want to view detailed obdiag logs, please run: obdiag display-trace 1047fe6e-27e6-11ef-bbb0-cad6cd785756
cd /home/admin/obdiag_gather_pack_20240611193054
.
├── ob_log_192.168.1.100_20240611190059_20240611193159.zip
├── resources
│   └── web
│       ├── bootstrap.min.css
│       ├── bootstrap.min.js
│       ├── jquery-3.2.1.min.js
│       └── popper.min.js
├── result_summary.txt
└── sql_result.txt
结果中除了第三章节的Planmonitor报告之外还会将trace_id相关的日志捞出来,同时会将集群的基本信息捞出来,sql_result.txt。真正做到了一条命令搞定SQL相关的所有信息,不需要再来回交互了。
5.附录
- obdiag 下载地址: https://www.oceanbase.com/softwarecenter
- obdiag 官方文档: obdiag 文档
- obdiag github地址: https://github.com/oceanbase/obdiag
- obdiag SIG 营地: 诊断工具 · OceanBase 技术交流


 1279
1279

 被折叠的 条评论
为什么被折叠?
被折叠的 条评论
为什么被折叠?
 到【灌水乐园】发言


