


一、打开官网
二、进入官网
- 点击快速入门
三、获取Echarts
- 在终端下载 npm install echarts
-
npm install echarts --save
四、引入ECharts
-
import * as echarts from 'echarts';
五 绘制图表
-
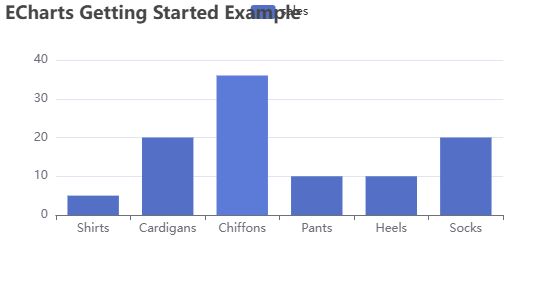
var myChart = echarts.init(document.getElementById('main'));
// 绘制图表
myChart.setOption({
  title: {
    text: 'ECharts 入门示例'
  },
  tooltip: {},
  xAxis: {
    data: ['衬衫', '羊毛衫', '雪纺衫', '裤子', '高跟鞋', '袜子']
  },
  yAxis: {},
  series: [
    {
      name: '销量',
      type: 'bar',
      data: [5, 20, 36, 10, 10, 20]
    }
  ]
});
六、运行项目
这样你的第一个图表就诞生了


 1017
1017

 被折叠的 条评论
为什么被折叠?
被折叠的 条评论
为什么被折叠?
 到【灌水乐园】发言


