


需求背景:需要实现纯前端打印功能,将ECharts渲染的图表直接通过打印机输出,无需后端参与。
解决方案思路:通过将配置好的ECharts图表转换为图片格式,再执行打印操作。ECharts官方提供的echarts.getDataURL方法可以完美支持这一需求,该接口能够将当前图表快速转换为图片数据,适用于打印、导出、预览和上传等多种场景。
ps:介绍一下echarts.getDataURL方法
1.语法(两种调用姿势)
// 1. 实例方法(推荐)
const url = myChart.getDataURL(opt)

// 2. 全局静态方法(偶尔调试)
const url = echarts.getInstanceByDom(dom).getDataURL(opt)
2.参数 opt 全字段
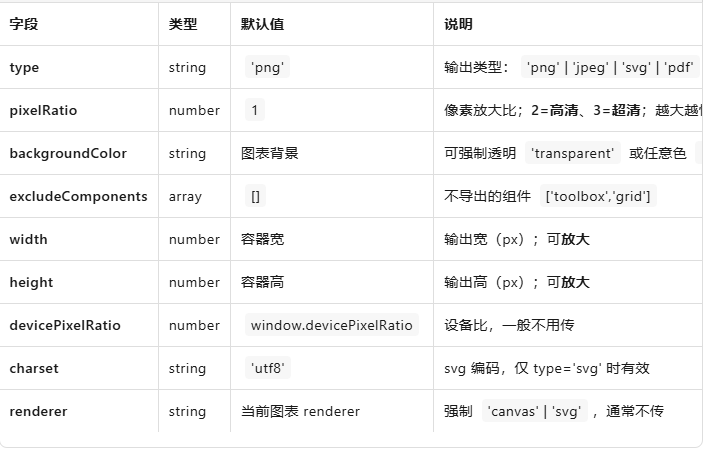
3.返回值
-
png / jpeg →
"data:image/png;base64,iVBORw0KGgoAAAANS..." -
svg →
"data:image/svg+xml;utf8,%3Csvg..."
可直接放到<img src>、<a download>、pdf、打印、上传。
4.代码示例
const url = myChart.getDataURL({
  type: 'png',
  pixelRatio: 2,               // 高清
  backgroundColor: '#fff',     // 白底
  excludeComponents: ['toolbox'] // 不导出工具栏
})

// 1. 下载
const a = document.createElement('a')
a.download = 'chart.png'
a.href = url
a.click()

// 2. 打印
printJS({ printable: url, type: 'image' })

// 3. 上传
fetch('/upload', { method: 'POST', body: JSON.stringify({ img: url }) })
getDataURL = 图表快照机,调像素、调背景、调尺寸,一键拿到 base64,打印导出随你用。
将echarts图表转化成图片后,需要解决的就是将转化后的图片打印
方法一:引入打印插件:print-js 一行代码(最简)
1.安装插件
npm i print-js
2.使用
import printJS from 'print-js'

// 本地 public 目录图片
printJS({ printable: 'img/qr.png', type: 'image' })

// 远程图片(需允许跨域,否则看方案 B)
printJS({ printable: 'https://xxx.com/a.jpg', type: 'image' })

// base64
printJS({ printable: 'data:image/png;base64,iVBORw0KGgoAAAANS...', type: 'image' })
3.横向打印 / 无边距
printJS({
  printable: url,
  type: 'image',
  style: '@page { size: landscape; margin: 0 }'
})
方法二:原生 iframe(无依赖、跨域也稳)
function printImage(src) {
  const iframe = document.createElement('iframe')
  iframe.style.display = 'none'
  document.body.appendChild(iframe)

  const doc = iframe.contentDocument
  doc.open()
  doc.write(`
    <!doctype html>
    <html>
      <head><title>print</title></head>
      <body style="margin:0">
        <img src="${src}" style="width:100%">
        <script>
          window.onload = () => {
            window.print();          // 唤起打印
            window.onafterprint = () => parent.document.body.removeChild(window.frameElement)
          }
        <\/script>
      </body>
    </html>
  `)
  doc.close()
}

// 调用
printImage('https://xxx.com/a.jpg')   // 远程
printImage('data:image/png;base64,...') // base64
3.实战示例
<div class="chartDiv">
      <div class="chart">
        <el-button type="primary" style="margin-left: 20px" :disabled="!chartData?.length" icon="el-icon-printer" @click="onPrintChart('barChart')"
          >打印统计图</el-button
        >
        <div class="bar-chart" id="barChart" ref="barChart"></div>
      </div>
    </div>
Vue2代码
data() {
return {
// 图表数据
chartData: [],
// 图表实例
barChart: null,
chartTitle: '',
}
},
method:{
// *********获取图表数据***********
getChartData() {
let dataTime = ''
const [startTime, endTime] = this.query.date || []
if (startTime && endTime) {
dataTime = `${startTime}至${endTime}`
}
//调用接口获取数据
$.submit(
'xxx.xxxxgetChartData',
{
bean: {
...this.query,
startTime: startTime,
endTime: endTime,
date: void 0,
},
},
(rst) => {
this.chartData = rst.data || []
this.chartTitle = `${dataTime}一键报警次数统计`
this.$nextTick(() => {
this.initBarChart()
})
},
)
},
// 初始化柱状图
initBarChart() {
if (this.barChart) {
this.barChart?.dispose()
this.barChart = null
}
this.barChart = echarts.init(this.$refs?.barChart)
let legend = ['报警次数']
let seriesData = []
let xData = []
if (this.chartData?.length > 0) {
this.chartData?.map((item) => {
xData.push(item.itemName)
seriesData.push({ name: item.itemName, value: item.value })
})
}
let option = {
title: {
text: this.chartTitle,
top: '0%',
textAlign: 'center',
left: '48%',
textStyle: {
color: '#333',
fontSize: 18,
fontWeight: '600',
},
},
tooltip: {
trigger: 'axis',
borderColor: 'rgba(242,251,255,.3)',
backgroundColor: 'rgba(13,5,30,.6)',
borderWidth: 1,
padding: 5,
confine: true,
textStyle: {
color: '#fff',
},
},
dataZoom: {
xAxisIndex: [0, 1],
type: 'slider',
// start: 0,
// end: 50,
height: 10,
bottom: '5%',
textStyle: {
color: '#fff',
},
},
grid: {
borderWidth: 0,
top: '18%',
left: '6%',
right: '6%',
bottom: '17%',
textStyle: {
color: '#666',
},
},
legend: {
top: '7%',
left: '45%',
textStyle: {
fontSize: 14,
fontFamily: 'SourceHanSansCN-Regular',
color: '#666',
},
data: legend,
},
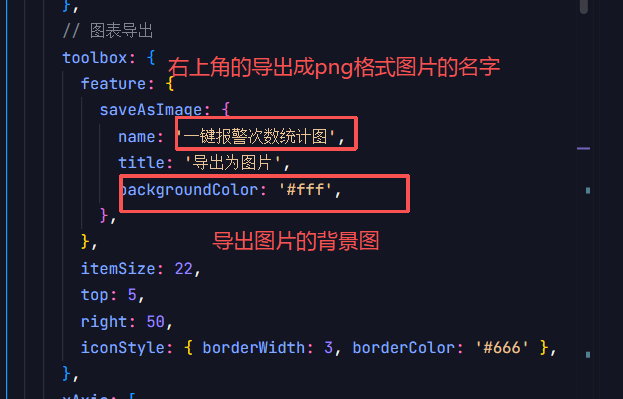
// 图表导出
toolbox: {
feature: {
saveAsImage: {
name: '统计图',
title: '导出为图片',
backgroundColor: '#fff',
},
},
itemSize: 22,
top: 5,
right: 50,
iconStyle: { borderWidth: 3, borderColor: '#666' },
},
xAxis: [
{
type: 'category',
axisLine: {
lineStyle: {
type: 'solid',
width: '1',
},
},
axisLabel: {
fontSize: 14,
},
splitLine: {
lineStyle: {
type: 'dashed',
},
},
data: xData,
},
],
yAxis: [
{
type: 'value',
name: '单位:次',
minInterval: 1,
splitLine: {
show: true,
lineStyle: {
type: 'dashed',
color: 'rgba(102,102,102,0.2)',
},
},
axisLine: {
show: false, //隐藏X轴轴线
},
axisTick: {
show: false,
},
axisLabel: {
interval: 0,
color: '#666',
fontSize: 12,
formatter: (params) => {
return params + ''
},
},
splitArea: {
show: false,
},
},
],
series: [
{
name: '报警次数',
type: 'bar',
barWidth: '15%',
color: '#F56C6C',
data: seriesData.map((item) => item.value),
},
],
}
if (seriesData?.length < 1) {
option = {
title: { text: '暂无数据', x: 'center', y: 'center', textStyle: { color: '#666666', fontSize: 15 } },
}
}
this.barChart.setOption(option, true)
window.addEventListener('resize', function () {
this.barChart && this.barChart.resize()
})
},
getImage(key) {
// 获取柱状图的url
return this[key].getDataURL({
type: 'png',
pixelRatio: 3,
backgroundColor: '#fff',
excludeComponents: ['toolbox', 'dataZoom'],
})
},
// 打印图表
onPrintChart(key) {
let src = this.getImage(key)
try {
const iframe = document.createElement('iframe')
iframe.style.display = 'none'
document.body.appendChild(iframe)
const win = iframe.contentWindow
const doc = win.document
doc.open()
doc.write(`
<!DOCTYPE html>
<html>
<head>
<title></title>
</head>
<style>
@media print {
@page {
margin: 0cm;
size: A4 landscape;
}
html, body {
margin: 0;
width: 297mm;
height: 210mm;
}
tr {
page-break-inside: avoid;
}
}
</style>
<body style="margin:0">
<div style="width:297mm; height:210mm; display:flex; align-items:center; justify-content:center;">
<img src="${src}" style="width:100%; height:100%; object-fit:contain; margin:0">
</div>
</body>
</html>
`)
doc.close()
// 等待内容和样式加载完成后打印
setTimeout(() => {
try {
win.print()
} catch (error) {
} finally {
setTimeout(() => {
document.body.removeChild(iframe)
}, 100)
}
}, 100)
} catch (error) {}
},
}
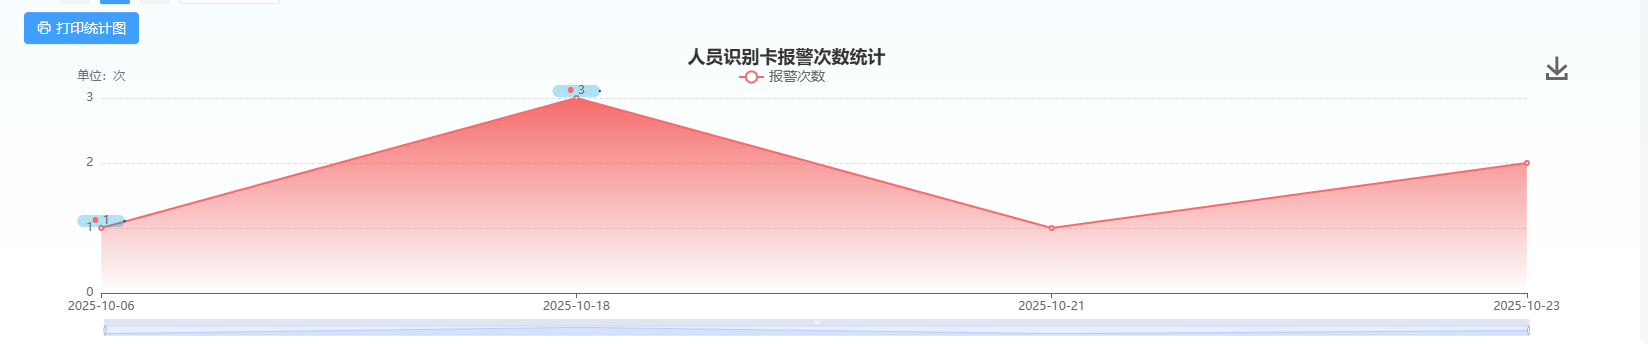
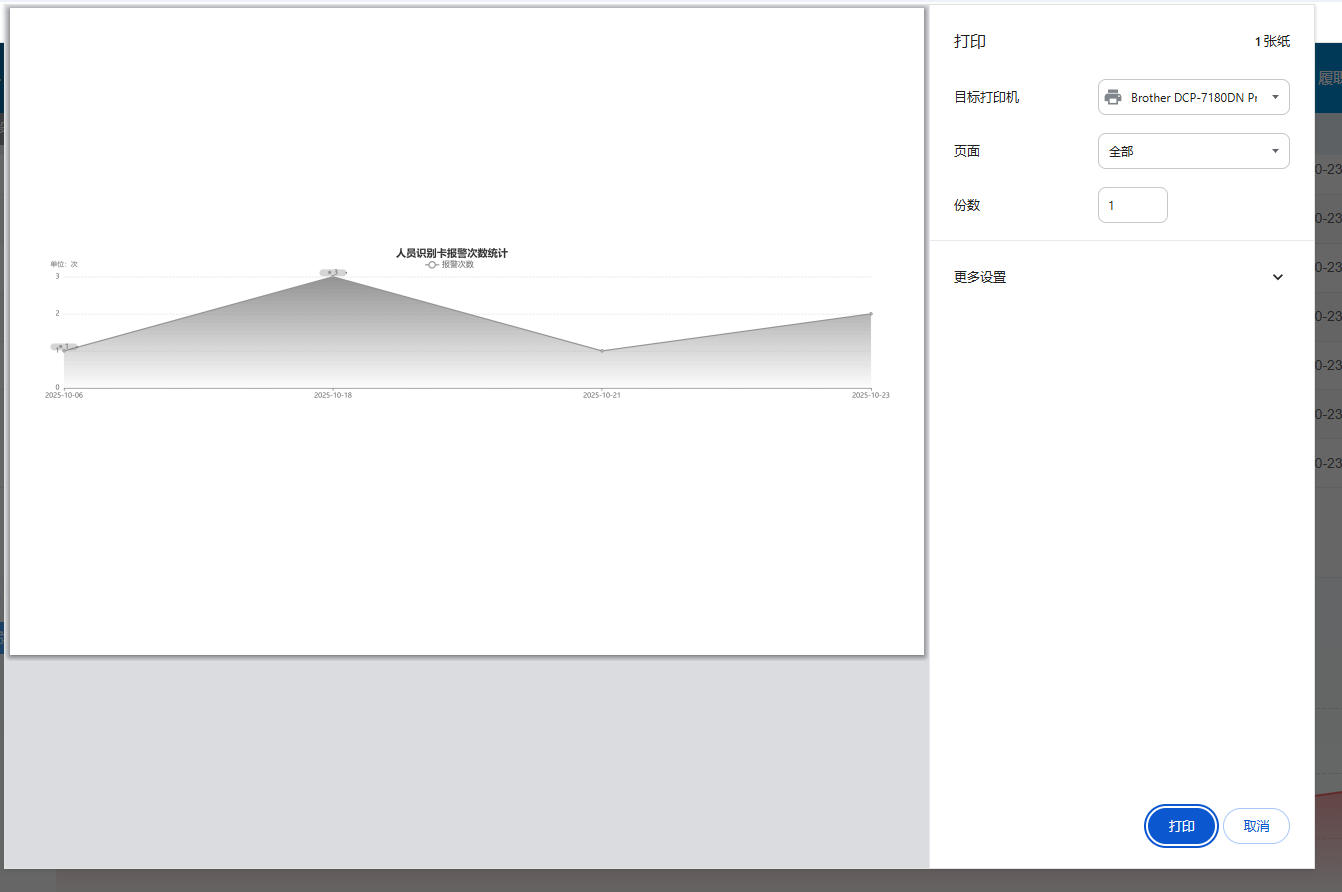
页面效果演示
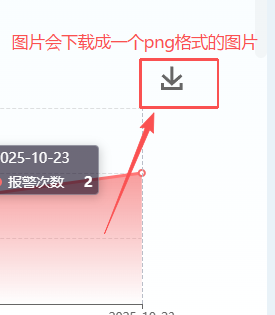
导出的文件的样式
在这次梳理过程中,我主要对工作中常用的核心功能模块进行了系统性的归纳整理。虽然初步完成了基础框架的搭建,但还存在不少需要完善的地方:
- 细节描述不够深入
- 实践验证不足
- 仅基于个人使用经验整理
- 缺少团队其他成员的实践反馈
- 未经过多业务场景的完整测试验证
- 文档结构有待优化
- 分类标准可以更科学合理
- 功能间的关联关系需要更清晰呈现
- 可考虑增加流程图和示例代码


 被折叠的 条评论
为什么被折叠?
被折叠的 条评论
为什么被折叠?
 到【灌水乐园】发言


