备份代码——仅供参考
import pymssql
import pandas as pd
import numpy as np
import seaborn as sb
from sklearn import metrics
import matplotlib.pyplot as plt
from sqlalchemy import create_engine
from imblearn.over_sampling import SMOTE
from sklearn.preprocessing import OneHotEncoder
from sklearn.preprocessing import LabelEncoder
from sklearn import preprocessing
from sklearn.model_selection import train_test_split
from sklearn.preprocessing import StandardScaler
from sklearn.linear_model import LogisticRegression
from sklearn.metrics import confusion_matrix
from sklearn.metrics import classification_report
from sklearn.metrics import roc_auc_score
from sklearn.metrics import roc_curve
conn_test = pymssql.connect(host='12.34.2.12',
user='sa',
ss='swd',
database='CS',
charset='utf8')
engine = create_engine('mssql+pymssql://sd:xsw!2017@@12.13.14.15:1433/CA',pool_size=2, max_overflow=2)
def getClassDF():
sql_str = "select * from ml_score"
df = pd.read_sql(sql_str,con = conn_test)
return df
Final_DF = getClassDF()
copy_df = Final_DF
copy_df
copy_df['year'] = pd.to_datetime(copy_df['range_time'],infer_datetime_format=True)
copy_df['month'] = pd.to_datetime(copy_df['range_time'],infer_datetime_format=True)
copy_df['year'] = copy_df['year'].apply(lambda x:x.year)
copy_df['month'] = copy_df['month'].apply(lambda x:x.month)
copy_df = copy_df.drop( 'range_time',axis = 1)
copy_df
copy_df = copy_df.drop(['id','sku','store_id','create_time','count_sku_in_num','count_sku_out_num','in_num_count','out_num_count','current_month_inventory_num'],axis =1 )
copy_df
for column in copy_df.select_dtypes('object').columns:
dummies = pd.get_dummies(copy_df[column],prefix = column)
copy_df = pd.concat([copy_df, dummies], axis = 1)
copy_df = copy_df.drop(column, axis = 1)
count_df = copy_df['label'].value_counts().to_frame()
count_df
count_df.plot(kind = 'bar')
copy_df.describe()
X = copy_df.drop(['label'],axis = 1)
y = copy_df['label']
scaler = StandardScaler()
scaler.fit(X)
X = pd.DataFrame(scaler.transform(X),index = X.index,columns = X.columns)
X_train, X_test, y_train, y_test = train_test_split(X, y, test_size=0.3, random_state=1)
print("Before OverSampling, counts of label '1': {}".format(sum(y_train==1)))
print("Before OverSampling, counts of label '0': {} \n".format(sum(y_train==0)))
sm = SMOTE(random_state=0)
X_train_res, y_train_res = sm.fit_resample(X_train, y_train.ravel())
print('After OverSampling, the shape of train_X: {}'.format(X_train_res.shape))
print('After OverSampling, the shape of train_y: {} \n'.format(y_train_res.shape))
print("After OverSampling, counts of label '1': {}".format(sum(y_train_res==1)))
print("After OverSampling, counts of label '0': {}".format(sum(y_train_res==0)))
X_train_res
from sklearn.model_selection import GridSearchCV
from sklearn.linear_model import LogisticRegression
from sklearn.metrics import confusion_matrix, precision_recall_curve, auc, roc_auc_score, roc_curve, recall_score, classification_report
parameters = {
'C': np.linspace(1, 10, 10)
}
lr = LogisticRegression()
clf = GridSearchCV(lr, parameters, cv=5, verbose=1, n_jobs=3)
clf.fit(X_train, y_train.ravel())
clf.best_params_
lr1 = LogisticRegression(C=7.0,penalty='l2', verbose=1)
lr1.fit(X_train, y_train.ravel())
import itertools
def plot_confusion_matrix(cm, classes,
normalize=False,
title='Confusion matrix',
cmap=plt.cm.Blues):
"""
This function prints and plots the confusion matrix.
Normalization can be applied by setting `normalize=True`.
"""
plt.imshow(cm, interpolation='nearest', cmap=cmap)
plt.title(title)
plt.colorbar()
tick_marks = np.arange(len(classes))
plt.xticks(tick_marks, classes, rotation=0)
plt.yticks(tick_marks, classes)
if normalize:
cm = cm.astype('float') / cm.sum(axis=1)[:, np.newaxis]
else:
1
thresh = cm.max() / 2.
for i, j in itertools.product(range(cm.shape[0]), range(cm.shape[1])):
plt.text(j, i, cm[i, j],
horizontalalignment="center",
color="white" if cm[i, j] > thresh else "black")
plt.tight_layout()
plt.ylabel('True label')
plt.xlabel('Predicted label')
y_train_pre = lr1.predict(X_train)
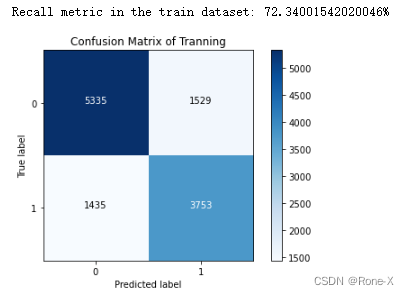
cnf_matrix_tra = confusion_matrix(y_train, y_train_pre)
print("Recall metric in the train dataset: {}%".format(100*cnf_matrix_tra[1,1]/(cnf_matrix_tra[1,0]+cnf_matrix_tra[1,1])))
class_names = [0,1]
plt.figure()
plot_confusion_matrix(cnf_matrix_tra , classes=class_names, title='Confusion Matrix of Tranning')
plt.show()
y_pre = lr1.predict(X_test)
cnf_matrix = confusion_matrix(y_test, y_pre)
print("Recall metric in the testing dataset: {}%".format(100*cnf_matrix[1,1]/(cnf_matrix[1,0]+cnf_matrix[1,1])))
class_names = [0,1]
plt.figure()
plot_confusion_matrix(cnf_matrix , classes=class_names, title='Confusion Matrix of Test')
plt.show()
tmp = lr1.fit(X_train_res, y_train_res.ravel())
y_pred_sample_score = tmp.decision_function(X_test)
fpr, tpr, thresholds = roc_curve(y_test, y_pred_sample_score)
roc_auc = auc(fpr,tpr)
plt.title('Receiver Operating Characteristic')
plt.plot(fpr, tpr, 'b',label='AUC = %0.3f'% roc_auc)
plt.legend(loc='lower right')
plt.plot([0,1],[0,1],'r--')
plt.xlim([-0.1,1.0])
plt.ylim([-0.1,1.01])
plt.ylabel('True Positive Rate')
plt.xlabel('False Positive Rate')
plt.show()


 920
920

 被折叠的 条评论
为什么被折叠?
被折叠的 条评论
为什么被折叠?
 到【灌水乐园】发言


