<template>
<div class="linebarChat"></div>
</template>
<script>
export default {
data() {
return {
pastDates: [],
};
},
mounted() {
this.getPastDates();
},
methods: {
// 将x轴的日期由当前时间往前推,形成动态日期区间
getPastDates() {
const today = new Date();
for (let i = 0; i < 6; i++) {
const pastDate = new Date(today.getTime() - i * 24 * 60 * 60 * 1000);
const year = pastDate.getFullYear();
const month = pastDate.getMonth() + 1;
const date = pastDate.getDate();
this.pastDates.push(`${year}-${month}-${date}`);
}
let pastDates = this.pastDates.sort();
this.setChart(pastDates);
},
setChart(pastDates) {
let option = {
tooltip: {
trigger: "axis",
axisPointer: {
type: "cross",
label: {
backgroundColor: "#6a7985",
},
},
formatter: function (params) {
var showTip = "";
showTip = `
${params[0].name}<br>
<div style="margin-top:10px;">${params[0].marker}${params[0].seriesName}:${params[0].value}</div>
<div style="margin-top:10px;">${params[1].marker}${params[1].seriesName}:${params[1].value}</div>
<div style="margin-top:10px;">${params[2].marker}${params[2].seriesName}:${params[2].value}%</div>
<div style="margin-top:10px;">${params[3].marker}${params[3].seriesName}:${params[3].value}%</div>
`;
return showTip;
},
},
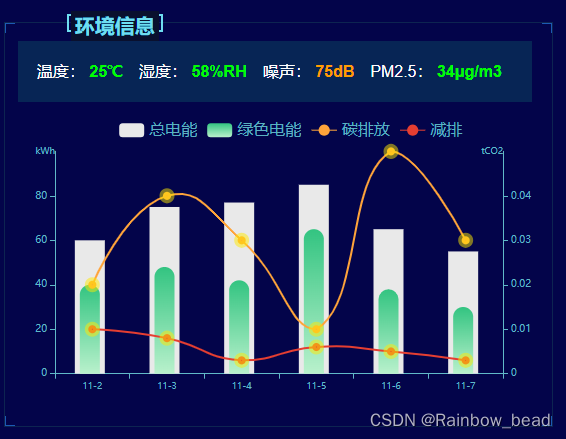
legend: {
data: ["总电能", "绿色电能", "碳排放", "减排"],
left: "20%",
top: "10%",
textStyle: {
color: "#5CB1C1",
fontSize: 16,
},
},
grid: {
top: "20%",
bottom: "15%",
left: 50,
right: 48,
},
xAxis: [
{
type: "category",
nameTextStyle: {
color: "#5cb1c1",
fontSize: 10,
},
boundaryGap: true,
axisLabel: {
interval: 0,
color: "#61B9C8",
fontSize: 9,
align: "center",
},
axisLine: {
lineStyle: {
color: "#61B9C8",
},
},
data: pastDates,
},
],
yAxis: [
{
type: "value",
name: "kWh",
axisLine: {
lineStyle: {
color: "#61B9C8",
},
},
axisLabel: {
color: "#61B9C8",
fontSize: 10,
showMaxLabel: false,
formatter: "{value}",
},
nameGap: -5,
nameTextStyle: {
color: "#61B9C8",
fontSize: 9,
align: "right",
},
splitLine: { show: false },
},
{
type: "value",
name: "tCO2",
position: "right",
axisLine: {
lineStyle: {
color: "#61B9C8",
},
},
axisLabel: {
color: "#61B9C8",
fontSize: 10,
showMaxLabel: false,
formatter: "{value}",
},
nameGap: -5,
nameTextStyle: {
color: "#61B9C8",
fontSize: 9,
align: "right",
},
splitLine: { show: false },
},
],
series: [
{
name: "绿色电能",
type: "bar",
data: [40, 48, 42, 65, 38, 30],
barMaxWidth: 20,
zlevel: 1,
itemStyle: {
normal: {
color: {
type: "linear",
x: 0,
y: 0,
x2: 0,
y2: 1,
colorStops: [
{
offset: 0,
color: "#33c481",
},
{
offset: 1,
color: "#b9f1cc",
},
],
},
barBorderRadius: [30, 30, 0, 0],
},
},
},
{
name: "总电能",
type: "bar",
itemStyle: {
normal: {
color: "#E9E9E9",
},
},
silent: true,
barWidth: 30,
barGap: "-125%", // 双柱重叠
data: [60, 75, 77, 85, 65, 55],
},
{
name: "碳排放",
type: "line",
zlevel: 10,
yAxisIndex: 1, //y轴的index
smooth: true, //显示平滑曲线
symbol: "circle", //标记的图形为实心圆
symbolSize: 8, //标记的大小
itemStyle: {
normal: {
color: "#ffa43a",
borderColor: "rgba(255, 234, 0, 0.5)", //圆点透明边框
borderWidth: 7,
},
},
lineStyle: {
color: "#ffa43a",
},
data: [0.02, 0.04, 0.03, 0.01, 0.05, 0.03],
},
{
name: "减排",
type: "line",
zlevel: 10,
yAxisIndex: 1,
smooth: true,
symbol: "circle",
symbolSize: 8,
itemStyle: {
normal: {
color: "#e53e31",
borderColor: "rgba(255, 234, 0, 0.5)",
borderWidth: 7,
},
},
lineStyle: {
color: "#e53e31",
},
data: [0.01, 0.008, 0.003, 0.006, 0.005, 0.003],
},
],
};
let myChart = this.$echarts(this.$el);
myChart.clear();
myChart.resize();
myChart.setOption(option);
},
},
};
</script>
<style lang="less" scoped>
.linebarChat {
width: 100%;
height: 100%;
}
</style>


 被折叠的 条评论
为什么被折叠?
被折叠的 条评论
为什么被折叠?
 到【灌水乐园】发言


