


在 Matplotlib 中,plt.arrow 函数用于绘制箭头。以下是该函数的主要参数说明:
x: 箭头起点的 x 坐标。
y: 箭头起点的 y 坐标。
dx: 箭头的水平长度(终点的 x 坐标相对于起点的 x 坐标的增量)。
dy: 箭头的垂直长度(终点的 y 坐标相对于起点的 y 坐标的增量)。
width: 箭头底部的宽度,默认为 0.001。
head_width: 箭头头部的宽度,默认为 3倍箭头底部宽度。
head_length: 箭头头部的长度,默认为 1.5倍箭头头部宽度。
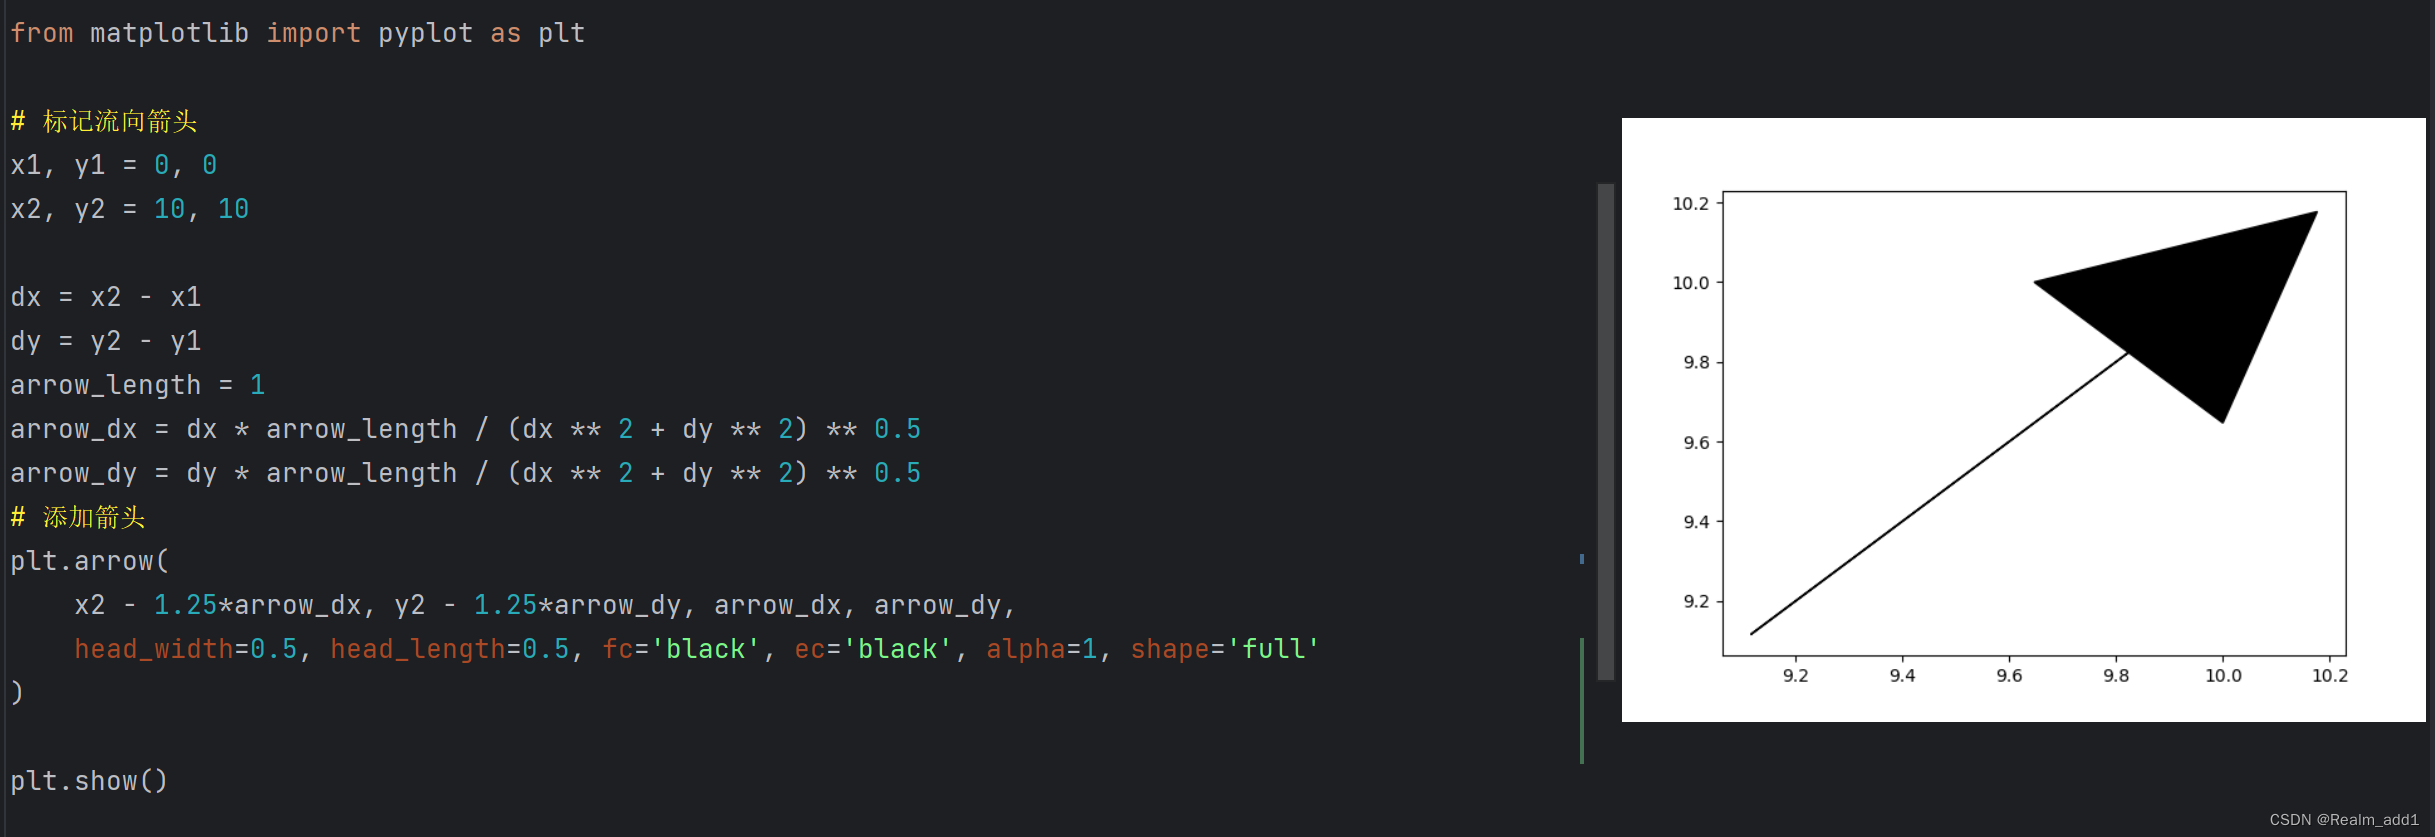
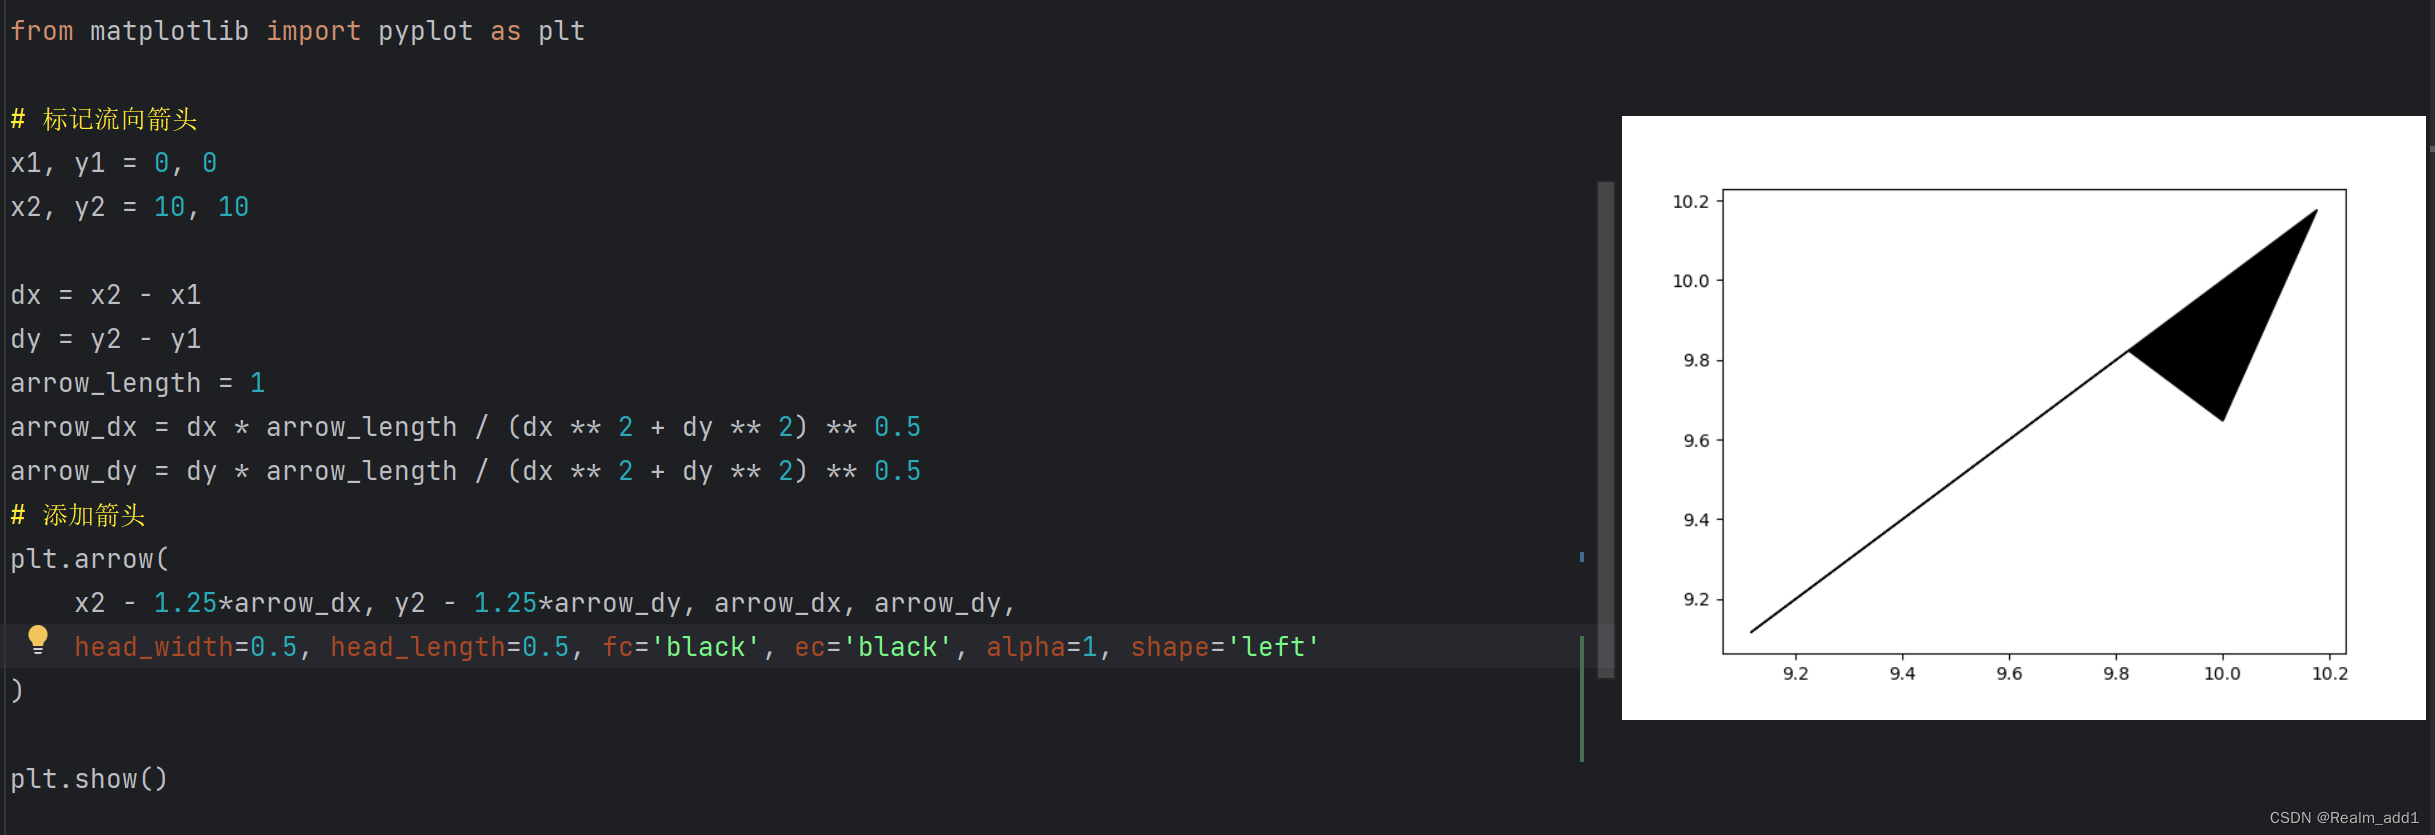
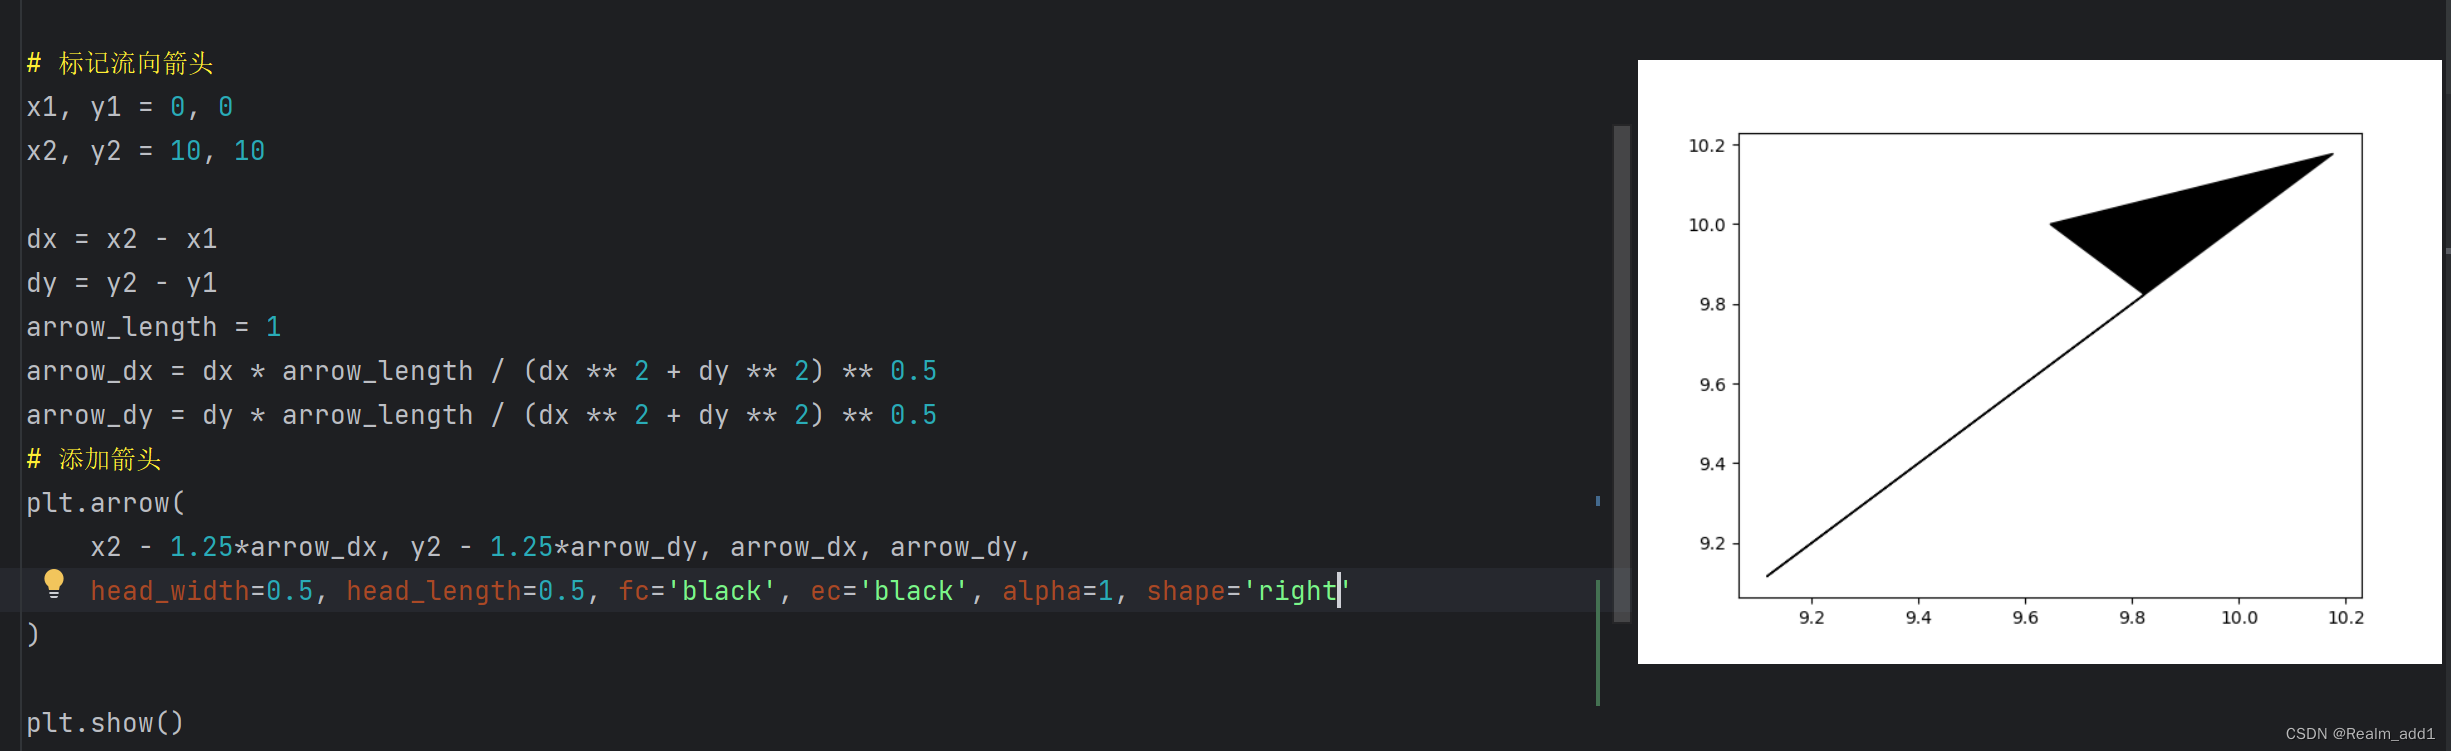
shape: 箭头头部的形状,默认为 'full',可选值为 'full', 'left', 'right'。
length_includes_head: 箭头的总长度是否包括头部长度,默认为 False。
fc: 箭头填充色。
ec: 箭头边框色。
alpha: 箭头的透明度。
zorder: 控制绘图顺序,数值较大的图层会在数值较小的图层上面。
1.关于shape参数的设置
①shape='full'
②shape='left'
③shape='right'
附代码
from matplotlib import pyplot as plt

# 标记流向箭头
x1, y1 = 0, 0
x2, y2 = 10, 10

dx = x2 - x1
dy = y2 - y1
arrow_length = 1
arrow_dx = dx * arrow_length / (dx ** 2 + dy ** 2) ** 0.5
arrow_dy = dy * arrow_length / (dx ** 2 + dy ** 2) ** 0.5
# 添加箭头
plt.arrow(
    x2 - 1.25*arrow_dx, y2 - 1.25*arrow_dy, arrow_dx, arrow_dy,
    head_width=0.5, head_length=0.5, fc='black', ec='black', alpha=1, shape='full',
    length_includes_head=True
)

plt.show()


 3006
3006

 被折叠的 条评论
为什么被折叠?
被折叠的 条评论
为什么被折叠?
 到【灌水乐园】发言


