


常见开源监控的对比和选择
cacti
cacti不是监控工具,他是个依赖于SNMP的数据采集和数据呈现的工具。
功能: 数据采集、保存数据[SQL,txt]
数据展示(rrdtool绘图)
数据分析和报警(很一般)
nagios
功能: 数据报警(报警功能是Nagios的特色功能)[故障触发,故障恢复都可以
依赖分析报警(能自动的识别到关键设备的故障,关联设备不会报警)
数据采集(采集的数据是弱项,他只关心警戒位,只关心正常与否的状态,状态转换时可以实现报警,所以它采集的数据不需要保存),当然也有插件弥补这个不足,如PNP4Nagios。
Nagios+cacti整合互相弥补不足!
zabbix
nagios和cacti不适合超大规模的监控、由于大规模的带宽和网络限制,会导致监控的延迟等问题,所以有很多是nagios+cacti整合,但是依然不适合在大规模的环境中,不适合分布式部署,Nagios在大规模中就会出现延迟,失去Nagios本事的特色。
那么zabbix同时整合了cacti和Nagios特点的工具,而且还具有了前两者不具有的工具,支持分布式等等。
补充工具:
netdata:托管在github上的一款类型zabbix的开源监控工具 https:/ /github.com/firehol/netdata
open-falcon:小米公司开源的企业级监控工具
Ganglia 类似于zabbix,大型分布式监控系统
开源监控工具对比http://www.oschina.net/news/67525/monitoring-tools
2、数据采集的方式
SNMP:简单网络管理协议
Agent:代理的方式去采集数据
Shell,脚本:通过脚本获取信息来采集
3、数据展示方式:
java、php、APP
4、报警方式:
mail、短信、及时通信工具
Nagios监控
Nagios是一款开源免费的网路监视工具,可以监控的设备:Windows,Linux,Unix,Router,Switch,打印机等,具有报警功能,是一个网络监控系统。在系统或服务状态异常时发出邮件或短信报警第一时间通知网站运维人员,在状态恢复后发出正常的邮件或短信通知。
Nagios Core 原先设计在Linux下运行,当然,它在其他的Unix系统下应该也能进行工作。
官方网站:http://www.nagios.org

也分为很多个Nagios版本

其中,我们看到Nagios 4.0 数字版本命名的为开源免费的版本(core开源免费也有很多版本是收费的,如上图),Nagios XI 英文版后缀再跟版本的命名为商业版本,如下图

针对于Nagios,我们需要配合许多组件和插件来工作(打开很慢,需要FQ):
https://www.nagios.org/downloads/nagios-core-frontends/ //Nagios界面很不美观,可以更换主题
https://www.nagios.org/downloads/nagios-core-addons/ //Nagios插件
https://exchange.nagios.org //各类拓展组件官方网站,包括脚本
https://exchange.nagios.org/directory/Addons //监控插件或脚本
Nagios运行模式和优点
运行模式:数据收集是C/S模式,用户查看监控信息是B/S模式
优点: 1:监控网路服务状态(HTTPD,FTP,SSH,MySql……)
2:监控主机资源(处理器符合,硬盘利用率……)
3:拓展,根据自己的需求实现拓展检测功能(插件开发)
4:自动日志回滚
5:能够定义网络主机的层次,允许逐级检查,就是从父主机开始向下检查
6:警告,基于状态的警告:OK,Warning(警告),critical(关键),unknown(未知)
7:可以支持并实现对主机的冗余监控
8:Web界面可以查看当前网络状态,通知,问题历史,日志文件等
Nagios运行原理
Nagios的功能是监控服务和主机,但是他自身并不包括这部分功能,所有的监控、检测功能都是通过各种插件来完成的。
启动Nagios后,它会周期性的自动调用插件去检测服务器状态,同时Nagios会维持一个队列,所有插件返回来的状态信息都进入队列,Nagios每次都从队首开始读取信息,并进行处理后,把状态结果通过web显示出来。
Nagios提供了许多插件,利用这些插件可以方便的监控很多服务状态。安装完成后,在nagios主目录下的/libexec里放有nagios自带的可以使用的所有插件,如,check_disk是检查磁盘空间的插件,check_load是检查CPU负载的,等等。每一个插件可以通过运行./check_xxx –h 来查看其使用方法和功能。

两张比较经典的监控图

在大规模生产环境中,如果需要浏览历史数据,需要结合db
获取数据的方式:主动发送、NRPE插件、SNMP、NSClient++

Nagios 通过NRPE 来远端管理服务
- Nagios 执行安装在它里面的check_nrpe 插件,并告诉check_nrpe 去检测哪些服务。
- 通过SSL,check_nrpe 连接远端机子上的NRPE daemon
- NRPE 运行本地的各种插件去检测本地的服务和状态(check_disk,…etc)
- 最后,NRPE 把检测的结果传给主机端的check_nrpe,check_nrpe 再把结果送到Nagios状态队列中。
- Nagios 依次读取队列中的信息,再把结果显示出来。
Nagios所需要的软件
LAP环境,不需要mysql
nagios-3.5.1.tar.gz #Nagios核心文件,Nagios服务文件,不建议用最新,很多插件没做好
nagios-plugins-2.1.1.tar.gz
#Nagios插件,用于存放脚本和命令
NSCP-0.5.0
#也就是Nsclient++,用来监控Windows,分为64位、32位版本
nrpe-2.15.tar.gz
#代理服务,用于监控非Nagios服务器的服务器本地私有信息代理
vautour_style.zip
#主题包
部署Nagios监控服务器
部署之前,需要做好最基本的环境,包括LAP环境的构建(这里直接使用yum方式安装即可,在做zabbix的时候我们需要使用我们编译的LNMP环境来做)
解决依赖和安装LAP环境
Centos7安装epel源
 [root@localhost ~]# wget -O /etc/yum.repos.d/epel.repo http://mirrors.aliyun.com/repo/epel-7.repo
[root@localhost ~]# yum clean all && yum list
[root@localhost ~]# yum -y install gcc glibc glibc-common php gd gd-devel libpng libmng libjpeg zlib
安装AP
[root@localhost ~]# yum install -y httpd php ; systemctl start httpd
[root@localhost ~]# ps -aux |grep httpd
root      17253  0.2  1.2 310400 12048 ?        Ss   16:16   0:00 /usr/sbin/httpd -DFOREGROUND
apache    17254  0.0  0.6 310400  6116 ?        S    16:16   0:00 /usr/sbin/httpd -DFOREGROUND
apache    17255  0.0  0.6 310400  6116 ?        S    16:16   0:00 /usr/sbin/httpd -DFOREGROUND
apache    17256  0.0  0.6 310400  6116 ?        S    16:16   0:00 /usr/sbin/httpd -DFOREGROUND
apache    17257  0.0  0.6 310400  6116 ?        S    16:16   0:00 /usr/sbin/httpd -DFOREGROUND
apache    17258  0.0  0.6 310400  6116 ?        S    16:16   0:00 /usr/sbin/httpd -DFOREGROUND
root      17260  0.0  0.0 112728   972 pts/0    R+   16:16   0:00 grep --color=auto httpd
修改配置文件
[root@localhost ~]# vim /etc/httpd/conf/httpd.conf
测试php是否安装成功
进入到网站的根目录
[root@localhost ~]# cd /var/www/html/
[root@localhost html]# ll
总用量 0
[root@localhost html]# pwd
/var/www/html
写一个php测试页面
[root@localhost html]# cat index.php
<?php
	phpinfo();
?>
[root@localhost html]# systemctl  restart httpd   #重启apache服务
[root@localhost html]# php -v
PHP 5.4.16 (cli) (built: Nov  1 2019 16:04:20)
Copyright (c) 1997-2013 The PHP Group
Zend Engine v2.4.0, Copyright (c) 1998-2013 Zend Technologies
在浏览器输入IP,访问,能访问就说明php.已经安装成功

Nagios运行用户
#建立Nagios用户,这里不能使用nologin的shell,nagios会用到
[root@localhost ~]# useradd nagios
[root@localhost ~]# groupadd nagcmd    #建立一个组
[root@localhost ~]# usermod -G nagcmd nagios
[root@localhost ~]# usermod -G nagcmd apache   #将Nagios和apache加入该组
[root@localhost ~]# id nagios
uid=1000(nagios) gid=1000(nagios) 组=1000(nagios),1001(nagcmd)
[root@localhost ~]# id apache
uid=48(apache) gid=48(apache) 组=48(apache),1001(nagcmd)
Nagios核心安装
[root@localhost ~]# mkdir Nagios #所有软件包放在此目录下
[root@localhost Nagios]# wget https://sourceforge.net/projects/nagios/files/nagios-3.x/nagios-3.5.1/nagios-3.5.1.tar.gz
[root@localhost Nagios]# wget http://www.nagios-plugins.org/download/nagios-plugins-2.2.1.tar.gz
[root@localhost Nagios]# wget https://sourceforge.net/projects/nagios/files/nrpe-2.x/nrpe-2.15/nrpe-2.15.tar.gz
[root@localhost Nagios]# wget https://github.com/ynlamy/vautour-style/releases/download/v1.7/vautour_style.zip
[root@localhost ~]# ll
总用量 4920
-rw-r--r--. 1 root root 1763584 8月  31 2013 nagios-3.5.1.tar.gz
-rw-r--r--. 1 root root 2728818 4月  20 2017 nagios-plugins-2.2.1.tar.gz
-rw-r--r--. 1 root root  419695 9月   7 2013 nrpe-2.15.tar.gz
-rw-r--r--. 1 root root  118282 9月   4 2018 vautour_style.zip
[root@localhost Nagios]# tar -xf nagios-3.5.1.tar.gz -C /usr/local/src/
[root@localhost Nagios]# cd /usr/local/src/nagios/
[root@localhost nagios]# ./configure --with-command-group=nagcmd
 General Options:
 -------------------------
        Nagios executable:  nagios
        Nagios user/group:  nagios,nagios   #运行用户
       Command user/group:  nagios,nagcmd   #运行组
            Embedded Perl:  no
             Event Broker:  yes
        Install ${prefix}:  /usr/local/nagios          #默认安装到了/usr/local/nagios
                Lock file:  ${prefix}/var/nagios.lock
   Check result directory:  ${prefix}/var/spool/checkresults
           Init directory:  /etc/rc.d/init.d
  Apache conf.d directory:  /etc/httpd/conf.d      #Apache的conf.d配置文件目录
             Mail program:  /bin/mail
                  Host OS:  linux-gnu

 Web Interface Options:
 ------------------------
                 HTML URL:  http://localhost/nagios/           #登陆地址
                  CGI URL:  http://localhost/nagios/cgi-bin/
 Traceroute (used by WAP):


Review the options above for accuracy.  If they look okay,
type 'make all' to compile the main program and CGIs.
[root@localhost nagios]# make all
#根据上面提示,Make all,下图出现,就无问题
*** Compile finished ***

If the main program and CGIs compiled without any errors, you
can continue with installing Nagios as follows (type 'make'
without any arguments for a list of all possible options):
#下面已经提示安装步骤,我们就使用这个步骤来操作
  make install
     - This installs the main program, CGIs, and HTML files

  make install-init
     - This installs the init script in /etc/rc.d/init.d

  make install-commandmode
     - This installs and configures permissions on the
       directory for holding the external command file

  make install-config
     - This installs *SAMPLE* config files in /usr/local/nagios/etc
       You'll have to modify these sample files before you can
       use Nagios.  Read the HTML documentation for more info
       on doing this.  Pay particular attention to the docs on
       object configuration files, as they determine what/how
       things get monitored!

  make install-webconf
     - This installs the Apache config file for the Nagios
       web interface

  make install-exfoliation    #主题相关,不需要安装
     - This installs the Exfoliation theme for the Nagios
       web interface

  make install-classicui    #主题相关,不需要安装,安装到web-conf就可以了
     - This installs the classic theme for the Nagios
       web interface


*** Support Notes *******************************************

If you have questions about configuring or running Nagios,
please make sure that you:

     - Look at the sample config files
     - Read the documentation on the Nagios Library at:
           http://library.nagios.com

before you post a question to one of the mailing lists.
Also make sure to include pertinent information that could
help others help you.  This might include:

     - What version of Nagios you are using
     - What version of the plugins you are using
     - Relevant snippets from your config files
     - Relevant error messages from the Nagios log file

For more information on obtaining support for Nagios, visit:

       http://support.nagios.com

*************************************************************

Enjoy.
[root@localhost nagios]# make install && make install-init && make install-commandmode && make install-config && make install-webconf
#若是单步执行,每次执行一部,都会提示你下一步需要干什么,非常easy
//make install #安装生成/usr/local/nagios/,其中/usr/local/nagios/share即nagiosWEB 访问界面的站点目录
//make install-init #安装生成/etc/rc.d/init.d/nagios 启动脚本
//make install-config #安装生成/usr/local/nagios/etc下的nagios相关配置文件
//make install-commandmode #设定相应nagios工作目录的权限
//make install-webconf #安装Nagios的WEB配置文件到Apache的conf.d目录下
到此时,安装过程就结束了
在安装的时候,make install生成share这个目录,这个目录是访问界面目录:
[root@localhost nagios]#  ls /usr/local/nagios/share/
config.inc.php  docs    includes   js        media       rss-corefeed.php  side.php  stylesheets
contexthelp     images  index.php  main.php  robots.txt  rss-newsfeed.php  ssi
在make install-init的时候,生成启动脚本
[root@localhost nagios]# ls /etc/init.d/nagios
/etc/init.d/nagios   #其实就是在/etc/rc.d/init.d/nagios
在make install-config的时候,生成了Nagios的相关配置文件
[root@localhost nagios]# ls /usr/local/nagios/etc/
cgi.cfg  cgi.cfg~  nagios.cfg  nagios.cfg~  objects  resource.cfg  resource.cfg~
#包括以后安装了plugin等软件后,配置文件也会放入此目录
resource.cfg:定义了很多资源变量的调用
在make install-webconf的时候,已经把web-conf的配置文件放入了/etc/httpd/conf.d/下面
[root@localhost nagios]# ls /etc/httpd/conf.d/nagios.conf
/etc/httpd/conf.d/nagios.conf    #里面配置了一个别名,直接引用了/usr/local/nagios/share目录
[root@localhost nagios]# vim /etc/httpd/conf.d/nagios.conf

Nagios主目录
[root@localhost nagios]# ll /usr/local/nagios/
总用量 4
drwxrwxr-x.  2 nagios nagios   38 10月 30 16:21 bin    #Nagios执行程序所在目录
drwxrwxr-x.  3 nagios nagios  130 10月 30 16:22 etc   #nagios配置文件所在目录,初始安装只有几个*.cfg文件
drwxrwxr-x.  2 nagios nagios    6 10月 30 16:19 libexec   #监控所用命令,需要安装了nagios-plugins插件了才会有,检测命令,不装是空的
drwxrwxr-x.  2 nagios nagios 4096 10月 30 16:21 sbin   #Nagios的Cgi文件所在目录,外部命令所需要的文件存放目录
drwxrwxr-x. 10 nagios nagios  257 10月 30 16:21 share    #Nagios前端页面
drwxrwxr-x.  5 nagios nagios   45 10月 30 16:19 var    #日志文件,pid文件等
认识一下nagios的配置文件
log_file=/usr/local/nagios/var/nagios.log   #日志位置
# OBJECT CONFIGURATION FILE(S)
# These are the object configuration files in which you define hosts,
# host groups, contacts, contact groups, services, etc.
# You can split your object definitions across several config files
# if you wish (as shown below), or keep them all in a single config file.
# You can specify individual object config files as shown below:
cfg_file=/usr/local/nagios/etc/objects/commands.cfg    #这个文件定义了很多命令
cfg_file=/usr/local/nagios/etc/objects/contacts.cfg   #定义联系人,怎么联系
cfg_file=/usr/local/nagios/etc/objects/timeperiods.cfg    #定义了时间段
cfg_file=/usr/local/nagios/etc/objects/templates.cfg  #模板(联系人,主机,时间)
# Definitions for monitoring the local (Linux) host
cfg_file=/usr/local/nagios/etc/objects/localhost.cfg   #监控本机相关配置文件
# Definitions for monitoring a Windows machine
#cfg_file=/usr/local/nagios/etc/objects/windows.cfg    #windows,默认不监控
# Definitions for monitoring a router/switch
#cfg_file=/usr/local/nagios/etc/objects/switch.cfg   #交换机路由器监控,默认不监控
# Definitions for monitoring a network printer
#cfg_file=/usr/local/nagios/etc/objects/printer.cfg  #打印机监控,默认不监控


# You can also tell Nagios to process all config files (with a .cfg
# extension) in a particular directory by using the cfg_dir
# directive as shown below:

#cfg_dir=/usr/local/nagios/etc/servers   #定义了服务合集(多个使用)
#cfg_dir=/usr/local/nagios/etc/printers  #定义了打印机合集(多个使用)
#cfg_dir=/usr/local/nagios/etc/switches   #定义了交换合集(多个使用)
#cfg_dir=/usr/local/nagios/etc/routers   #定义了路由合集(多个使用)
object_cache_file=/usr/local/nagios/var/objects.cache  资源变量配置文件,包括$USER1$变量(一个路径)等
status_update_interval=10    #状态更新时间,单位s
log_rotation_method=d        #日志滚动,默认天
service_check_timeout=60     #服务检查超时时间
host_check_timeout=30         #主机检查超时时间
event_handler_timeout=30
notification_timeout=30
ocsp_timeout=5
perfdata_timeout=5
[root@localhost nagios]# vim /usr/local/nagios/etc/cgi.cfg
//此配置文件比nagios.cfg优先级高
main_config_file=/usr/local/nagios/etc/nagios.cfg   #主配置文件
physical_html_path=/usr/local/nagios/share   #物理路径
url_html_path=/nagios               #在URL后面加上/nagios才能访问
use_authentication=1           #使用认证
use_ssl_authentication=0      #不使用ssl
authorized_for_system_information=nagiosadmin   #认证用户
Nagios访问测试
[root@localhost nagios]# systemctl restart httpd
http://10.10.100.39/nagios

需要用户名和密码,查看vim /etc/httpd/conf.d/nagios.conf配置文件
[root@localhost nagios]# vim /etc/httpd/conf.d/nagios.conf
在Directory字段里面有Auth这三个字段,那么就可以使用htpasswd来生成用户名和密码
[root@localhost nagios]# htpasswd -c /usr/local/nagios/etc/htpasswd.users nagiosadmin
New password:
Re-type new password:
Adding password for user nagiosadmin
#-c表示创建,二次添加用户,不能使用-c参数
[root@localhost nagios]# systemctl restart httpd
#再次测试(我创建用户名是nagiosadmin,密码123456)
#nagios 默认使用nagiosadmin来管理,如果使用其他用户名,对应的配置文件也要修改

检查配置文件
在nagios的目录下,bin目录下有一个nagios命令,这个命令可以帮助我们对配置文件的检查工作以及指定相关配置文件
[root@localhost nagios]# /usr/local/nagios/bin/nagios -v /usr/local/nagios/etc/nagios.cfg  #验证配置文件是否有误,着重看到下图亮点就没问题

Total Warnings: 0
Total Errors:   0
指定配置文件,以守护进程方式启动
[root@localhost nagios]# /usr/local/nagios/bin/nagios -d /usr/local/nagios/etc/nagios.cfg
但是现在还没有做任何深入配置,所以现在只是可以登录而已!
安装Nagios-plugins插件
为了后面需要,先把mysql客户端安装了
[root@localhost nagios]# yum install mysql mysql-devel
Nagios-plugins含有丰富的检测命令插件,安装完成之后放在了/usr/local/Nagios/libexec下面
[root@localhost Nagios]# tar -xvf nagios-plugins-2.2.1.tar.gz -C /usr/local/src
[root@localhost Nagios]# cd /usr/local/src/nagios-plugins-2.2.1/
[root@localhost nagios-plugins-2.2.1]# ./configure --with-nagios-user=nagios --with-nagios-group=nagcmd
[root@localhost nagios-plugins-2.2.1]# make && make install
[root@localhost Nagios]# ls /usr/local/nagios/libexec    #已经有了很多check命令
check_apt       check_file_age      check_ircd         check_nagios    check_overcr   check_spop    check_users
check_breeze    check_flexlm        check_jabber       check_nntp      check_ping     check_ssh     check_wave
check_by_ssh    check_ftp           check_load         check_nntps     check_pop      check_ssmtp   negate
check_clamd     check_http          check_log          check_nt        check_procs    check_swap    urlize
check_cluster   check_icmp          check_mailq        check_ntp       check_real     check_tcp     utils.pm
check_dhcp      check_ide_smart     check_mrtg         check_ntp_peer  check_rpc      check_time    utils.sh
check_disk      check_ifoperstatus  check_mrtgtraf     check_ntp_time  check_sensors  check_udp
check_disk_smb  check_ifstatus      check_mysql        check_nwstat    check_simap    check_ups
check_dummy     check_imap          check_mysql_query  check_oracle    check_smtp     check_uptime
启动Nagios服务,检查环境
[root@localhost Nagios]# systemctl restart httpd && /etc/init.d/nagios restart
Reloading systemd:                                         [  确定  ]
Restarting nagios (via systemctl):                         [  确定  ]
浏览器测试:登陆之后,点击hosts,可以看到,默认监控的是本机,说明环境没有什么问题

Nagios监控本服务器
配置监控之前,我们需要做一系列的准备工作
(指定主配置文件需要加载的配置文件—定义主机—定义服务 –定义监控命令—检查配置文件—启动Nagios)
监控本地NFS状态
安装nfs
[root@localhost Nagios]# yum -y install nfs-utils
[root@localhost Nagios]# systemctl start nfs
[root@localhost Nagios]# cd /usr/local/nagios/etc/objects/
[root@localhost objects]# cp localhost.cfg localhost.cfg.bak
[root@localhost objects]# vim localhost.cfg   #在配置最后添加
define service{
        use                             local-service
        host_name                       localhost
        service_description             NFS
        check_command                   check_tcp!2049  对端口检查
        }

#在使用check命令之前,要确保下/usr/local/nagios/libexec/ 目录下有没有你需要的check命令,如果有,直接调用,如果没有,检测端口来代替,检测格式: check_tcp!端口号
创建一个共享
[root@localhost objects]#  vim /etc/exports
 /tmp *(rw)
[root@localhost objects]# systemctl restart nfs
检测NFS目前是否正常
[root@localhost objects]# showmount -e 10.10.100.39
Export list for 10.10.100.39:
/tmp *
检测localhost是否正常启用
[root@localhost objects]# grep cfg_file /usr/local/nagios/etc/nagios.cfg
cfg_file=/usr/local/nagios/etc/objects/commands.cfg
cfg_file=/usr/local/nagios/etc/objects/contacts.cfg
cfg_file=/usr/local/nagios/etc/objects/timeperiods.cfg
cfg_file=/usr/local/nagios/etc/objects/templates.cfg
cfg_file=/usr/local/nagios/etc/objects/localhost.cfg    #localhost默认已经启用了
#cfg_file=/usr/local/nagios/etc/objects/windows.cfg
#cfg_file=/usr/local/nagios/etc/objects/switch.cfg
#cfg_file=/usr/local/nagios/etc/objects/printer.cfg
# object configuration files (see the cfg_file and cfg_dir options above).
检测配置文件是否有误
[root@localhost Nagios]#  /usr/local/nagios/bin/nagios -v /usr/local/nagios/etc/nagios.cfg
Total Warnings: 0
Total Errors:   0
[root@localhost objects]# /etc/init.d/nagios reload
Reloading nagios configuration (via systemctl):            [  确定  ]

[root@localhost objects]# systemctl stop nfs
再观察
这里注意,一般没回立马又显示出来状态,需要一段时间,最好最快的方法就是手动强制刷新,否则你需要等待,强制刷新,点击NFS后有一个Re-schedule the next check of this service,强制刷新

可以看到状态了
一般状态有四种颜色,如下图:

修改Nagios默认的主题:把主题包解压到对应的目录下
[root@localhost Nagios]# unzip vautour_style.zip -d /usr/local/nagios/share/
Archive:  vautour_style.zip
replace /usr/local/nagios/share/images/ack.gif? [y]es, [n]o, [A]ll, [N]one, [r]ename: A  #选择A全部覆盖
[root@localhost Nagios]# /etc/init.d/nagios restart   #重启nagios服务
Restarting nagios (via systemctl):                         [  确定  ]

Nagios监控远程MYSQL 数据库状态
【监控任何一台服务器,工作流程是定义主机,定义服务,定义命令】
nagios:10.10.100.39 mysqlsever 10.10.100.46
在46安装mysql
[root@localhost ~]# yum -y install mariadb-server mariadb
[root@localhost ~]# systemctl start mariadb
[root@localhost ~]# mysql
Welcome to the MariaDB monitor.  Commands end with ; or \g.
Your MariaDB connection id is 2
Server version: 5.5.64-MariaDB MariaDB Server

Copyright (c) 2000, 2018, Oracle, MariaDB Corporation Ab and others.

Type 'help;' or '\h' for help. Type '\c' to clear the current input statement.

MariaDB [(none)]> create database nagios;    #创建一个测试库
Query OK, 1 row affected (0.00 sec)
MariaDB [(none)]> grant select on nagios.* to nagios@'10.10.100.39' identified by 'Admin123!@#';  #授权
Query OK, 0 rows affected (0.00 sec)
在39配置nagios服务
[root@localhost Nagios]# vim /usr/local/nagios/etc/nagios.cfg    #主配置文件

# Definitions for monitoring the local (Linux) host
cfg_file=/usr/local/nagios/etc/objects/localhost.cfg
#在这两行下面添加下面两行
cfg_file=/usr/local/nagios/etc/objects/hosts.cfg    #存放远程主机
cfg_file=/usr/local/nagios/etc/objects/service.cfg   #主机服务的文件

#定义主机
[root@localhost Nagios]# vim /usr/local/nagios/etc/objects/hosts.cfg
define host{
        use          linux-server            #使用的模板名字
        host_name    localhost.localdomain             #主机名
        address     10.10.100.46             #IP地址
}
定义服务
[root@localhost Nagios]# vim /usr/local/nagios/etc/objects/service.cfg

define service{
        use                    local-service
        host_name              localhost.localdomain
        service_description     MySqlSev
        check_command        check_mysql
}
定义命令
[root@localhost Nagios]# vim /usr/local/nagios/etc/objects/commands.cfg
#check_mysql
define command{
        command_name    check_mysql
        command_line    $USER1$/check_mysql -H $HOSTADDRESS$ -u nagios -p'Admin123!@#' -d nagios
}
测试命令是否正常,可以单独拿出来在终端执行一次
[root@localhost Nagios]# /usr/local/nagios/libexec/check_mysql -H10.10.100.46 -unagios -p'Admin123!@#' -d nagios
下面就是数据库返回的信息
Uptime: 1097  Threads: 1  Questions: 8  Slow queries: 0  Opens: 0  Flush tables: 2  Open tables: 26  Queries per second avg: 0.007|Connections=4c;;; Open_files=21;;; Open_tables=26;;; Qcache_free_memory=0;;; Qcache_hits=0c;;; Qcache_inserts=0c;;; Qcache_lowmem_prunes=0c;;; Qcache_not_cached=0c;;; Qcache_queries_in_cache=0;;; Queries=9c;;; Questions=8c;;; Table_locks_waited=0c;;; Threads_connected=1;;; Threads_running=1;;; Uptime=1097c;;;
注意:所有的check_command字段中的所使用的命令,必须在command.cfg中定义好才能使用,而command.cfg中的command_line中使用的命令,必须在/usr/local/Nagios/libexec/目录下存在,安装plugins会生成
手动检测command.cfg的命令有效性
nagios启动
[root@localhost objects]# /etc/init.d/nagios start
Starting nagios (via systemctl):                           [  确定  ]

正在连接


定义监控web服务
在46上安装nginx,并启动服务
[root@localhost nginx-1.16.1]# ps -aux |grep nginx
root      38218  0.0  0.0  18248   612 ?        Ss   04:21   0:00 nginx: master process nginx
nobody    38219  0.0  0.1  18700  1324 ?        S    04:21   0:00 nginx: worker process
root      38223  0.0  0.0 112728   968 pts/0    R+   04:22   0:00 grep --color=auto nginx
在nagios上手动测试下
[root@localhost objects]# /usr/local/nagios/libexec/check_tcp -H10.10.100.46 -p 80
TCP OK - 0.001 second response time on 10.10.100.46 port 80|time=0.000882s;;;0.000000;10.000000
定义主机
[root@localhost objects]# vim hosts.cfg
define host{
        use          linux-server
        host_name    localhost.localdomain
        address     10.10.100.46
}

##上面已经定义过46的主机,此处无需再定义
定义服务
[root@localhost objects]# vim service.cfg
define service{
        use                    local-service
        host_name              localhost.localdomain
        service_description     Nginx
        check_command        check_nginx
}
定义命令
[root@localhost objects]# vim commands.cfg

define command{
        command_name    check_nginx
        command_line    $USER1$/check_tcp -H $HOSTADDRESS$ -p 80
}
检查配置
[root@localhost objects]# /usr/local/nagios/bin/nagios -v /usr/local/nagios/etc/nagios.cfg
启动nagios
[root@localhost objects]# /etc/init.d/nagios start
Starting nagios (via systemctl):                           [  确定  ]


Nagios监控外部主机私有信息
私有信息,包括默认的硬盘使用,进程数目,SWAP分区等等
私有信息,就是我需要在本机登陆操作登陆的
非私有,就是可以通过远程的方式
只有监控私有信息的时候,才调用NRPE这个插件来通信
nrpe插件
通过NRPE(一个插件)服务可以添加本地信息的监控,将数据发送到我们的Nagios服务器
NRPE两部分组成,一部分是监控机check_nrpe,一部分是被监控机的NRPE守护进程
Nagios 服务器执行check_nrpe 插件并告诉他检查哪个服务,check_nrpe 插件通过SSL 连接方式联系远程服务器上的NRPE守护进程,NRPE守护进程执行相应的插件完成指定的检查,并返回结果。
nrpe工作原理

Nrpe是基于SSL的机制,那么我们需要做的事情就是构建SSL环境,所以需要使用NRPE工作的时候,都需要安装SSL,而且服务端和客户端都需要安装nrpe软件,而我们客户端不需要安装NAGIOS服务端
客户端的NRPE安装
1:安装nagios- plugins插件
2:安装NRPE( make install-daemon-config make install-xinetd)
3:配置我们xinted服务,允许谁来拿数据
4:启动xinetd
5:查看端口是否正常启动
解决依赖
所需设备都需要安装SSL的支持
[root@localhost Nagios]# yum install -y openssl openssl-devel
[root@localhost Nagios]# tar -xf nrpe-2.15.tar.gz -C /usr/local/src
[root@localhost Nagios]# cd /usr/local/src/nrpe-2.15/
[root@localhost nrpe-2.15]# ./configure && make && make install
[root@localhost nrpe-2.15]# make install-plugin && make install-daemon   #前者安装插件,后者以守护经常来运行
[root@localhost nrpe-2.15]# ls /usr/local/nagios/libexec
/usr/local/nagios/libexec/check_nrpe    #这个命令需要安装nrpe之后才有
[root@localhost Nagios]# scp nagios-plugins-2.2.1.tar.gz nrpe-2.15.tar.gz root@10.10.100.46:/root
root@10.10.100.46's password:
nagios-plugins-2.2.1.tar.gz                                                         100% 2665KB   7.4MB/s   00:00
nrpe-2.15.tar.gz                                                                    100%  410KB  80.3MB/s   00:00
在46操作
[root@localhost ~]# useradd -s /sbin/nologin nagios
[root@localhost ~]# groupadd nagcmd
[root@localhost ~]# usermod -G nagcmd nagios
[root@localhost ~]# tar -xf nagios-plugins-2.2.1.tar.gz -C /usr/local/src/
[root@localhost ~]# tar -xf nrpe-2.15.tar.gz -C /usr/local/src/
[root@localhost ~]# cd /usr/local/src/nagios-plugins-2.2.1/
[root@localhost nagios-plugins-2.2.1]# ./configure && make && make install
[root@localhost nagios-plugins-2.2.1]# cd ../nrpe-2.15/
[root@localhost nrpe-2.15]# ./configure && make && make install
[root@localhost nrpe-2.15]# make install-daemon-config    //这里是客户端,不用make-install-plugin
[root@localhost nrpe-2.15]# make install-xinetd

# default: on
# description: NRPE (Nagios Remote Plugin Executor)
service nrpe
{
        flags           = REUSE
        socket_type     = stream
        port            = 5666
        wait            = no
        user            = nagios
        group           = nagios
        server          = /usr/local/nagios/bin/nrpe
        server_args     = -c /usr/local/nagios/etc/nrpe.cfg --inetd
        log_on_failure  += USERID
        disable         = no
        only_from       = 127.0.0.1 10.10.100.39   # #添加红色 nagios服务器地址, 允许39这台机器来连接自己的nrpe服务,多个IP地址空格分隔
}
//端口注册
[root@localhost nrpe-2.15]# echo "nrpe        5666/tcp        # NRPE" >> /etc/services
nrpe            5666/tcp                # NRPE
#/etc/services文件的作用:
#作用1:xinet.d来启动服务时他就会在/etc/services找相应服务对应的端口来启动服务。找不到对应端口,将不启动服务。
#作用2: 显示对应端口对应的协议名。
#例如 iptables  -L  不加-n参数,   查看时,把 80转   -> www  http
#作用3:查看常用端口
启动服务
[root@localhost nrpe-2.15]# systemctl restart xinetd
[root@localhost nrpe-2.15]# systemctl enable xinetd
[root@localhost nrpe-2.15]# netstat -antup | grep 5666
tcp6       0      0 :::5666                 :::*                    LISTEN      61065/xinetd
客户端nrpe命令
[root@localhost nrpe-2.15]# vim /usr/local/nagios/etc/nrpe.cfg
command[check_sda1]=/usr/local/nagios/libexec/check_disk -w 38% -c 35% -p /dev/sda1
command[check_sda2]=/usr/local/nagios/libexec/check_disk -w 42% -c 43% -p /dev/sda2
command[check_swap]=/usr/local/nagios/libexec/check_swap -w 20% -c 10%
#-w为警告 -C为告急 sda2中,我们是指剩余42%

重启
[root@localhost nrpe-2.15]# systemctl restart xinetd
在39服务手动测试
[root@localhost libexec]# /usr/local/nagios/libexec/check_nrpe -H10.10.100.46 -c check_sda1
DISK OK - free space: / 49295 MB (96.32% inode=100%); /dev 474 MB (100.00% inode=100%); /dev/shm 486 MB (100.00% inode=100%); /run 478 MB (98.42% inode=99%); /sys/fs/cgroup 486 MB (100.00% inode=100%); /home 48064 MB (99.93% inode=100%); /boot 881 MB (86.96% inode=100%); /run/user/0 97 MB (100.00% inode=100%);| /=1879MB;51175;;0;51175 /dev=0MB;474;;0;474 /dev/shm=0MB;486;;0;486 /run=7MB;486;;0;486 /sys/fs/cgroup=0MB;486;;0;486 /home=32MB;48096;;0;48096 /boot=132MB;1014;;0;1014 /run/user/0=0MB;97;;0;97
如果出现以一下错误,说明没有允许10.10.100.39 访问我们的46服务
#CHECK_NRPE: Error - Could not complete SSL handshake.
需要检查/etc/init.d/nrpe 下面的only from中的有无添加10.10.100.39
定义被监控主机
[root@localhost objects]# vim hosts.cfg
define host{
        use          linux-server
        host_name    localhost.localdomain
        address     10.10.100.46
}
现在还是监控的46,所以信息不用更改
定义需要监控的服务
[root@localhost objects]# vim service.cfg
define service{
        use                       local-service
        host_name                localhost.localdomain
        service_description         sda2_Partition
        check_command           check_nrpe!check_sda2
        }
define service{
        use                       local-service
        host_name                 localhost.localdomain
        service_description         Total Processes
        check_command           check_nrpe!check_total_procs
        }
define service{
        use                       local-service
        host_name                 localhost.localdomain
        service_description         Current Load
        check_command           check_nrpe!check_load
}
#分别是监测分区、进程总数、负载
定义NRPE监控命令
[root@localhost objects]# vim commands.cfg
define command{
        command_name    check_nrpe
        command_line    $USER1$/check_nrpe -H $HOSTADDRESS$ -c $ARG1$
        }
[root@localhost objects]# /usr/local/nagios/bin/nagios -v /usr/local/nagios/etc/nagios.cfg
Total Warnings: 0
Total Errors:   0
[root@localhost objects]# /etc/init.d/nagios start
Starting nagios (via systemctl):                           [  确定  ]
1: 服务端监控(无需NRPE)
定义主机,定义服务,定义命令,测试命令,启动
2:有NRPE的监控
定义主机,定义服务(check_nrpe!check_ping),定义命令(定义的是check_nrpe)
还有一个定义命令(客户端做 command[check_adfadf]) -w –c
安装好之后,是依赖于xinetd服务启动的
配置邮件报警
39配置
[root@localhost ~]#  yum install -y sendmail mailx -y
[root@localhost ~]# systemctl start sendmail
[root@localhost ~]# systemctl enable sendmail
#如果主机配置了多个邮件服务,设置sendmail为默认的发件服务:
alternatives --config mta
[root@localhost ~]#  cd /usr/local/nagios/etc/objects/
[root@localhost objects]# vim contacts.cfg
define contact{
        contact_name                    nagiosadmin             ; Short name of user
        use                             generic-contact         ; Inherit default values from generic-contact template (defined above)
        alias                           Nagios Admin            ; Full name of user

        email                           abcd123456@163.com           #修改成自己的邮箱
        }
开启邮件告警
[root@localhost objects]# vim /usr/local/nagios/etc/nagios.cfg
enable_notifications=1
[root@localhost objects]# /usr/local/nagios/bin/nagios -v /usr/local/nagios/etc/nagios.cfg
[root@localhost objects]# /etc/init.d/nagios start
Starting nagios (via systemctl):                           [  确定  ]
测试能否触发邮件
点击强制检测,避免时间等待
查看邮件
若要使用短信报警,可以配139邮件或者其他有短信提醒功能的邮件
Windows主机监控
1.下载安装windows代理插件
http://www.nsclient.org/download/0.3/
2.修改配置文件:

编辑NSC.INI文件
1、去掉在[modules]段里的列出模块程序的注释,除了CheckWMI.dll和RemoteConfiguration.dll;
2、最好是修改一下在[Settings]段里的’password’选项;
3、去掉在[Settings]段里的’allowed_hosts’选项注释,把Nagios服务所在主机的IP加到这一行里,或是置为空,让全部主机都可以联入;多个地址用逗号隔开
4、确认一下在[NSClient]段里的’port’选项里已经去掉注释并设置成’12489’(默认端口);
启动服务
双击nsclient++.exe 启动代理服务,并设置服务和桌面交互

查看端口

39Nagios 主控端配置:
修改主配置文件nagios.cfg,启用监控windows配置文件:
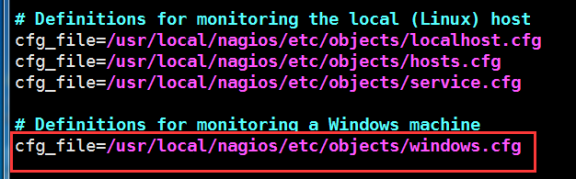
编辑这个配置文件,修改监控主机信息
[root@localhost objects]# vim /usr/local/nagios/etc/objects/windows.cfg

定义监控服务信息
[root@localhost objects]# vim /usr/local/nagios/etc/objects/service.cfg
加入下面的服务定义以监控Windows机器的启动后运行时间。
define service{
 use generic-service
host_name winserver
service_description Uptime
check_command check_nt!UPTIME
 }
 加入下面的服务定义可监控Windows机器的CPU利用率,并在5分钟CPU负荷高于90%时给出一个紧急警报或是高于80%时给出一个告警警报。
define service{
use generic-service
host_name winserver
service_description CPU Load
check_command check_nt!CPULOAD!-l 5,80,90
}
加入下面的服务定义可监控Windows机器的内存占用率,并在5分钟内存占用率高于90%时给出一个紧急警报或是高于80%时给出一个告警警报。
define service{
use generic-service
host_name winserver
service_description Memory Usage
check_command check_nt!MEMUSE!-w 80 -c 90
 }
加下面的服务定义可监控Windows机器的C:盘的磁盘利用率,并在磁盘利用率高于90%时给出一个紧急警报或是高于80%时给出一个告警警报。
define service{
use generic-service
host_name winserver
service_description C:\ Drive Space
check_command check_nt!USEDDISKSPACE!-l c -w 80 -c 90
}
加入下面的服务定义可监控Windows机器上的W3SVC服务状态,并在W3SVC服务停止时给出一个紧急警报。
define service{
use generic-service
host_name winserver
service_description W3SVC
check_command check_nt!SERVICESTATE!-d SHOWALL -l W3SVC
}

加入下面的服务定义可监控Windows机器上的Explorer.exe进程,并在进程没有运行时给出一个紧急警报。
define service{
use generic-service
host_name winserver
service_description Explorer
check_command check_nt!PROCSTATE!-d SHOWALL -l Explorer.exe
 }
定义监控命令:
[root@localhost objects]# vim /usr/local/nagios/etc/objects/commands.cfg
##这个命令已经存在,只需要添加 -s 123456 就可以指定密码。
define command{
command_name check_nt
command_line
U
S
E
R
1
USER1
USER1/check_nt -H
H
O
S
T
A
D
D
R
E
S
S
HOSTADDRESS
HOSTADDRESS -p 12489 -s 123456 -v
A
R
G
1
ARG1
ARG1
A
R
G
2
ARG2
ARG2
}
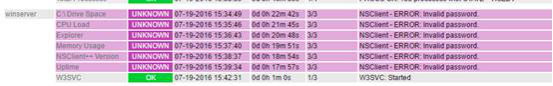
注意:这里的-s 123456 密码一定要和windows配置文件的密码保持一致,否则会出现下图这样的状态
重启动Nagios
如果修改好Nagios配置文件,需要验证你的配置文件并重启动Nagios。
如果验证配置文件过程中有什么错误信息,在做下一步前一定要修正好配置文件。一定要保证验证过程中不再有出错信息后再启动或重启动Nagios!
一站式告警管理系统:http://wiki.110monitor.com/
使用手册:
http://cdn.110monitor.com/static//images/alert/OneAlert_In_Action.pdf
安装PNP4Nagios
pnp4nagios是一款强大的工具,它可以通过process_perfdata.pl脚本调用RRDtool对nagios的性能数据进行分析并绘制成相应的性能图。Pnp4nagios使用的是RRDtool工具来实现画图的
PNP4官方下载http://docs.pnp4nagios.org/pnp-0.6/dwnld
39操作
依赖解决
[root@localhost ~]# yum install -y rrdtool php-gd perl-rrdtool perl-Time-HiRes
[root@localhost ~]# tar xvf pnp4nagios-0.6.25.tar.gz
 [root@localhost ~]#cd pnp4nagios-0.6.25
 [root@localhost pnp4nagios-0.6.25]#./configure --prefix=/usr/local/pnp4nagios --with-nagios-user=nagios --with-nagios-group=nagcmd
 [root@localhost pnp4nagios-0.6.25]#make all && make install && make install-webconf && make install-config && make install-init
 [root@localhost pnp4nagios-0.6.25]# make fullinstall
配置pnp4naigos和nagios整合
 [root@localhost pnp4nagios-0.6.25]#vim /usr/local/nagios/etc/nagios.cfg
 #修改以下几个内容
...
process_performance_data=1                      #修改
...
host_perfdata_command=process-host-perfdata         #取消注释
service_perfdata_command=process-service-perfdata
...
 [root@localhost pnp4nagios-0.6.25]#vim /usr/local/nagios/etc/objects/commands.cfg
 # 'process-host-perfdata' command definition
define command{
        command_name    process-host-perfdata
        command_line    /usr/bin/perl /usr/local/pnp4nagios/libexec/process_perfdata.pl -d HOSTPERFDATA
        }

# 'process-service-perfdata' command definition
define command{
        command_name    process-service-perfdata
        command_line     /usr/bin/perl /usr/local/pnp4nagios/libexec/process_perfdata.pl
        }
 [root@localhost pnp4nagios-0.6.25]#vim /usr/local/nagios/etc/objects/templates.cfg
 define host {
        name       host-pnp
        action_url /pnp4nagios/index.php/graph?host=$HOSTNAME$' class='tips' rel='/pnp4nagios/index.php/popup?host=$HOSTNAME$&srv=_HOST_
        register   0
        #process_perf_data       1
}

define service {
        name       srv-pnp
        action_url /pnp4nagios/index.php/graph?host=$HOSTNAME$&srv=$SERVICEDESC$' class='tips' rel='/pnp4nagios/index.php/popup?host=$HOSTNAME$&srv=$SERVICEDESC$
        register   0
        #process_perf_data       1
}
[root@localhost pnp4nagios-0.6.25]#cp ~/Nagios/pnp4nagios-0.6.25/contrib/ssi/status-header.ssi /usr/local/nagios/share/ssi/
 [root@localhost pnp4nagios-0.6.25]#vim /usr/local/nagios/etc/objects/localhost.cfg
 use                local-service,srv-pnp         ; Name of service #每一行加上,那么每一个服务就会有一个图标
 [root@localhost pnp4nagios-0.6.25]#mv /usr/local/pnp4nagios/share/install.php /usr/local/pnp4nagios/share/install.php.bak
 [root@localhost pnp4nagios-0.6.25]#chown -R nagios:nagios /var/www/html/ /usr/local/nagios/ /usr/local/pnp4nagios/
 [root@localhost pnp4nagios-0.6.25]#/etc/init.d/nagios restart; systemctl restart httpd; /etc/init.d/npcd restart
Pnp4nagios提供了各种配置文件的模板,我们需要把它正名才能使用
[
root@localhost pnp4nagios-0.6.25]#cd /usr/local/pnp4nagios/etc/
 [root@localhost etc]#mv misccommands.cfg-sample misccommands.cfg
 [root@localhost etc]#mv nagios.cfg-sample nagios.cfg
 [root@localhost etc]# mv rra.cfg-sample rra.cfg
 [root@localhost etc]#cd pages/
 [root@localhost pages]#mv web_traffic.cfg-sample web_traffic.cfg
 [root@localhost pages]#cd ../check_commands/
 [root@localhost check_commands]#mv check_all_local_disks.cfg-sample check_all_local_disks.cfg
 [root@localhost check_commands]#mv check_nrpe.cfg-sample check_nrpe.cfg
 [root@localhost check_commands]#mv check_nwstat.cfg-sample check_nwstat.cfg
启动服务
[root@localhost check_commands]# /etc/init.d/npcd restart
浏览器访问测试


检查配置文件是否正确
/usr/local/nagios/bin/nagios -v /usr/local/nagios/etc/nagios.cfg
可以自定义一个命令来代替这一长串的命令
编辑.bashrc这个文件
[root@localhost ~]# vim .bashrc
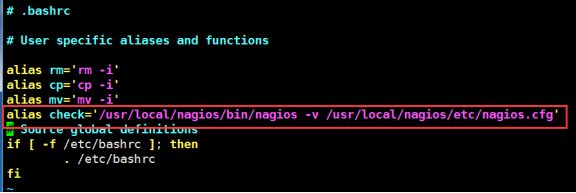
[root@localhost ~]# source .bashrc
用check代替,这样我们自定义的命令就生效了,以后只要输入check就可以检查nagios配置文件是否存在错误了,简单方便。


 87
87


 被折叠的 条评论
为什么被折叠?
被折叠的 条评论
为什么被折叠?
 到【灌水乐园】发言


