


前提
Echarts3官网
从官网下载界面选择你需要的版本下载,根据开发者功能和体积上的需求,我们提供了不同打包的下载,如果你在体积上没有要求,可以直接下载完整版本。开发环境建议下载源代码版本,包含了常见的错误提示和警告。
在 ECharts 的 GitHub 上下载最新的 release 版本,解压出来的文件夹里的 dist 目录里可以找到最新版本的 echarts 库。
通过 npm 获取 echarts,npm install echarts --save,详见“在 webpack 中使用 echarts”
cdn 引入,你可以在 cdnjs,npmcdn 或者国内的 bootcdn 上找到 ECharts 的最新版本。
绘制一个简单的图表
<!DOCTYPE html>
<html>
<head>
    <meta charset="utf-8">
    <title>ECharts</title>
    <!-- 引入 echarts.js -->
    <script src="echarts.min.js"></script>
</head>
<body>
    <!-- 为ECharts准备一个具备大小(宽高)的Dom -->
    <div id="main" style="width: 600px;height:400px;"></div>
    <script type="text/javascript">
        // 基于准备好的dom,初始化echarts实例
        var myChart = echarts.init(document.getElementById('main'));

        // 指定图表的配置项和数据
        var option = {
            title: {
                text: 'ECharts 入门示例'
            },
            tooltip: {},
            legend: {
                data:['销量']
            },
            xAxis: {
                data: ["衬衫","羊毛衫","雪纺衫","裤子","高跟鞋","袜子"]
            },
            yAxis: {},
            series: [{
                name: '销量',
                type: 'bar',
                data: [5, 20, 36, 10, 10, 20]
            }]
        };

        // 使用刚指定的配置项和数据显示图表。
        myChart.setOption(option);
    </script>
</body>
</html>
这样一个官网示例图表就诞生了。
前端显示页面
条形图:bar.html
<!DOCTYPE html>
<html lang="en">
<head>
    <meta charset="UTF-8">
    <title>ECharts</title>
    <!-- 引入 ECharts 文件 -->
    <script src="https://cdn.bootcss.com/echarts/4.2.1-rc1/echarts-en.common.js"></script>
    <script src="http://code.jquery.com/jquery-2.1.0.min.js"></script>
</head>
<body>
<!-- 为 ECharts 准备一个具备大小(宽高)的 DOM -->
<div id="main" style="width: 600px;height:400px;position:absolute;top:50%;left: 50%;margin-top: -200px;margin-left: -300px;"></div>

<script type="text/javascript">
    $(document).ready(function() {
        // 基于准备好的dom,初始化echarts实例
        var myChart = echarts.init(document.getElementById('main'));
        // 指定图表的配置项和数据
        var names=[];
        var nums=[];
        //数据加载完之前先显示一段简单的loading动画
        myChart.showLoading();
        $.ajax({
            type : "post",
            async : true,            //异步请求(同步请求将会锁住浏览器,用户其他操作必须等待请求完成才可以执行)
            url : "/EcharsShow",    //请求发送到dataActiont处
            data : {},
            dataType : "json",        //返回数据形式为json
            success : function(result) {
                //请求成功时执行该函数内容,result即为服务器返回的json对象
                if (result) {
                    for(var i=0;i<result.length;i++){
                        names.push(result[i].name);
                        nums.push(result[i].value);
                    }
                    myChart.hideLoading();    //隐藏加载动画
                    myChart.setOption(
                        {
                            title: {
                                text: '货物销售件数'
                            },
                            tooltip: {},
                            legend: {
                                data:['销量']
                            },
                            xAxis: {
                                data: names
                            },
                            yAxis: {},
                            series: [{
                                name: '销量',
                                type: 'bar',
                                data: nums
                            }]
                        }  );
                }
            },
            error : function(errorMsg) {
                //请求失败时执行该函数
                alert("图表请求数据失败!");
                myChart.hideLoading();
            }
        });//end ajax

    });//刷新方法结束

</script>
</body>
</html>
饼状图:pie.html
<!DOCTYPE html>
<html>
<head>
    <meta charset="utf-8">
    <title>ECharts</title>
    <!-- 引入 echarts.js -->
    <script src="https://cdn.bootcss.com/echarts/4.2.1-rc1/echarts-en.common.js"></script>
    <script src="http://code.jquery.com/jquery-2.1.0.min.js"></script>
</head>
<body>
<!-- 为 ECharts 准备一个具备大小(宽高)的 DOM -->
<div id="main" style="width: 600px;height:400px;border:1px dashed #000;"></div>
<script type="text/javascript">
    $(document).ready(function() {
        // 基于准备好的dom,初始化echarts实例
        var myChart = echarts.init(document.getElementById('main'));
        // 指定图表的配置项和数据
        var names=[];
        var values=[];
        //数据加载完之前先显示一段简单的loading动画
        myChart.showLoading();
        $.ajax({
            type : "post",
            async : true,            //异步请求(同步请求将会锁住浏览器,用户其他操作必须等待请求完成才可以执行)
            url : "/EcharsShow",    //请求发送到dataActiont处
            data : {},
            dataType : "json",        //返回数据形式为json
            success : function(result) {
                //请求成功时执行该函数内容,result即为服务器返回的json对象
                if (result) {
                    for(var i=0;i<result.length;i++){
                        names.push(result[i].name);
                        values.push(result[i].num);
                    }
                    myChart.hideLoading();    //隐藏加载动画
                    myChart.setOption(
                        {
                            title: {
                                text: '货物销售件数',
                                x: 'center'
                            },
                            tooltip: {
                                trigger: 'item',
                                formatter: "{a} <br/>{b} : {c} ({d}%)"
                            },
                            legend: {
                                orient: 'vertical',
                                left: 'left',
                                data: names
                            },
                            series: [
                                {
                                    name: '货物来源',
                                    type: 'pie',
                                    radius: '55%',
                                    center: ['50%', '60%'],
                                    data: result,
                                    itemStyle: {
                                        emphasis: {
                                            shadowBlur: 10,
                                            shadowOffsetX: 0,
                                            shadowColor: 'rgba(0, 0, 0, 0.5)'
                                        }
                                    }
                                }
                            ]
                        }
                    );
                }
            },
            error : function(errorMsg) {
                //请求失败时执行该函数
                alert("图表请求数据失败!");
                myChart.hideLoading();
            }
        });//end ajax

    });//刷新方法结束

</script>
</body>
</html>
后端方法实现
配置
pom.xml
<?xml version="1.0" encoding="UTF-8"?>
<project xmlns="http://maven.apache.org/POM/4.0.0" xmlns:xsi="http://www.w3.org/2001/XMLSchema-instance"
         xsi:schemaLocation="http://maven.apache.org/POM/4.0.0 https://maven.apache.org/xsd/maven-4.0.0.xsd">
    <modelVersion>4.0.0</modelVersion>
    <parent>
        <groupId>org.springframework.boot</groupId>
        <artifactId>spring-boot-starter-parent</artifactId>
        <version>2.2.0.RELEASE</version>
        <relativePath/> <!-- lookup parent from repository -->
    </parent>
    <groupId>cn</groupId>
    <artifactId>demo</artifactId>
    <version>0.0.1-SNAPSHOT</version>
    <name>demo</name>
    <description>Demo project for Spring Boot</description>

    <properties>
        <project.build.sourceEncoding>UTF-8</project.build.sourceEncoding>
        <project.reporting.outputEncoding>UTF-8</project.reporting.outputEncoding>
        <java.version>1.8</java.version>
    </properties>

    <dependencies>
        <dependency>
            <groupId>org.springframework.boot</groupId>
            <artifactId>spring-boot-starter-thymeleaf</artifactId>
        </dependency>
        <dependency>
            <groupId>org.springframework.boot</groupId>
            <artifactId>spring-boot-starter-web</artifactId>
        </dependency>
        <dependency>
            <groupId>org.springframework.boot</groupId>
            <artifactId>spring-boot-starter-test</artifactId>
            <scope>test</scope>
        </dependency>
        <!-- 添加mysql的依赖 -->
        <dependency>
            <groupId>mysql</groupId>
            <artifactId>mysql-connector-java</artifactId>
            <version>5.1.6</version><!--我装的是8.0.15,根据个人选择相应版本-->
        </dependency>
        <!-- pageHelper  用于分页 -->
        <dependency>
            <groupId>com.github.pagehelper</groupId>
            <artifactId>pagehelper-spring-boot-starter</artifactId>
            <version>1.2.4</version>
        </dependency>
        <dependency>
            <groupId>org.springframework.data</groupId>
            <artifactId>spring-data-jpa</artifactId>
            <version>2.1.10.RELEASE</version>
        </dependency>
        <dependency>
            <groupId>org.springframework.boot</groupId>
            <artifactId>spring-boot-starter-data-jpa</artifactId>
        </dependency>
        <dependency>
            <groupId>org.projectlombok</groupId>
            <artifactId>lombok</artifactId>
            <version>1.18.8</version>
        </dependency>
        <dependency>
            <groupId>org.hibernate</groupId>
            <artifactId>hibernate-entitymanager</artifactId>
            <version>5.3.6.Final</version>
        </dependency>
        <dependency>
            <groupId>junit</groupId>
            <artifactId>junit</artifactId>
            <version>4.12</version>
        </dependency>
        <dependency>
            <groupId>org.hibernate</groupId>
            <artifactId>hibernate-ehcache</artifactId>
            <version>5.3.6.Final</version>
        </dependency>
        <dependency>
            <groupId>io.springfox</groupId>
            <artifactId>springfox-swagger2</artifactId>
            <version>2.7.0</version>
        </dependency>
        <dependency>
            <groupId>io.springfox</groupId>
            <artifactId>springfox-swagger-ui</artifactId>
            <version>2.7.0</version>
        </dependency>
    </dependencies>

    <build>
        <plugins>
            <plugin>
                <groupId>org.springframework.boot</groupId>
                <artifactId>spring-boot-maven-plugin</artifactId>
            </plugin>
        </plugins>
    </build>

</project>
application.yml
因为使用的是springbootjpa,所以需要配置相关配置
server:
  port: 9999

spring:
  thymeleaf:
    prefix: classpath:/templates/
    suffix: .html
    mode: HTML5
    encoding: UTF-8
    cache: false

  resources:
    chain:
      strategy:
        content:
          enabled: true
          paths: /**
  datasource:
    driver-class-name: com.mysql.jdbc.Driver
    url: jdbc:mysql://localhost:3306/echarts?useUnicode=true&characterEncoding=utf-8&serverTimezone=UTC
    password: ****
    username: ****
  jpa:
    show-sql: true
    database: mysql
    hibernate:
      ddl-auto: update
      naming:
        implicit-strategy: org.hibernate.boot.model.naming.ImplicitNamingStrategyComponentPathImpl
        physical-strategy: org.hibernate.boot.model.naming.PhysicalNamingStrategyStandardImpl
pojo层
Echarts
@Data
@Entity
@Table(name ="echarts")
public class Echarts {
    @Id
    @GeneratedValue(strategy = GenerationType.IDENTITY)
    @Column(name = "id", unique = true, nullable = false, length = 10)
    private Integer id;
    @Column(name = "name", nullable = true, length = 255)
    private String name;
    @Column(name = "value", nullable = true, length = 10)
    private Integer value;
}
dao层
EchartsRepository
public interface EchartsRepository extends JpaRepository<Echarts, Integer> {

}
service层
EchartsService
@Service
public class EchartsService {
    @Autowired
    EchartsRepository echartsRepository;

   public List<Echarts> getAll() {
        return echartsRepository.findAll();
    }
}
controller层
EchartsController
@RestController
public class EchartsController {
    @Autowired
    EchartsService echartsService;

    @RequestMapping(value = "/bar", method = RequestMethod.GET)
    public ModelAndView firstDemo() {

        return new ModelAndView("bar");//跟templates文件夹下的bar.html名字一样,返回这个界面

    }

    @RequestMapping(value = "/pie", method = RequestMethod.GET)
    public ModelAndView courseClickCountStat() {

        return new ModelAndView("pie");//跟templates文件夹下的pie.html名字一样,返回这个界面

    }

    @Description("获取Echarts数据")
    @RequestMapping("/EcharsShow")
    @ResponseBody
    public List<Echarts> echartsShow(Model model) {
        return echartsService.getAll();
    }
}
sql文件
SET NAMES utf8mb4;
SET FOREIGN_KEY_CHECKS = 0;

-- ----------------------------
-- Table structure for echarts
-- ----------------------------
DROP TABLE IF EXISTS `echarts`;
CREATE TABLE `echarts`  (
  `id` int(10) NOT NULL,
  `name` varchar(255) CHARACTER SET utf8 COLLATE utf8_general_ci NULL DEFAULT NULL,
  `value` int(10) NULL DEFAULT NULL,
  PRIMARY KEY (`id`) USING BTREE
) ENGINE = InnoDB CHARACTER SET = utf8 COLLATE = utf8_general_ci ROW_FORMAT = Dynamic;

SET FOREIGN_KEY_CHECKS = 1;
数据这里暂不提供,还得自己动动小手添加
最终显示效果
打开浏览器运行 http://localhost:9999/bar
效果: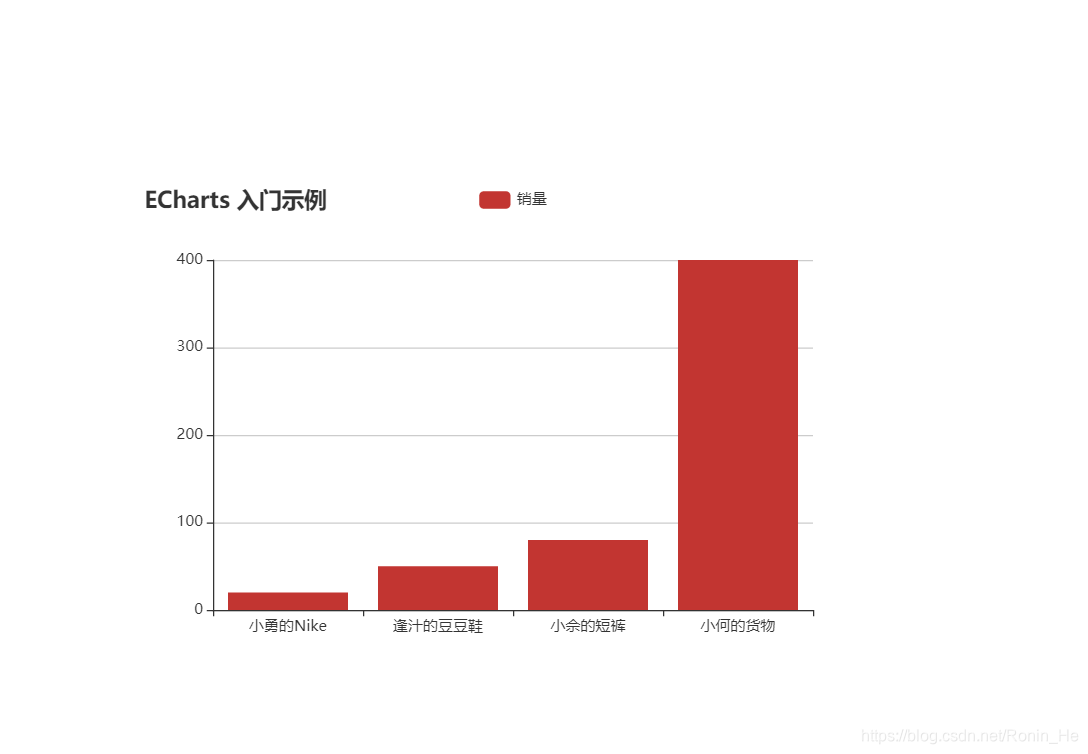 打开浏览器运行 http://localhost:9999/pie
效果: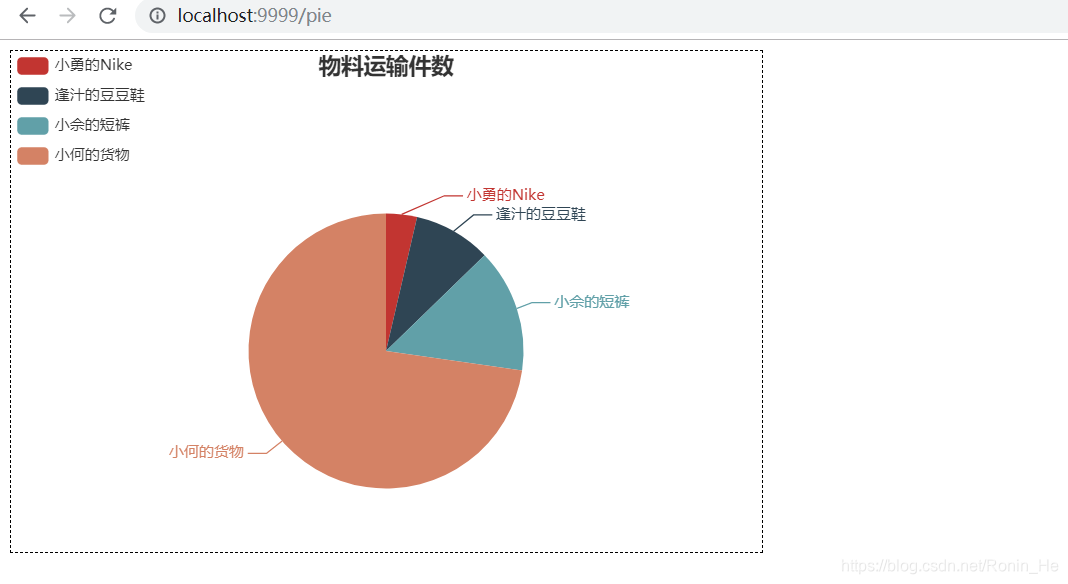


 1557
1557


 被折叠的 条评论
为什么被折叠?
被折叠的 条评论
为什么被折叠?
 到【灌水乐园】发言


