


每次切换成新图后会清除定时器和图(重新加载,否则要么会重复加载定时器。清除定时器之后要先调用一次index为0的数据)
数据样例
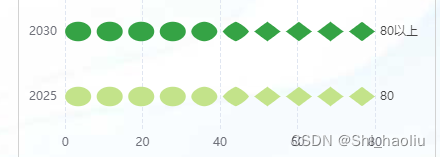
acrossBarDatas:{
	data: ["80", "80"],
	sunffix: ['单位', "单位"],
	title: "标题",
	year: ["2025", "2030"]
}
调用代码 – 因为我同时调了4个 所以传了个id
<acrossBar
echartsId="acrossBar_echarts_1"
:echartsData="acrossBarDatas"
/>
组件代码 – 动态变化的柱子还可以用其他的img图去替换,修改makeOption(type, symbol, datas) symbol的值代表了图,注意type为bar设置symbol无效
<template>
	<div>
		<div class="acrossBar_echarts" :id="echartsId"></div>
	</div>
</template>
<script>
export default {
	name: '',
	components: {},
	mixins: [],
	props: ['echartsId', 'echartsData'],
	data() {
		return {
			myChart: null,
			intervalId: null,
			options: [], // 缓存生成的图表选项
			optionIndex: 0, // 当前选项的索引
		};
	},
	computed: {},
	watch: {
		echartsData: {
			handler(to) {
				if (to) {
					this.getEcharts(to);
				}
			},
		},
	},
	mounted() {
		this.getEcharts();
	},
	methods: {
		getEcharts() {
			// 清除之前的定时器
			if (this.intervalId) {
				clearInterval(this.intervalId);
				this.intervalId = null;
			}

			// 销毁之前的图表实例
			if (this.myChart) {
				this.myChart.dispose();
			}

			var chartDom = document.getElementById(this.echartsId);
			this.myChart = this.$echarts5.init(chartDom);

			if (this.echartsData) {
				// 提前生成并缓存图表选项
				this.options = [
					this.makeOption('pictorialBar', 'circle', this.echartsData),
					this.makeOption('bar', 'triangle', this.echartsData),
					this.makeOption(
						'pictorialBar',
						'diamond',
						this.echartsData
					),
				];

				// 立即应用第一个选项
				this.myChart.setOption(this.options[this.optionIndex]);

				// 设置定时器切换图表选项
				this.intervalId = setInterval(() => {
					this.optionIndex =
						(this.optionIndex + 1) % this.options.length;
					// this.myChart.clear(); // 清除之前的图表
					this.myChart.setOption(this.options[this.optionIndex]);
				}, 2500);
			}
		},
		makeOption(type, symbol, datas) {
			// console.log(echartsData, 'echartsData');
			const labelSetting = {
				show: true,
				position: 'right',
				offset: [10, 0],
				fontSize: 16,
			};
			let echartsData = datas;
			return {
				title: {
					text: echartsData.title,
					left: 'center',
					top: 10,
					textStyle: {
						color: '#333333',
						fontWeight: 400,
						fontSize: '15px',
					},
				},
				tooltip: {
					trigger: 'axis',
					axisPointer: {
						type: 'shadow',
					},
					formatter: function(params, index) {
						let param = params[0];
						return `${param.axisValue}年<br/>${param.marker}${param.seriesName}:${param.value}%`;
					},
				},
				grid: {
					containLabel: true,
					left: 10,
					right: 60,
					top: 30,
					bottom: 15,
				},
				xAxis: {
					type: 'value',
					position: 'bottom',
					axisTick: { show: false },
					axisLine: { show: false },
					splitLine: {
						lineStyle: {
							type: 'dashed',
						},
					},
				},
				yAxis: {
					type: 'category',
					color: ['red'],
					axisLine: { show: false },
					axisLabel: { show: true },
					axisTick: { show: false },
					splitLine: { show: false },
					data: echartsData.year,
				},
				animationDurationUpdate: 500,
				series: [
					{
						name: echartsData.title,
						type: type,
						barGap: '10%',
						label: labelSetting,
						symbolRepeat: true,
						symbolSize: ['80%', '60%'],
						barWidth: '50%',
						label: {
							show: true,
							position: 'right',
							color: 'rgba(51, 51, 51, 1)',
							formatter: function(params, index) {
								return (
									params.value +
									(echartsData.sunffix[params.dataIndex] ==
									null
										? ''
										: echartsData.sunffix[params.dataIndex])
								);
							},
						},
						universalTransition: {
							enabled: true,
							delay: function(idx, total) {
								return (idx / total) * 1000;
							},
						},
						data: [
							{
								value: echartsData.data[0],
								itemStyle: {
									color: 'rgba(195, 227, 138, 1)',
								},
								symbol: symbol,
							},
							{
								value: echartsData.data[1],
								itemStyle: {
									color: 'rgba(53, 163, 69, 1)',
								},
								symbol: symbol,
							},
						],
					},
				],
			};
		},
	},
};
</script>
<style lang="less" scoped>
.acrossBar_echarts {
	width: 416px;
	height: 195px;
}
</style>


 被折叠的 条评论
为什么被折叠?
被折叠的 条评论
为什么被折叠?
 到【灌水乐园】发言


