


 本文详细分析了KOOM中如何在Java层加载特定SO文件,设置监控配置,以及C++层通过XHookhook内存分配函数来实现内存泄漏监控的过程。特别关注了ActivityLifecycle回调中的内存信息处理。
文章目录
前言
前面两篇文章分析了KOOM 中Java leak相关的使用的源码分析,这篇文章继续进行源码分析,来看看KOOM native层内存泄漏监控是怎么实现的。这次依然从官方给的Demo入手进行分析。
Java层
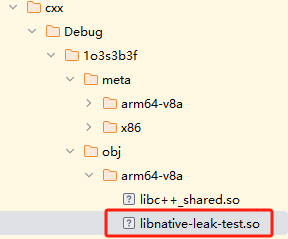
运行demo的native leak代码,在build目录会编译出so文件:
加载so
在进入activity的时候,第一件事就是加载so库:
  if (!Monitor_SoKt.loadSoQuietly("native-leak-test")) {
      throw new RuntimeException("test so load fail");
    }
点进去可以看到执行的是
loadSoInvoker = mLoadSoInvoker ?: { System.loadLibrary(it) },
版本限制
 if (Build.VERSION.SDK_INT < Build.VERSION_CODES.N
        || !Monitor_ProcessKt.isMainProcess()
        || !Monitor_ProcessKt.isArm64()) {
      MonitorLog.e(LOG_TAG, "Only Main Process and Arm64 can run LeakMonitor");
      Toast.makeText(this, "LeakMonitor NOT work!! Check OS Version/CPU ABI",
          Toast.LENGTH_SHORT).show();
      return;
    }
这里限制了一些版本,当前不是主进程、机器架构不是arm64架构或者SDK版本低于24的都不能运行。
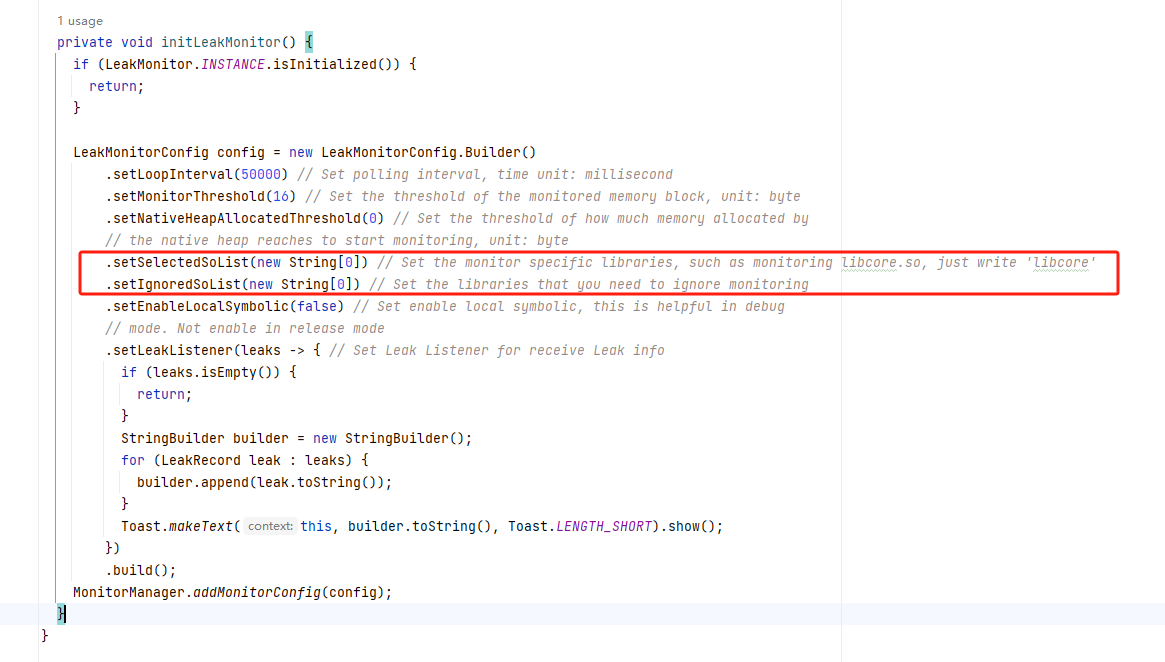
initLeakMonitor
 private void initLeakMonitor() {
    if (LeakMonitor.INSTANCE.isInitialized()) {
      return;
    }

    LeakMonitorConfig config = new LeakMonitorConfig.Builder()
        .setLoopInterval(50000) // Set polling interval, time unit: millisecond
        .setMonitorThreshold(16) // Set the threshold of the monitored memory block, unit: byte
        .setNativeHeapAllocatedThreshold(0) // Set the threshold of how much memory allocated by
        // the native heap reaches to start monitoring, unit: byte
        .setSelectedSoList(new String[0]) // Set the monitor specific libraries, such as monitoring libcore.so, just write 'libcore'
        .setIgnoredSoList(new String[0]) // Set the libraries that you need to ignore monitoring
        .setEnableLocalSymbolic(false) // Set enable local symbolic, this is helpful in debug
        // mode. Not enable in release mode
        .setLeakListener(leaks -> { // Set Leak Listener for receive Leak info
          if (leaks.isEmpty()) {
            return;
          }
          StringBuilder builder = new StringBuilder();
          for (LeakRecord leak : leaks) {
            builder.append(leak.toString());
          }
          Toast.makeText(this, builder.toString(), Toast.LENGTH_SHORT).show();
        })
        .build();
    MonitorManager.addMonitorConfig(config);
  }
也是和Java leak使用同样的设计模式,构建者模式。添加配置。
startLoop
  /**
   * Start Leak Monitor, then it will periodically detect leaks
   * Note: time-consuming, usually NOT run in UI thread.
   */
  fun start() {
    startLoop(false, true, monitorConfig.loopInterval)
  }


@Deprecated("Unfriendly API use start()", ReplaceWith("start"))
  override fun startLoop(clearQueue: Boolean, postAtFront: Boolean, delayMillis: Long) {
    throwIfNotInitialized { return }
    getLoopHandler().post(Runnable {
      if (mIsStart) {
        MonitorLog.e(TAG, "LeakMonitor already start")
        return@Runnable
      }
      mIsStart = true
      if (!nativeInstallMonitor(monitorConfig.selectedSoList,
          monitorConfig.ignoredSoList, monitorConfig.enableLocalSymbolic)) {
        mIsStart = false
        if (MonitorBuildConfig.DEBUG) {
          throw RuntimeException("LeakMonitor Install Fail")
        } else {
          MonitorLog.e(TAG, "LeakMonitor Install Fail")
          return@Runnable
        }
      }

      nativeSetMonitorThreshold(monitorConfig.monitorThreshold)
      AllocationTagLifecycleCallbacks.register()

      super.startLoop(clearQueue, postAtFront, delayMillis)
    })
  }
这里也是post一个runnable 到handler里面去。
C++ 层
执行nativeInstallMonitor来安装Monitor,看看它的JNI函数:
InstallMonitor
namespace leak_monitor {
#define FIND_CLASS(var, class_name)                      \
  do {                                                   \
    var = env->FindClass(class_name);                    \
    LOG_FATAL_IF(!var, "FindClass %s fail", class_name); \
  } while (0)

static const char *kLeakRecordFullyName =
    "com/kwai/koom/nativeoom/leakmonitor/LeakRecord";


static bool InstallMonitor(JNIEnv *env, jclass clz, jobjectArray selected_array,
                           jobjectArray ignore_array,
                           jboolean enable_local_symbolic) {
  jclass leak_record;
  FIND_CLASS(leak_record, kLeakRecordFullyName);
  g_leak_record.global_ref =
      reinterpret_cast<jclass>(env->NewGlobalRef(leak_record));
  if (!CheckedClean(env, g_leak_record.global_ref)) {
    return false;
  }
  GET_METHOD_ID(g_leak_record.construct_method, leak_record, "<init>",
                "(JILjava/lang/String;[Lcom/kwai/koom/nativeoom/leakmonitor/"
                "FrameInfo;)V");

  jclass frame_info;
  FIND_CLASS(frame_info, kFrameInfoFullyName);
  g_frame_info.global_ref =
      reinterpret_cast<jclass>(env->NewGlobalRef(frame_info));
  if (!CheckedClean(env, g_frame_info.global_ref)) {
    return false;
  }
  GET_METHOD_ID(g_frame_info.construct_method, frame_info, "<init>",
                "(JLjava/lang/String;)V");

  g_enable_local_symbolic = enable_local_symbolic;

  auto array_to_vector =
      [](JNIEnv *env, jobjectArray jobject_array) -> std::vector<std::string> {
    std::vector<std::string> ret;
    int length = env->GetArrayLength(jobject_array);

    if (length <= 0) {
      return ret;
    }

    for (jsize i = 0; i < length; i++) {
      auto str = reinterpret_cast<jstring>(
          env->GetObjectArrayElement(jobject_array, i));
      const char *data = env->GetStringUTFChars(str, nullptr);
      ret.emplace_back(data);
      env->ReleaseStringUTFChars(str, data);
    }

    return std::move(ret);
  };

  std::vector<std::string> selected_so = array_to_vector(env, selected_array);
  std::vector<std::string> ignore_so = array_to_vector(env, ignore_array);
  return CheckedClean(
      env, LeakMonitor::GetInstance().Install(&selected_so, &ignore_so));
}
通过宏自定义宏FIND_CLASS拿到LeakRecord类,这是个java类:
接着把它提升为GlobalRef。
接着调用另外一个宏:
#define GET_METHOD_ID(var, clazz, name, descriptor)  \
  do {                                               \
    var = env->GetMethodID(clazz, name, descriptor); \
    LOG_FATAL_IF(!var, "GetMethodID %s fail", name); \
  } while (0)
这里调用了构造函数,调用了LeakRecord的构造函数。
下面同样的用法,调用了FrameInfo的构造函数,来new出一个对象,是个典型native调用java的方法。
  std::vector<std::string> selected_so = array_to_vector(env, selected_array);
  std::vector<std::string> ignore_so = array_to_vector(env, ignore_array);
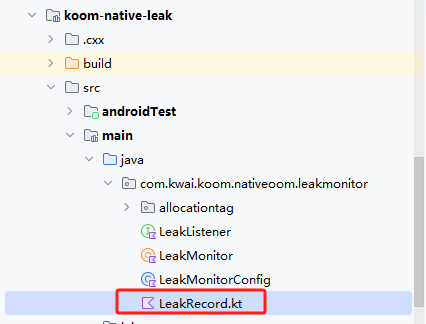
先看看LeakRecord和FrameInfo长什么样子:
@Keep
data class LeakRecord(var index: Long,
  var size: Int,
  var threadName: String,
  var frames: Array<FrameInfo>) {
  @JvmField
  var tag: String? = null

  override fun equals(other: Any?): Boolean {
    if (this === other) return true
    if (javaClass != other?.javaClass) return false

    other as LeakRecord

    if (index != other.index) return false
    if (size != other.size) return false
    if (threadName != other.threadName) return false
    if (!frames.contentEquals(other.frames)) return false
    if (tag != other.tag) return false

    return true
  }

  override fun hashCode(): Int {
    var result = index.hashCode()
    result = 31 * result + size
    result = 31 * result + threadName.hashCode()
    result = 31 * result + frames.contentHashCode()
    result = 31 * result + (tag?.hashCode() ?: 0)
    return result
  }

  override fun toString(): String = StringBuilder().apply {
    append("Activity: $tag\n")
    append("LeakSize: $size Byte\n")
    append("LeakThread: $threadName\n")
    append("Backtrace:\n")

    for ((index, line) in frames.withIndex()) {
      append("#$index pc $line\n")
    }
  }.toString()
}

@Keep
data class FrameInfo(var relPc: Long, var soName: String) {
  override fun toString(): String = "0x${relPc.toString(16)}  $soName"
}
是个数据实体类,可以看出主要是用来记录内存信息相关的数据。
接着通过lambda表达式把前面配置初始化阶段的数组给传递进去,还记得吗?在这里:
调用return方法:
  return CheckedClean(
      env, LeakMonitor::GetInstance().Install(&selected_so, &ignore_so));
执行install:
Install(实际上通过了native层的hook来实现native内存泄漏的监控)
bool LeakMonitor::Install(std::vector<std::string> *selected_list,
                          std::vector<std::string> *ignore_list) {
  KCHECK(!has_install_monitor_);

  // Reinstall can't hook again
  if (has_install_monitor_) {
    return true;
  }

  memory_analyzer_ = std::make_unique<MemoryAnalyzer>();
  if (!memory_analyzer_->IsValid()) {
    ALOGE("memory_analyzer_ NOT Valid");
    return false;
  }

  std::vector<const std::string> register_pattern = {"^/data/.*\\.so$"};
  std::vector<const std::string> ignore_pattern = {".*/libkoom-native.so$",
                                                   ".*/libxhook_lib.so$"};

  if (ignore_list != nullptr) {
    for (std::string &item : *ignore_list) {
      ignore_pattern.push_back(".*/" + item + ".so$");
    }
  }
  if (selected_list != nullptr && !selected_list->empty()) {
    // only hook the so in selected list
    register_pattern.clear();
    for (std::string &item : *selected_list) {
      register_pattern.push_back("^/data/.*/" + item + ".so$");
    }
  }
  std::vector<std::pair<const std::string, void *const>> hook_entries = {
      std::make_pair("malloc", reinterpret_cast<void *>(WRAP(malloc))),
      std::make_pair("realloc", reinterpret_cast<void *>(WRAP(realloc))),
      std::make_pair("calloc", reinterpret_cast<void *>(WRAP(calloc))),
      std::make_pair("memalign", reinterpret_cast<void *>(WRAP(memalign))),
      std::make_pair("posix_memalign",
                     reinterpret_cast<void *>(WRAP(posix_memalign))),
      std::make_pair("free", reinterpret_cast<void *>(WRAP(free)))};

  if (HookHelper::HookMethods(register_pattern, ignore_pattern, hook_entries)) {
    has_install_monitor_ = true;
    return true;
  }

  HookHelper::UnHookMethods();
  live_alloc_records_.Clear();
  memory_analyzer_.reset(nullptr);
  ALOGE("%s Fail", __FUNCTION__);
  return false;
}
这里有两个正则表达式,一个是register_pattern,这是借助了XHook开源库来hook 动态库,另外一个是ignore_pattern,忽略指定的动态库,还包括 libkoom 本身和libxhook_lib本身。
重点代码在hook内存分配的系统方法,例如malloc,realloc这些。
如果hook成功返回true。
回到startLoop方法
一直返回到startLoop方法:
  @Deprecated("Unfriendly API use start()", ReplaceWith("start"))
  override fun startLoop(clearQueue: Boolean, postAtFront: Boolean, delayMillis: Long) {
    throwIfNotInitialized { return }
    getLoopHandler().post(Runnable {
      if (mIsStart) {
        MonitorLog.e(TAG, "LeakMonitor already start")
        return@Runnable
      }
      mIsStart = true
      if (!nativeInstallMonitor(monitorConfig.selectedSoList,
          monitorConfig.ignoredSoList, monitorConfig.enableLocalSymbolic)) {
        mIsStart = false
        if (MonitorBuildConfig.DEBUG) {
          throw RuntimeException("LeakMonitor Install Fail")
        } else {
          MonitorLog.e(TAG, "LeakMonitor Install Fail")
          return@Runnable
        }
      }

      nativeSetMonitorThreshold(monitorConfig.monitorThreshold)
      AllocationTagLifecycleCallbacks.register()

      super.startLoop(clearQueue, postAtFront, delayMillis)
    })
  }
nativeSetMonitorThreshold就是设置配置的时候给的一个阈值,估计超出这个阈值就会触发dump操作。
接着执行了 AllocationTagLifecycleCallbacks.register(),
这里通过函数名也能看出来就是监听Activity生命周期状态的,代码:
object AllocationTagLifecycleCallbacks : Application.ActivityLifecycleCallbacks {
  private val mAllocationTagInfoMap = ConcurrentHashMap<String, AllocationTagInfo>()

  private var mIsRegistered = false


  fun register() {
    if (mIsRegistered) {
      return
    }
    mIsRegistered = true

    getApplication().registerActivityLifecycleCallbacks(this)
    getApplication().currentActivity?.let { onActivityCreated(it, null) }
  }

  fun unregister() {
    mIsRegistered = false

    getApplication().unregisterActivityLifecycleCallbacks(this)
    mAllocationTagInfoMap.clear()
  }

  fun bindAllocationTag(allocationInfoMap: Map<String, LeakRecord>?) {
    if (allocationInfoMap.isNullOrEmpty()) {
      return
    }

    val allocationTagInfoList = mAllocationTagInfoMap.values.toList().reversed()

    for ((_, value) in allocationInfoMap) {
      for (allocationTagInfo in allocationTagInfoList) {
        value.tag = allocationTagInfo.searchTag(value.index) ?: continue

        break
      }
    }
  }

  override fun onActivityCreated(activity: Activity, savedInstanceState: Bundle?) {
    if (mAllocationTagInfoMap.containsKey(activity.toString())) {
      return
    }

    if (isFirstActivityCreate()) {
      mAllocationTagInfoMap.clear()
    }

    mAllocationTagInfoMap[activity.toString()] = activity.toString().createAllocationTagInfo()
  }

  override fun onActivityStarted(activity: Activity) {}

  override fun onActivityResumed(activity: Activity) {}

  override fun onActivityPaused(activity: Activity) {}

  override fun onActivitySaveInstanceState(activity: Activity, outState: Bundle) {}

  override fun onActivityStopped(activity: Activity) {}

  override fun onActivityDestroyed(activity: Activity) {
    mAllocationTagInfoMap[activity.toString()]?.end()
  }

  private fun isFirstActivityCreate(): Boolean {
    for (allocationTagInfo in mAllocationTagInfoMap.values) {
      if (allocationTagInfo.endTime == -1L) {
        return false
      }
    }

    return true
  }
}
浏览一遍可以知道,主要关注的是activity的onActivityCreated和onActivityDestroyed,会拿到时间戳和是否被注册等信息。
回到Java层
还记得初始化配置的代码吗?
  private void initLeakMonitor() {
    if (LeakMonitor.INSTANCE.isInitialized()) {
      return;
    }

    LeakMonitorConfig config = new LeakMonitorConfig.Builder()
        .setLoopInterval(50000) // Set polling interval, time unit: millisecond
        .setMonitorThreshold(16) // Set the threshold of the monitored memory block, unit: byte
        .setNativeHeapAllocatedThreshold(0) // Set the threshold of how much memory allocated by
        // the native heap reaches to start monitoring, unit: byte
        .setSelectedSoList(new String[0]) // Set the monitor specific libraries, such as monitoring libcore.so, just write 'libcore'
        .setIgnoredSoList(new String[0]) // Set the libraries that you need to ignore monitoring
        .setEnableLocalSymbolic(false) // Set enable local symbolic, this is helpful in debug
        // mode. Not enable in release mode
        .setLeakListener(leaks -> { // Set Leak Listener for receive Leak info
          if (leaks.isEmpty()) {
            return;
          }
          StringBuilder builder = new StringBuilder();
          for (LeakRecord leak : leaks) {
            builder.append(leak.toString());
          }
          Toast.makeText(this, builder.toString(), Toast.LENGTH_SHORT).show();
        })
        .build();
    MonitorManager.addMonitorConfig(config);
  }
这里的LeakRecord类是不是很熟悉?
就是我们前面分析到native层new出的Java对象。在Java层通过回调监听到了泄漏发生时候的一些信息:
LeakRecord的toString方法如下:
  override fun toString(): String = StringBuilder().apply {
    append("Activity: $tag\n")
    append("LeakSize: $size Byte\n")
    append("LeakThread: $threadName\n")
    append("Backtrace:\n")

    for ((index, line) in frames.withIndex()) {
      append("#$index pc $line\n")
    }
  }.toString()
到这里我们浏览,并初略分析了总体的逻辑走向。
总结
看到到这里,我们可以大体总结一下KOOM监控native泄漏的原理:
通过加载需要监听的so,然后通过开源框架XHook来hook内存分配相关的调用函数,把hook获取到的信息回调给Java应用层,从而达到监控native内存的目的。


 2398
2398


 被折叠的 条评论
为什么被折叠?
被折叠的 条评论
为什么被折叠?
 到【灌水乐园】发言


