


option = {
tooltip: {
trigger: 'axis',
backgroundColor: 'rgba(7,20,54,0.8)',
textStyle: {
color: '#fff',
lineHeight: 100,
fontSize: 13,
},
borderColor: '#42ACEE',
formatter: (params) => {
let html = "";
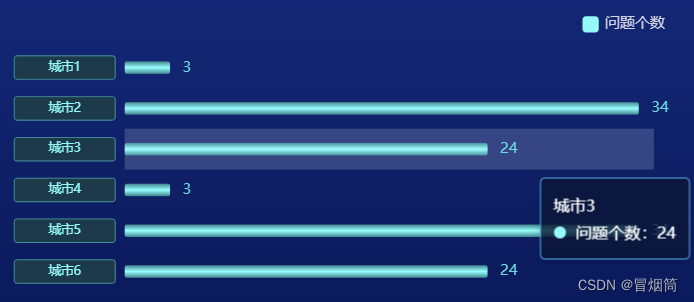
html += `${params[0].data.unitName}</br>`;
html += `<span style="display:inline-block;margin-right:4px;border-radius:10px;width:10px;height:10px;background-color:#7FFAFA"></span> 问题个数:${params[0].data.value || 0} </br>`;
return `<div style="line-height:22px">${html}</div>`;
},
axisPointer: {
type: 'shadow'
}
},
legend: {
data: ['问题个数'],
right: 20,
top: 0,
itemWidth: 13,
itemHeight: 13,
textStyle: {
color: '#CFD3E2',
fontSize: 12,
},
itemStyle: {
borderWidth: 0,
borderRadius: 0,
color: '#7FFAFA',
},
lineStyle: {
type: 'solid'
}
},
grid: {
top: '12%',
left: '6%',
right: '6%',
bottom: '1%',
containLabel: true
},
xAxis: {
show: false,
type: 'value',
},
yAxis: [{
type: 'category',
inverse: true,
axisLabel: {
show: true,
color: '#7FFAFA',
borderWidth: .8,
borderColor: '#318F9A',
borderType: 'solid',
height: 18,
width: 80,
// lineHeight : 30,
fontSize: 10,
borderRadius: 2,
margin: 48,
verticalAlign: 'middle',
align: 'center',
backgroundColor: '#163A4B',
},
splitLine: {
show: false,
},
axisTick: {
show: false,
},
axisLine: {
show: false,
},
data: cityData,
}],
series: [
{
name: '问题个数',
type: 'bar',
barWidth: '10', // 统计条宽度
// barGap: '50%',
zlevel: 1,
itemStyle: {
color: new echarts.graphic.LinearGradient(0, 0, 0, 1, [
{offset: 0, color: '#318690'},
{offset: 0.5, color: '#83FFFE'},
{offset: 1, color: '#318690'}
]),
borderRadius: 2,
},
label: {
normal: {
color: '#4FDCE0',
show: true,
distance: 10,
fontSize: '12',
position: 'right',
},
},
data: data1
},
],
dataZoom: [
{
type: 'inside',
startValue: 0, // 从头开始。
yAxisIndex : 0,
endValue: 5, // 一次性展示N+1个。
zoomOnMouseWheel: false, // 关闭滚轮缩放
moveOnMouseWheel: true, // 开启滚轮平移
moveOnMouseMove: true // 鼠标移动能触发数据窗口平移
}
]
};
import highcharts from "highcharts";
import highcharts3d from "highcharts/highcharts-3d";
highcharts3d(highcharts);
chartOptions = {
	colors: ['#4DBFFF', '#00D7E9'],
	chart: {
		type: 'pie',
		options3d: {
			enabled: true,
			alpha: 45
		},
		backgroundColor: 'RGBA(23, 31, 52, 0)'
	},
	credits: {//右下角的文本
		enabled: false,
	},
	title: {
		show: false,
		text: ''
	},
	legend: {
		align: 'center',
		verticalAlign: 'middle'
	},
	plotOptions: {
		pie: {
			innerSize: 0,
			dataLabels: {
				// enabled: false,
				color: '#00D7E9',
				connectorColor: '#fff',
				distance: 20,
				formatter() {
					// return this.key + " " +  this.y + " " + this.point.val + '%'
					let html = "";
					html += `<span style="color: ${this.color}">${this.key}</span> `;
					html += `<span style="color:#fff;">${this.y}</span></br>`;
					return `<div style="line-height:22px;font-size: 13px">${html}</div>`;
				},
			}
		}
	},
	series: [{
		name: '问题数量',
		type: 'pie',
		depth: 35,
		slicedOffset: 30,
		data: dataList
	}]
}
option = {
tooltip: {
trigger: 'axis',
backgroundColor: 'rgba(7,20,54,0.8)',
textStyle: {
color: '#fff',
lineHeight: 100,
fontSize: 13,
},
borderColor: '#42ACEE',
formatter: (params) => {
let html = "";
html += `${params[0].data.areaName}</br>`;
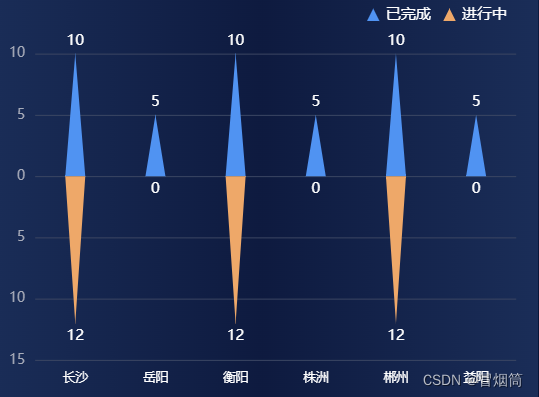
html += `<span style="display:inline-block;margin-right:4px;border-radius:10px;width:10px;height:10px;background-color:#3A90F7"></span> 已完成:${params[0].data.value || 0} </br>`;
html += `<span style="display:inline-block;margin-right:4px;border-radius:10px;width:10px;height:10px;background-color:#F5A961"></span> 进行中:${Math.abs(params[1].data.value) || 0} </br>`;
return `<div style="line-height:22px">${html}</div>`;
},
axisPointer: {
type: 'shadow'
}
},
legend: {
data: ['已完成', '进行中'],
right: 20,
top: -4,
itemWidth: 10,
itemHeight: 10,
borderRadius: 5,
textStyle: {
color: '#fff',
fontSize: 12,
},
},
grid: {
top: '12%',
left: '4%',
right: '4%',
bottom: '4%',
containLabel: true
},
xAxis: {
type: 'category',
data: cityData,
axisLabel: {
color: '#ffffff',
fontSize: 10,
width: 50,
interval: 0,
lineHeight: 14,
overflow: 'break',
margin: 8,
},
axisTick: {
show: false
},
axisLine: {
show: false,
lineStyle: {
width: '1',
color: '#465569',
dashOffset: 10,
}
},
// z: 10
},
yAxis: [
{
position: 'left',
axisLine: {
show: false,
lineStyle: {
width: '1',
color: '#465569',
dashOffset: 10,
}
},
axisTick: {
show: false
},
axisLabel: {
fontSize: 11,
color: '#A8ADBB',
formatter: function (value) {
return Math.abs(value) || 0;
}
},
splitLine: {
show: true,
lineStyle: {
width: '0.8',
color: '#384564',
dashOffset: 10,
// type: 'dashed'
}
},
},
],
series: [
{
name: '已完成',
type: 'pictorialBar',
symbol: 'path://M0,10 L10,10 L5,0 L0,10 z',
barWidth: '16', // 统计条宽度
barGap: '50%',
itemStyle: {
color: '#3A90F7',
},
label: {
color: '#ffffff',
show: true,
distance: 4,
fontSize: '12',
position: 'top',
},
stack: 'one',
data: data1
},
{
name: '进行中',
type: 'pictorialBar',
symbol: 'path://M0,10 L10,10 L5,0 L0,10 z',
barWidth: '16', // 统计条宽度
itemStyle: {
color: '#F5A961',
borderRadius: 4,
},
label: {
color: '#ffffff',
show: true,
distance: 4,
fontSize: '12',
position: 'bottom',
formatter: function (params) {
return params.data.ingTolmple ? Math.abs(params.data.ingTolmple) : 0;
}
},
stack: 'one',
data: data2
},
],
dataZoom: [
{
type: 'inside',
startValue: 0, // 从头开始。
endValue: 9, // 一次性展示N+1个。
zoomOnMouseWheel: false, // 关闭滚轮缩放
moveOnMouseWheel: true, // 开启滚轮平移
moveOnMouseMove: true // 鼠标移动能触发数据窗口平移
}
]
};更新中...


 被折叠的 条评论
为什么被折叠?
被折叠的 条评论
为什么被折叠?
 到【灌水乐园】发言


