


一、GridSpec的具体使用
1.1:GridSpec:matplotlib 的 gridspec 模块是专门指定画布中子图位置的模块,该模块中包含 一个 GridSpec类,通过显式地创建GridSpec类对象来自定义画布中子图的布 局结构,使得子图能够更好地适应画布
1.2:GridSpec类的语法:
GridSpec(nrows, ncols, figure=None, left=None, bottom=None, right=None, top=None, hspace=None, wspace=None, width_ratios=None, height_ratios=None)
nrow:表示行数
ncols:表示列数
figure:表示布局的画布
left,bottom,right,top:表示子图的范围
wspace:表示子图之间预留的宽度量
hspace:表示子图之间预留的高度量
二、使用GridSpec()方法创建子图的布局结构
1.导入模块
%matplotlib auto
import numpy as np
import matplotlib.pyplot as plt
import matplotlib.gridspec as gridspec
2.创建画布实例
fig = plt.figure()3.创建“区域规划图”实例(GridSpec实例)
spec = gridspec.GridSpec(nrows=2,
ncols=2,
figure=fig,
#hspace=2, #坐标系实例之间纵向间距
#wspace=2, #坐标系实例之间横向间距
#left=0.25,right=0.9,top=0.9,bottom=0.25, #把所有坐标实例打包在一起,整体伸缩/平移
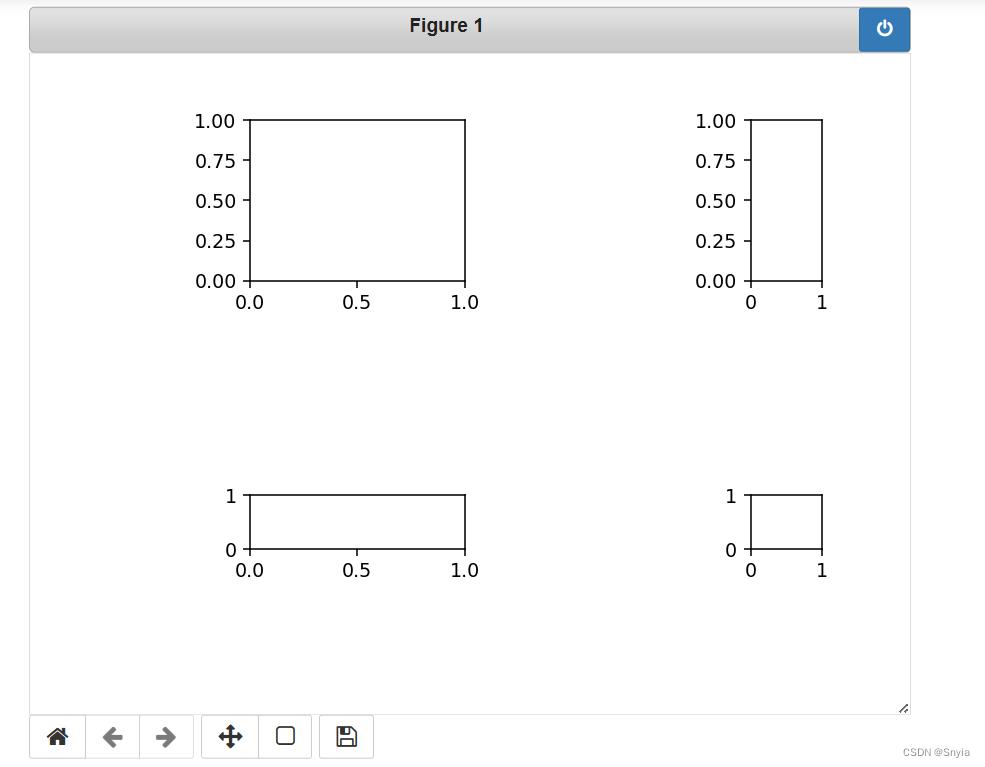
width_ratios=[3,1], #设置坐标系的相对宽度(每个坐标系宽度=设定值/sum(设定值))
height_ratios=[3,1] #设置坐标系的相对高度(每个坐标系宽度=设定值/sum(设定值))
)width_ratios 设置坐标系的相对宽度(每个坐标系宽度=设定值/sum(设定值))
height_ratios 设置坐标系的相对高度(每个坐标系宽度=设定值/sum(设定值))
4.根据给定的"区域规划图",创建对应的坐标系实例
ax1 = fig.add_subplot(spec[0,0])       # 二维数组的索引操作
ax2 = fig.add_subplot(spec[0,1])       #二维数组索引操作
ax3 = fig.add_subplot(spec[1,0])
ax4 = fig.add_subplot(spec[1,1])
5.展示图表
plt.show() 示例代码:
#导入模块
%matplotlib auto
import numpy as np
import matplotlib.pyplot as plt
import matplotlib.gridspec as gridspec
#创建画布实例
fig = plt.figure()
#创建“区域规划图”实例(GridSpec实例)
spec = gridspec.GridSpec(nrows=2,
                         ncols=2,
                         figure=fig,
#                       hspace=2,                                 #坐标系实例之间纵向间距
#                       wspace=2,                                 #坐标系实例之间横向间距
#                       left=0.25,right=0.9,top=0.9,bottom=0.25,  #把所有坐标实例打包在一起,整体伸缩/平移
                        width_ratios=[3,1],                      #设置坐标系的相对宽度(每个坐标系宽度=设定值/sum(设定值))
                        height_ratios=[3,1]                      #设置坐标系的相对高度(每个坐标系宽度=设定值/sum(设定值))
                      )
#根据给定的"区域规划图",创建对应的坐标系实例
ax1 = fig.add_subplot(spec[0,0])       # 二维数组的索引操作
ax2 = fig.add_subplot(spec[0,1])
ax3 = fig.add_subplot(spec[1,0])
ax4 = fig.add_subplot(spec[1,1])
#展示图表
plt.show()
运行结果:

添加 left,right,top,bottom
left,right,top,bottom 把所有坐标实例打包在一起,整体伸缩/平移
spec = gridspec.GridSpec(nrows=2,
                         ncols=2,
                         figure=fig,
                       hspace=2,                                 #坐标系实例之间纵向间距
                       wspace=2,                                 #坐标系实例之间横向间距
                       left=0.25,right=0.9,top=0.9,bottom=0.25,  #把所有坐标实例打包在一起,整体伸缩/平移
                        width_ratios=[3,1],                      #设置坐标系的相对宽度(每个坐标系宽度=设定值/sum(设定值))
                        height_ratios=[3,1]                      #设置坐标系的相对高度(每个坐标系宽度=设定值/sum(设定值))
                      )
示例代码:
#导入模块
%matplotlib auto
import numpy as np
import matplotlib.pyplot as plt
import matplotlib.gridspec as gridspec
#创建画布实例
fig = plt.figure()
#创建“区域规划图”实例(GridSpec实例)
spec = gridspec.GridSpec(nrows=2,
                         ncols=2,
                         figure=fig,
                       hspace=2,                                 #坐标系实例之间纵向间距
                       wspace=2,                                 #坐标系实例之间横向间距
                       left=0.25,right=0.9,top=0.9,bottom=0.25,  #把所有坐标实例打包在一起,整体伸缩/平移
                        width_ratios=[3,1],                      #设置坐标系的相对宽度(每个坐标系宽度=设定值/sum(设定值))
                        height_ratios=[3,1]                      #设置坐标系的相对高度(每个坐标系宽度=设定值/sum(设定值))
                      )
#根据给定的"区域规划图",创建对应的坐标系实例
ax1 = fig.add_subplot(spec[0,0])       # 二维数组的索引操作
ax2 = fig.add_subplot(spec[0,1])
ax3 = fig.add_subplot(spec[1,0])
ax4 = fig.add_subplot(spec[1,1])
#展示图表
plt.show()
运行结果:
三、使用add_gridspec0方法向画布添加布局结构
1.导入模块
%matplotlib auto
import numpy as np
import matplotlib.pyplot as plt
import matplotlib.gridspec as gridspec
2.创建画布实例
fig = plt.figure()3.创建“区域规划图”实例(GridSpec实例)
spec = gridspec.GridSpec(nrows=2,
                         ncols=2,
                         figure=fig,
                       hspace=2,                                 #坐标系实例之间纵向间距
                       wspace=2,                                 #坐标系实例之间横向间距
                       left=0.25,right=0.9,top=0.9,bottom=0.25,  #把所有坐标实例打包在一起,整体伸缩/平移
                        width_ratios=[3,1],                      #设置坐标系的相对宽度(每个坐标系宽度=设定值/sum(设定值))
                        height_ratios=[3,1]                      #设置坐标系的相对高度(每个坐标系宽度=设定值/sum(设定值))
                      )
4.根据给定的"区域规划图",创建对应的坐标系实例
gs = fig.add_gridspec(3,3)
ax1 = fig.add_subplot(gs[0,:])
ax1.set_title('gs[0, :]')
ax2 = fig.add_subplot(gs[1,:-1])
ax2.set_title('gs[1, :-1]')
ax3 = fig.add_subplot(gs[1:,-1])
ax3.set_title('gs[1:,-1]')
ax4 = fig.add_subplot(gs[-1,0])
ax4.set_title('gs[-1,0]')
ax5 = fig.add_subplot(gs[-1,-2])
ax5.set_title('gs[-1,-2]')
5.展示图表
plt.tight_layout()
plt.show()
plt.tight_layout() 自动调整子图参数
示例代码:
#导入模块
%matplotlib auto
import numpy as np
import matplotlib.pyplot as plt
import matplotlib.gridspec as gridspec
#创建画布实例
fig = plt.figure()
#创建“区域规划图”实例(GridSpec实例)
spec = gridspec.GridSpec(nrows=2,
                         ncols=2,
                         figure=fig,
                       hspace=2,                                 #坐标系实例之间纵向间距
                       wspace=2,                                 #坐标系实例之间横向间距
                       left=0.25,right=0.9,top=0.9,bottom=0.25,  #把所有坐标实例打包在一起,整体伸缩/平移
                        width_ratios=[3,1],                      #设置坐标系的相对宽度(每个坐标系宽度=设定值/sum(设定值))
                        height_ratios=[3,1]                      #设置坐标系的相对高度(每个坐标系宽度=设定值/sum(设定值))
                      )
#根据给定的"区域规划图",创建对应的坐标系实例
gs = fig.add_gridspec(3,3)
ax1 = fig.add_subplot(gs[0,:])
ax1.set_title('gs[0, :]')
ax2 = fig.add_subplot(gs[1,:-1])
ax2.set_title('gs[1, :-1]')
ax3 = fig.add_subplot(gs[1:,-1])
ax3.set_title('gs[1:,-1]')
ax4 = fig.add_subplot(gs[-1,0])
ax4.set_title('gs[-1,0]')
ax5 = fig.add_subplot(gs[-1,-2])
ax5.set_title('gs[-1,-2]')
#展示图表
plt.tight_layout()
plt.show()
运行结果:


 721
721

 被折叠的 条评论
为什么被折叠?
被折叠的 条评论
为什么被折叠?
 到【灌水乐园】发言


