如果你想找的是求最大回撤的算法,请跳转:[Python] 使用动态规划求解最大回撤详解
【Python】基金/股票 最大回撤率计算与绘图详解(附源码和数据)
0. 起因
前一段时间投了一家金融公司的Python开发工程师,让我做以下事情:
- 以月为窗口,挑选一只基金or股票,查看它近2年最大回撤率;
- 找到从08年-至今的金融危机时间段,并呈现在这些危机时间段内,该基金or股票的历次回撤率。
给了3天时间,代码我1天不到就写完了,写完之后我就去做自己的项目了,沉迷技术无法自拔~~~
3天过后,没想到打电话过来的是产品经理,完全不问代码的事情,问我平时是怎么学习的;问我有没有考虑为什么要分析这些东西;问我以后的方向;问我学习中遇到过的最大的问题是什么,我说了我最近做的一个网站遇到的问题;
我觉得自己答的都还不错,也许是没答到人家内心里去吧,问了几个问题之后,我感觉人家貌似情绪有点不对了。隔了几天才收到技术面,问的都是NumPy和Pandas,因为几个月前学的还不错,加上问的比较基础(没有涉及到时间序列和透视表那些),所以大部分问题都答上来了。不过还是没有收到Offer,缘分未到~
言归正传,我选了一家老牌的基金 github 源码和数据
1. 大成沪深300指数A 519300 最大回撤率分析
数据来源:http://fund.eastmoney.com/519300.html?spm=search
天天基金官网:大成沪深300指数A 519300
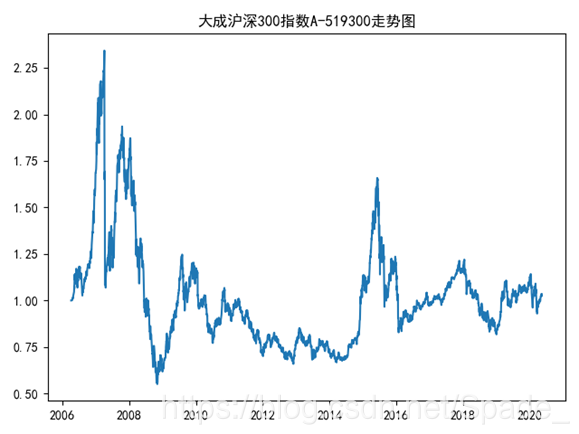
0. 基金走势图 2007 - 2020
官网上分析数据接口,清洗数据之后,我绘制出来的图 2006 - 2020
1. 以月为窗口,挑选一只基金or股票,查看它近2年最大回撤率;
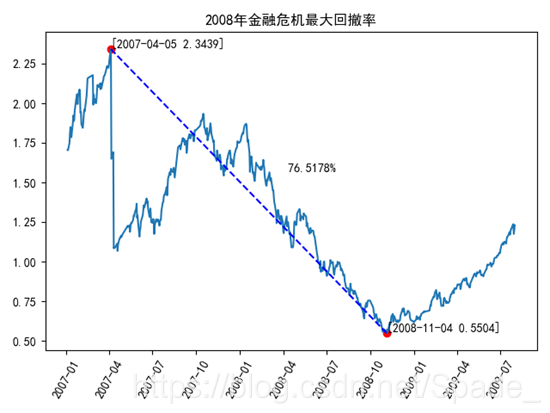
2.找到从08年-至今的金融危机时间段,并呈现在这些危机时间段内,该基金or股票的历次回撤率。
很多基金成立年限都不高,没有经历过金融危机,这只基金是我找了些资料才找出来的,成立了14个年头。
2. 绘制走势图和最大回撤的函数封装
封装了两个函数,一个用于绘制走势图,一个用于绘制走势图和回撤率。效果如下:
import matplotlib.pyplot as plt
import pylab as pl
def draw_trend_chart(xs, ys, title):
""" 根据数据绘制折线走势图 """
plt.rcParams['font.sans-serif'] = ['SimHei']
plt.rcParams['axes.unicode_minus'] = False
plt.plot(xs, ys) # 根据数据绘制折线走势图
plt.title(title)
plt.show()
def draw_trend_and_withdraw(xs, ys, title, max_x, max_y, show_max_str, min_x, min_y, show_min_str,
withdraw, withdraw_x=None, withdraw_y=None, x_ticks_rotation=None):
""" 根据数据绘制折线走势图和最大回撤信息 """
"""
xs: x轴数组
ys: y轴数组
title: 走势图标题
max_x, max_y: 最大回撤最高点的x值和y值
min_x, min_y: 最大回撤最低点的x值和y值
show_max_str: 最大回撤最高点的标记提示
show_min_str: 最大回撤最低点的标记提示
withdraw: 最大回撤值
withdraw_x: 最大回撤值提示点的x值
withdraw_y: 最大回撤值提示点的y值
"""
plt.rcParams['font.sans-serif'] = ['SimHei']
plt.rcParams['axes.unicode_minus'] = False
plt.plot(xs, ys) # 根据数据绘制折线走势图
plt.title(title)
plt.scatter(min_x, min_y, color='r') # 标记最低点
plt.scatter(max_x, max_y, color='r') # 标记最高点
plt.annotate(show_min_str, xytext=(min_x, min_y), xy=(min_x, min_y)) # 标记提示
plt.annotate(show_max_str, xytext=(max_x, max_y), xy=(max_x, max_y)) # 标记提示
plt.plot([min_x, max_x], [min_y, max_y], color='b', linestyle='--') # 连接最低净值点和最高净值点
if withdraw_x is None or withdraw_y is None:
plt.annotate(withdraw, xytext=((max_x + min_x) / 2, (max_y + min_y) / 2), xy=((max_x + min_x) / 2, (max_y + min_y) / 2)) # 标记提示
else:
plt.annotate(withdraw, xytext=(withdraw_x, withdraw_y), xy=(withdraw_x, withdraw_y)) # 标记提示
if x_ticks_rotation is not None: # 旋转 x 轴的标记
pl.xticks(rotation=60)
plt.show()
if __name__ == '__main__':
xs = range(0, 9)
arr = [3, 7, 2, 6, 4, 1, 9, 8, 5]
_max, _min = 1, 5 # 最高点索引和最低点索引
max_rate = 6 # 最大回撤
draw_trend_chart(xs, arr, title=f'{arr}')
draw_trend_and_withdraw(list(range(0, 9)), arr, f'{arr}', _max, arr[_max], f'最高点索引:{_max}',
_min, arr[_min], f'最低点索引:{_min}', max_rate)
3. 从0到1分析最大回撤率
0. 求取最大回撤的函数
除了两个绘图函数,还有求最大的回撤的函数:
def _withdraw_with_high_low(arr):
""" 传入一个数组,返回最大回撤和对应的最高点索引、最低点索引 """
_dp = 0 # 使用 _dp 表示 i 点的最大回撤
i_high = 0 # 遍历时,0 ~ i - 1 中最高的点的索引,注意是索引
# 全局最大回撤和对应的最高点和最低点的索引,注意是索引
g_withdraw, g_high, g_low = float('-inf'), -1, -1
for i in range(1, len(arr)):
# 注意:此处求的是
if arr[i_high] < arr[i-1]: # 若 0 ~ i - 1 中最高的点小于当前点
i_high = i-1 # 0 ~ i - 1 中最高的点的索引
_dp = arr[i_high] - arr[i] # _dp 表示 i 点的最大回撤
if _dp > g_withdraw: # 找到新的最大回撤,更新三个值
g_withdraw = _dp
g_high = i_high
g_low = i
return g_withdraw, g_high, g_low
1. 读取数据并绘制走势图
'''
数据来源:http://fund.eastmoney.com/519300.html?spm=search
天天基金官网:大成沪深300指数A 519300
'''
import pandas as pd
from fengzhuang import draw_trend_chart # 导入绘图函数
# 读取数据
df = pd.read_csv('大成沪深300指数A-519300.txt', sep='\t', header=None, names=['x', 'y', 'equityReturn'])
df.index = pd.to_datetime(df.x) # 使用x时间列为索引列,定位快
df = df.drop(['x', 'equityReturn'], axis=1) # 删除x列和equityReturn列。equityReturn表示权益回报,我们不关心。
draw_trend_chart(df.index, df.y, '大成沪深300指数A-519300走势图')
2. 计算每个月的最大回撤率和对应的最高点、最低点
# 存储各个月份的日期、最大回撤最高点的值和最低点的值、最大回撤、最大回撤率
res = []
# 先按年分组,再按月分组
for indexs, groupby_year_month in df.groupby([df.index.year, df.index.month]):
_ = list(groupby_year_month['y'].values) # 单个月份的净值列表
# 求最大回撤率、最高点索引、最低点索引
_withdraw, _max, _min = _withdraw_with_high_low(_)
# t为一个月的五个值,分别是日期、最大回撤最高点的值和最低点的值、最大回撤、最大回撤率
t = [groupby_year_month.index[0], _[_max], _[_min], _[_max] - _[_min], (_[_max] - _[_min]) / _[_max] * 100]
# date、max、min、diff、rate
res.append(t)
# 转DataFrame
result = pd.DataFrame(res, columns=["date", "max", "min", "diff", "rate"])
# 只保留年月
result['date'] = result['date'].apply(lambda x : datetime.datetime.strftime(x, "%Y-%m"))
# 日期列转为索引
result.index = pd.to_datetime(result['date'])
# 删除日期列
result = result.drop(['date'], axis=1)
print(result)
max min diff rate
date
2006-04-01 1.0124 1.0098 0.0026 0.256815
2006-05-01 1.1422 1.0909 0.0513 4.491333
2006-06-01 1.1711 1.0689 0.1022 8.726838
2006-07-01 1.1825 1.0826 0.0999 8.448203
2006-08-01 1.0724 1.0263 0.0461 4.298769
... ... ... ... ...
2020-01-01 1.1424 1.0400 0.1024 8.963585
2020-02-01 1.0749 1.0255 0.0494 4.595776
2020-03-01 1.0909 0.9295 0.1614 14.795123
2020-04-01 1.0073 0.9938 0.0135 1.340216
2020-05-01 1.0354 1.0254 0.0100 0.965810
[170 rows x 4 columns]
3. 绘制以月为窗口近两年的最大回撤率
绘图如下:
前面我们已经按月求出来了每个月的最大的回撤和回撤率、最高点和最低点,我们现在要做的就是取近两年的时间。
先取得近两年的时间,求取相对时间的函数,详见 [Python] 获取前一日/周/月/年或相对任意时间:
from dateutil.relativedelta import relativedelta
import datetime
def relative_time(use_now=True, date_string=None, date_format=None, years=0, months=0, days=0, leapdays=0, weeks=0, hours=0, minutes=0, seconds=0, microseconds=0):
""" 相对时间,相对于当前或者某一个时间的时间 """
"""
relative_time(use_now=True) # 现在
relative_time(use_now=True, days=-1) # 昨天的现在
relative_time(use_now=True, years=-1) # 一年前的现在
relative_time(use_now=True, days=-1, months=-1) # 上个月的前一天
relative_time(use_now=False, date_string='2020-09-30 12:00:00', date_format="%Y-%m-%d %H:%M:%S", days=1) # 2020-09-30 12:00:00后一天
relative_time(use_now=False, date_string='2020-09-30', date_format="%Y-%m-%d", years=-1, weeks=2)) # 2020-09-30 前一年的后两星期
使用详见: https://blog.csdn.net/Spade_/article/details/109170585
"""
relative_delta = relativedelta(years=years, months=months, days=days, leapdays=leapdays, weeks=weeks, hours=hours,
minutes=minutes, seconds=seconds, microseconds=microseconds)
_date = datetime.datetime.now() if use_now else datetime.datetime.strptime(date_string, date_format)
return (_date + relative_delta).strftime("%Y-%m-%d %H:%M:%S")
我们直接调用该函数,就可以很轻易取得当前时间和相对于现在两年前的时间:
'''
1、以月为窗口,挑选一只基金or股票,查看它近2年最大回撤率;
'''
# 取近两年
today = relative_time(use_now=True)
two_year_ago = relative_time(use_now=True, years=-2)
near_two_year_df = result[(result.index >= two_year_ago)]
# 以月为窗口的最大回撤率
print(f'以月为窗口,近2年最大回撤率: {round(near_two_year_df["rate"].max(), 4)}%')
# 以月为窗口的回撤率绘图
draw_trend_chart(near_two_year_df.index, near_two_year_df['rate'], '大成沪深300指数A-519300 近两年的月回撤率')
输出结果:
以月为窗口,近2年最大回撤率: 14.7951%
4. 08年金融危机中最大回撤率
我们要先求得08年金融危机的最大回撤、最高点、最高点,作图后效果是这样的:
'''
2、找到从08年-至今的金融危机时间段,并呈现在这些危机时间段内,该基金or股票的历次回撤率。;
'''
crisis_start = datetime.datetime(2007, 1, 1) # 金融危机开始 2007-01-01 00:00:00
crisis_end = datetime.datetime(2009, 8, 1) # 结束 2009-08-01 00:00:00
crisis_df = df[(df.index >= crisis_start) & (df.index <= crisis_end)] # 选取 2007-01-01 到 2009-08-01 的 日期和净值
_ = list(crisis_df['y'].values) # 各个月份的y值列表
# 求最大回撤率、最高点索引、最低点索引
_withdraw, _max, _min = _withdraw_with_high_low(_)
rate = round((_[_max] - _[_min]) / _[_max] * 100, 4)
print('\n08金融危机时间段:\n最高点净值:', _[_max], '\t最低点净值:', _[_min], '\t回撤', (_[_max] - _[_min]))
print(f'最大回撤率: {rate}%')
'''
绘图前,先取得三个点,最低点、最高点、最低和最高中间的点,求得三个点在图中对应的x值y值用于绘图
'''
min = crisis_df[crisis_df.y == _[_min]] # 最低点,包括时间和净值
max = crisis_df[crisis_df.y == _[_max]] # 最高点,包括时间和净值
min_x = min.index
max_x = max.index
min_y = list(min.y)[0] # 取第一个
max_y = list(max.y)[0]
min_date = datetime.datetime.strftime(list(min.index)[0], '%Y-%m-%d') # 日期索引转为字符串日期
max_date = datetime.datetime.strftime(list(max.index)[0], '%Y-%m-%d')
show_min = '['+str(min_date)+' '+ str(min_y)+']'
show_max = '['+str(max_date)+' '+ str(max_y)+']'
# 中间点
tips = crisis_df[crisis_df.index == '2008-03-03'] # 取 2008-03-03 作为图中最大回撤提示的标记点
# 绘图
draw_trend_and_withdraw(crisis_df.index, crisis_df.y, '2008年金融危机最大回撤率',
max_x, max_y, show_max, min_x, min_y, show_min,
f'{rate}%', tips.index, tips.y, 60)
4. 数据和源码
代码-100行
1. 求最大回撤的函数、绘图函数、求相对时间的函数
fengzhuang.py
from dateutil.relativedelta import relativedelta
import matplotlib.pyplot as plt
import datetime
import pylab as pl
# 封装操作
def relative_time(use_now=True, date_string=None, date_format=None, years=0, months=0, days=0, leapdays=0, weeks=0, hours=0, minutes=0, seconds=0, microseconds=0):
""" 相对时间,相对于当前或者某一个时间的时间 """
"""
relative_time(use_now=True) # 现在
relative_time(use_now=True, days=-1) # 昨天的现在
relative_time(use_now=True, years=-1) # 一年前的现在
relative_time(use_now=True, days=-1, months=-1) # 上个月的前一天
relative_time(use_now=False, date_string='2020-09-30 12:00:00', date_format="%Y-%m-%d %H:%M:%S", days=1) # 2020-09-30 12:00:00后一天
relative_time(use_now=False, date_string='2020-09-30', date_format="%Y-%m-%d", years=-1, weeks=2)) # 2020-09-30 前一年的后两星期
使用详见: https://blog.csdn.net/Spade_/article/details/109170585
"""
relative_delta = relativedelta(years=years, months=months, days=days, leapdays=leapdays, weeks=weeks, hours=hours,
minutes=minutes, seconds=seconds, microseconds=microseconds)
_date = datetime.datetime.now() if use_now else datetime.datetime.strptime(date_string, date_format)
return (_date + relative_delta).strftime("%Y-%m-%d %H:%M:%S")
def draw_trend_chart(xs, ys, title):
""" 根据数据绘制折线走势图 """
plt.rcParams['font.sans-serif'] = ['SimHei']
plt.rcParams['axes.unicode_minus'] = False
plt.plot(xs, ys) # 根据数据绘制折线走势图
plt.title(title)
plt.show()
def draw_trend_and_withdraw(xs, ys, title, max_x, max_y, show_max_str, min_x, min_y, show_min_str,
withdraw, withdraw_x=None, withdraw_y=None, x_ticks_rotation=None):
""" 根据数据绘制折线走势图和最大回撤信息 """
"""
xs: x轴数组
ys: y轴数组
title: 走势图标题
max_x, max_y: 最大回撤最高点的x值和y值
min_x, min_y: 最大回撤最低点的x值和y值
show_max_str: 最大回撤最高点的标记提示
show_min_str: 最大回撤最低点的标记提示
withdraw: 最大回撤值
withdraw_x: 最大回撤值提示点的x值
withdraw_y: 最大回撤值提示点的y值
"""
plt.rcParams['font.sans-serif'] = ['SimHei']
plt.rcParams['axes.unicode_minus'] = False
plt.plot(xs, ys) # 根据数据绘制折线走势图
plt.title(title)
plt.scatter(min_x, min_y, color='r') # 标记最低点
plt.scatter(max_x, max_y, color='r') # 标记最高点
plt.annotate(show_min_str, xytext=(min_x, min_y), xy=(min_x, min_y)) # 标记提示
plt.annotate(show_max_str, xytext=(max_x, max_y), xy=(max_x, max_y)) # 标记提示
plt.plot([min_x, max_x], [min_y, max_y], color='b', linestyle='--') # 连接最低净值点和最高净值点
if withdraw_x is None or withdraw_y is None:
plt.annotate(withdraw, xytext=((max_x + min_x) / 2, (max_y + min_y) / 2), xy=((max_x + min_x) / 2, (max_y + min_y) / 2)) # 标记提示
else:
plt.annotate(withdraw, xytext=(withdraw_x, withdraw_y), xy=(withdraw_x, withdraw_y)) # 标记提示
if x_ticks_rotation is not None: # 旋转 x 轴的标记
pl.xticks(rotation=60)
plt.show()
def _withdraw_with_high_low(arr):
""" 传入一个数组,返回最大回撤和对应的最高点索引、最低点索引 """
_dp = 0 # 使用 _dp 表示 i 点的最大回撤
i_high = 0 # 遍历时,0 ~ i - 1 中最高的点的索引,注意是索引
# 全局最大回撤和对应的最高点和最低点的索引,注意是索引
g_withdraw, g_high, g_low = float('-inf'), -1, -1
for i in range(1, len(arr)):
# 注意:此处求的是
if arr[i_high] < arr[i-1]: # 若 0 ~ i - 1 中最高的点小于当前点
i_high = i-1 # 0 ~ i - 1 中最高的点的索引
_dp = arr[i_high] - arr[i] # _dp 表示 i 点的最大回撤
if _dp > g_withdraw: # 找到新的最大回撤,更新三个值
g_withdraw = _dp
g_high = i_high
g_low = i
return g_withdraw, g_high, g_low
if __name__ == '__main__':
today = relative_time(use_now=True)
two_year_ago = relative_time(use_now=True, years=-2)
xs = range(0, 9)
arr = [3, 7, 2, 6, 4, 1, 9, 8, 5]
_max, _min = 1, 5 # 最高点索引和最低点索引
max_rate = 6 # 最大回撤
draw_trend_chart(xs, arr, title=f'{arr}')
draw_trend_and_withdraw(list(range(0, 9)), arr, f'{arr}', _max, arr[_max], f'最高点索引:{_max}',
_min, arr[_min], f'最低点索引:{_min}', max_rate)
2. 数据读取、清洗、调用绘图函数
519300.py
'''
数据来源:http://fund.eastmoney.com/519300.html?spm=search
天天基金官网:大成沪深300指数A 519300
'''
import pandas as pd
import datetime
from fengzhuang import relative_time, draw_trend_chart, _withdraw_with_high_low, draw_trend_and_withdraw
# 读取数据
df = pd.read_csv('大成沪深300指数A-519300.txt', sep='\t', header=None, names=['x', 'y', 'equityReturn'])
df.index = pd.to_datetime(df.x) # 使用x时间列为索引列,定位快
df = df.drop(['x', 'equityReturn'], axis=1) # 删除x列和equityReturn列。equityReturn表示权益回报,我们不关心。
draw_trend_chart(df.index, df.y, '大成沪深300指数A-519300走势图')
'''
计算每个月的最大回撤率
'''
# 存储各个月份的日期、最大回撤最高点的值和最低点的值、最大回撤、最大回撤率
res = []
# 先按年分组,再按月分组
for indexs, groupby_year_month in df.groupby([df.index.year, df.index.month]):
_ = list(groupby_year_month['y'].values) # 单个月份的净值列表
# 求最大回撤率、最高点索引、最低点索引
_withdraw, _max, _min = _withdraw_with_high_low(_)
# t为一个月的五个值,分别是日期、最大回撤最高点的值和最低点的值、最大回撤、最大回撤率
t = [groupby_year_month.index[0], _[_max], _[_min], _[_max] - _[_min], (_[_max] - _[_min]) / _[_max] * 100]
# date、max、min、diff、rate
res.append(t)
# 转DataFrame
result = pd.DataFrame(res, columns=["date", "max", "min", "diff", "rate"])
# 只保留年月
result['date'] = result['date'].apply(lambda x : datetime.datetime.strftime(x, "%Y-%m"))
# 日期列转为索引
result.index = pd.to_datetime(result['date'])
# 删除日期列
result = result.drop(['date'], axis=1)
print(result)
'''
1、以月为窗口,挑选一只基金or股票,查看它近2年最大回撤率;
'''
# 取近两年
today = relative_time(use_now=True)
two_year_ago = relative_time(use_now=True, years=-2)
near_two_year_df = result[(result.index >= two_year_ago)]
# 以月为窗口的最大回撤率
print(f'以月为窗口,近2年最大回撤率: {round(near_two_year_df["rate"].max(), 4)}%')
# 以月为窗口的回撤率绘图
draw_trend_chart(near_two_year_df.index, near_two_year_df['rate'], '大成沪深300指数A-519300 近两年的月回撤率')
'''
2、找到从08年-至今的金融危机时间段,并呈现在这些危机时间段内,该基金or股票的历次回撤率。;
'''
crisis_start = datetime.datetime(2007, 1, 1) # 金融危机开始 2007-01-01 00:00:00
crisis_end = datetime.datetime(2009, 8, 1) # 结束 2009-08-01 00:00:00
crisis_df = df[(df.index >= crisis_start) & (df.index <= crisis_end)] # 选取 2007-01-01 到 2009-08-01 的 日期和净值
_ = list(crisis_df['y'].values) # 各个月份的y值列表
# 求最大回撤率、最高点索引、最低点索引
_withdraw, _max, _min = _withdraw_with_high_low(_)
rate = round((_[_max] - _[_min]) / _[_max] * 100, 4)
print('\n08金融危机时间段:\n最高点净值:', _[_max], '\t最低点净值:', _[_min], '\t回撤', (_[_max] - _[_min]))
print(f'最大回撤率: {rate}%')
'''
绘图前,先取得三个点,最低点、最高点、最低和最高中间的点,求得三个点在图中对应的x值y值用于绘图
'''
min = crisis_df[crisis_df.y == _[_min]] # 最低点,包括时间和净值
max = crisis_df[crisis_df.y == _[_max]] # 最高点,包括时间和净值
min_x = min.index
max_x = max.index
min_y = list(min.y)[0] # 取第一个
max_y = list(max.y)[0]
min_date = datetime.datetime.strftime(list(min.index)[0], '%Y-%m-%d') # 日期索引转为字符串日期
max_date = datetime.datetime.strftime(list(max.index)[0], '%Y-%m-%d')
show_min = '['+str(min_date)+' '+ str(min_y)+']'
show_max = '['+str(max_date)+' '+ str(max_y)+']'
# 中间点
tips = crisis_df[crisis_df.index == '2008-03-03'] # 取 2008-03-03 作为图中最大回撤提示的标记点
# 绘图
draw_trend_and_withdraw(crisis_df.index, crisis_df.y, '2008年金融危机最大回撤率',
max_x, max_y, show_max, min_x, min_y, show_min,
f'{rate}%', tips.index, tips.y, 60)