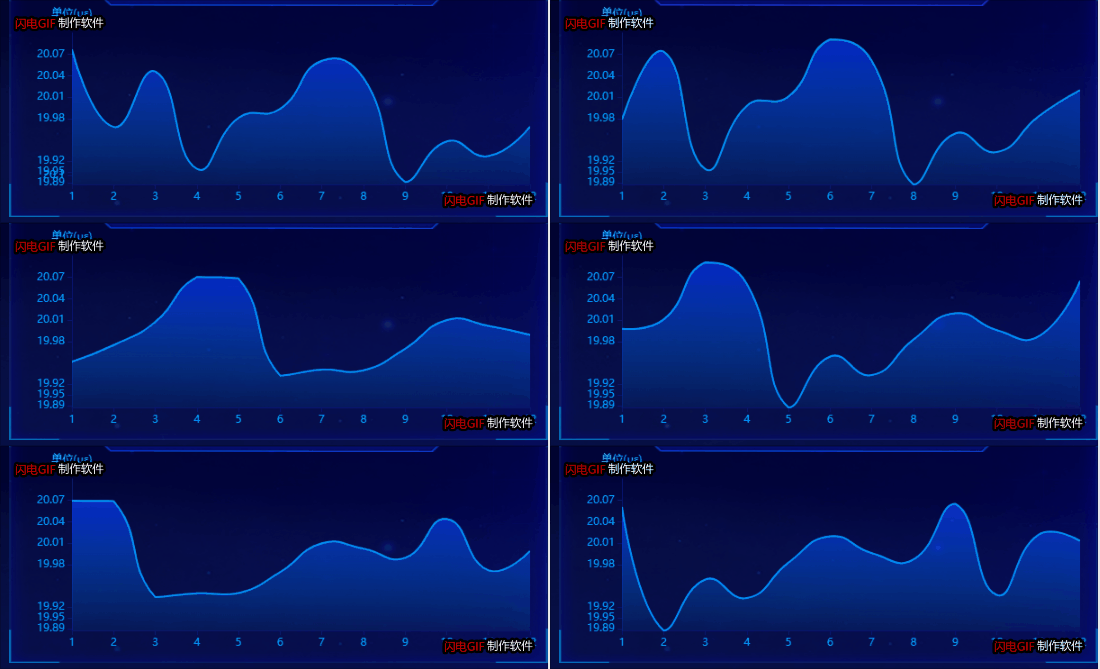
eCharts 动态数据曲线时时变化

在这里插入图片描述

<template>
  <div class="content">
    <div class="tittle">
      <span> 标题 </span>
    </div>

    <div class="main" id="maina"></div>
  </div>
</template>
<script>
export default {
  data() {
    return {
      list: [],
      myChart: undefined,
      timer: null,
    };
  },
  watch: {
    arr: function (one, old) {
      if (one !== old) {
        this.createEcharts();
      }
    },
  },
 props: {
    arr: {
      type: Array,
    },
  },
  methods: {
    createEcharts() {
      this.myChart = this.echarts.init(document.getElementById("maina"));
      var option = {
        grid: {
          top: 30,
          left: 70,
          right: 20,
          bottom: 35,
        },
        xAxis: {
          type: "category",
          boundaryGap: false,
          data: ["1", "2", "3", "4", "5", "6", "7", "8", "9", "10", "11", "12"],
          axisLabel: {
            textStyle: {
              color: "#01B4FF",
            },
          },
          splitLine: {
            show: false,
            lineStyle: {
              type: "dashed",
            },
          },
          axisLine: {
            lineStyle: {
              color: "#0A156E",
              width: 1, //这里是为了突出显示加上的
            },
          },
        },
        yAxis: {
          type: "value",
          name: "单位(με)",
          min: function (value) {
            return value.min;
          },
          nameTextStyle: {
            color: "#2BB6FF",
            fontSize: 12,
          },
          axisLabel: {
            textStyle: {
              color: "#01B4FF",
            },
          },
          splitLine: {
            show: false,
            lineStyle: {
              type: "dashed",
            },
          },
          axisLine: {
            lineStyle: {
              color: "#0A156E",
              width: 1, //这里是为了突出显示加上的
            },
          },
        },
        series: [
          {
            data: this.list,
            type: "line",
            areaStyle: {},
            symbol: "none",
            smooth: true,
            lineStyle: {
              color: "#0090FF",
              width: 2,
            },
            itemStyle: {
              color: new this.echarts.graphic.LinearGradient(0, 0, 0, 1, [
                {
                  offset: 0,
                  color: "#0336FF",
                },
                {
                  offset: 1,
                  color: "rgba(0,144,255,0.1)",
                },
              ]),
            },
          },
        ],
      };

      window.addEventListener("resize", () => {
        this.myChart.resize();
      });
      // *********************重点代码********开始*****************     
      this.timer = setInterval(() => {
        this.list = [];
        this.arr.forEach((item) => {
          this.list.push(item);
        });
        this.myChart.setOption({
          series: [
            {
              data: this.list,
            },
          ],
        });
      }, 1000);
       // *********************重点代码********结束*****************
      // 使用刚指定的配置项和数据显示图表。
      this.myChart.setOption(option);
    },
  },
  beforeDestroy() {
    clearInterval(this.timer);
    this.timer = null;
  },
};
</script>
<style lang="less" scoped>
.content {
  margin-top: 17px;
  width: 100%;
  height: 30%;
  background: url("../../assets/image/scienceBg.png") 0 0 no-repeat;
  background-size: 100% 100%;
  .main {
    height: calc(100% - 43px);
    width: 100%;
    // border: 1px solid red;
  }
  .tittle {
    background: url("../../assets/image/title.png") 0 0 no-repeat;
    background-size: 100% 100%;
    width: 80%;
    height: 43px;
    padding-top: 20px;
    // position: absolute;
    // left: 50%;
    // top: 0;
    // transform: translate(-50%);
    margin: 0 auto;
    text-align: center;
    line-height: 0px;
    position: relative;
    span {

      font-size: 24px;
      font-family: Microsoft YaHei;
      font-weight: bold;
      color: #0096ff;
      background: linear-gradient(
        92deg,
        #0072ff 0%,
        #00eaff 48.8525390625%,
        #01aaff 100%
      );
      -webkit-background-clip: text;
      -webkit-text-fill-color: transparent;
    }
  }
}
</style>
  • 0
    点赞
  • 3
    收藏
    觉得还不错? 一键收藏
  • 0
    评论
要实现echarts的动态多条曲线和数据,可以采用以下步骤: 1. 准备好echarts的基础环境,包括引入echarts库和创建一个空的div用于显示图表。 2. 定义一个数据源,包括多条曲线和对应的数据。这些数据可以是从后台接口获取的,也可以是手动输入的静态数据。 3. 在echarts中定义多条曲线,包括曲线的颜色、样式等属性。 4. 使用setInterval函数定时更新数据,每次更新后重新渲染图表。在更新数据时,可以随机生成一些数据,模拟实时数据的变化。 下面是一个示例代码,实现了echarts动态展示多条不同曲线和数据的效果: ```javascript // 创建一个空的div用于显示图表 var myChart = echarts.init(document.getElementById('chart')); // 定义数据源,包括三条曲线和对应的数据 var data = { line1: [10, 20, 30, 40, 50, 60, 70, 80, 90, 100], line2: [30, 60, 90, 120, 150, 180, 210, 240, 270, 300], line3: [20, 40, 60, 80, 100, 120, 140, 160, 180, 200] }; // 定义三条曲线的样式和属性 var option = { legend: { data: ['line1', 'line2', 'line3'] }, xAxis: { type: 'category', data: ['1', '2', '3', '4', '5', '6', '7', '8', '9', '10'] }, yAxis: { type: 'value' }, series: [{ name: 'line1', type: 'line', data: data.line1, lineStyle: { color: 'red' } }, { name: 'line2', type: 'line', data: data.line2, lineStyle: { color: 'blue' } }, { name: 'line3', type: 'line', data: data.line3, lineStyle: { color: 'green' } }] }; // 使用setInterval函数定时更新数据,每次更新后重新渲染图表 setInterval(function () { // 随机生成一些数据,模拟实时数据的变化 data.line1.shift(); data.line1.push(Math.floor(Math.random() * 100)); data.line2.shift(); data.line2.push(Math.floor(Math.random() * 100)); data.line3.shift(); data.line3.push(Math.floor(Math.random() * 100)); // 更新echarts图表的数据 myChart.setOption({ series: [{ name: 'line1', data: data.line1 }, { name: 'line2', data: data.line2 }, { name: 'line3', data: data.line3 }] }); }, 1000); // 每隔1秒更新一次数据 ``` 这样,就可以实现echarts动态展示多条不同曲线和数据的效果了。

“相关推荐”对你有帮助么?

  • 非常没帮助
  • 没帮助
  • 一般
  • 有帮助
  • 非常有帮助
提交
评论
添加红包

请填写红包祝福语或标题

红包个数最小为10个

红包金额最低5元

当前余额3.43前往充值 >
需支付:10.00
成就一亿技术人!
领取后你会自动成为博主和红包主的粉丝 规则
hope_wisdom
发出的红包
实付
使用余额支付
点击重新获取
扫码支付
钱包余额 0

抵扣说明:

1.余额是钱包充值的虚拟货币,按照1:1的比例进行支付金额的抵扣。
2.余额无法直接购买下载,可以购买VIP、付费专栏及课程。

余额充值