


 本文提供了Matplotlib.pyplot.plot函数中图形符号、线条风格和颜色的简写形式速查表,包括Format Strings、Markers和Line Styles。未指定时,将采用默认设置:无符号实线,多条线会自动使用预设颜色。颜色可使用单字母代码进行指定。
Matplotlib.pyplot.plot图形符号、风格及颜色简写形式速查表
注:图形符号、风格及颜色均为
plot函数的可选参数
- 如不指定符号和线条风格,默认为无符号的实线
- 如不指定颜色,Matplotlib会为多条线自动循环使用一组默认的颜色
Format Strings
A format string consists of a part for color, marker and line:
fmt = '[marker][line][color]'
Each of them is optional. If not provided, the value from the style cycle is used. Exception: If line is given, but no marker, the data will be a line without markers.
Other combinations such as [color][marker][line] are also supported, but note that their parsing may be ambiguous.
Markers 图形符号
| character | description |
|---|---|
| ‘.’ | point marker |
| ‘,’ | pixel marker 像素点 |
| ‘o’ | circle marker |
| ‘v’ | triangle_down marker |
| ‘^’ | triangle_up marker |
| ‘<’ | triangle_left marker |
| ‘>’ | triangle_right marker |
| ‘1’ | tri_down marker |
| ‘2’ | tri_up marker |
| ‘3’ | tri_left marker |
| ‘4’ | tri_right marker |
| ‘s’ | square marker |
| ‘p’ | pentagon marker |
| ‘*’ | star marker |
| ‘h’ | hexagon1 marker |
| ‘H’ | hexagon2 marker |
| ‘+’ | plus marker |
| ‘x’ | x marker |
| ‘D’ | diamond marker |
| ‘d’ | thin_diamond marker |
| ‘|’ | vline marker |
| ‘_’ | hline marker |
# 示例(按表格从上至下顺序展示线条)
plt.plot(x, x + 0, '4', label='4')
plt.plot(x, x + 1, '3', label='3')
plt.plot(x, x + 2, '2', label='2')
plt.plot(x, x + 3, '1', label='1')
plt.plot(x, x + 4, '>', label='>')
plt.plot(x, x + 5, '<', label='<')
plt.plot(x, x + 6, '^', label='^')
plt.plot(x, x + 7, 'v', label='v')
plt.plot(x, x + 8, 'o', label='o')
plt.plot(x, x + 9, ',', label=',')
plt.plot(x, x + 10, '.', label='.')
plt.legend(bbox_to_anchor=(1.05, 1), loc='upper left', borderaxespad=0.)

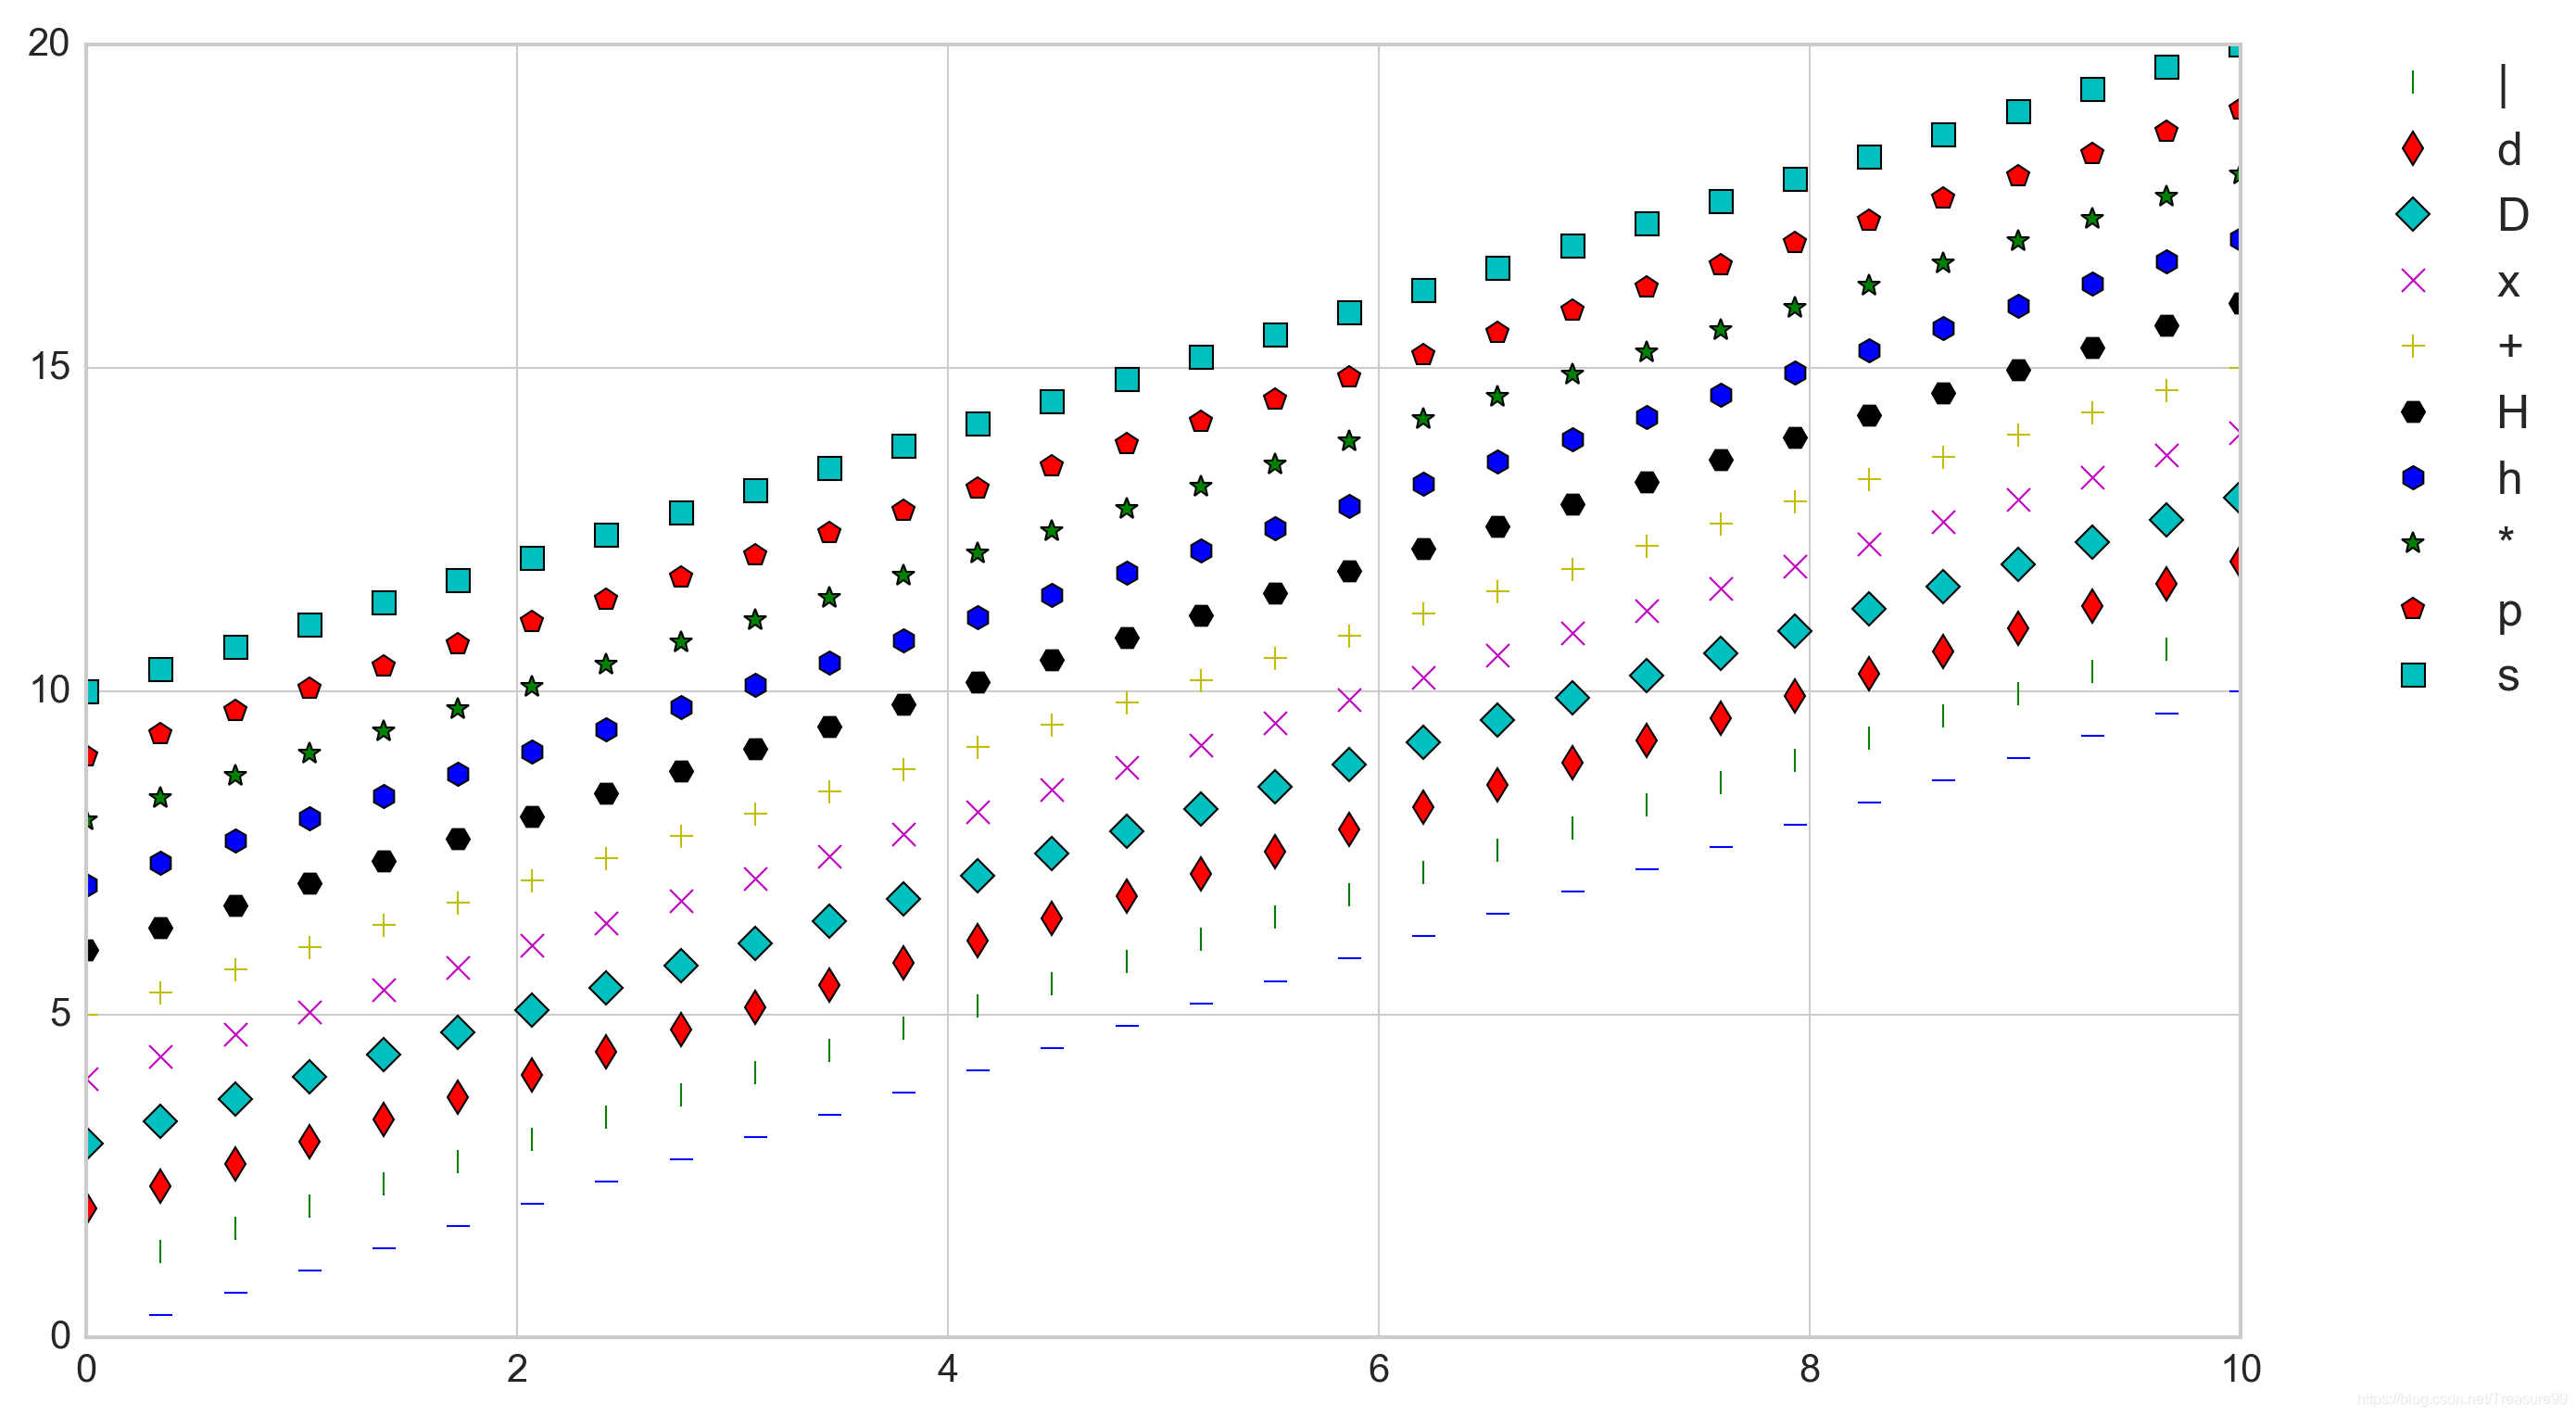
# 示例
plt.plot(x, x + 0, '_', label='_')
plt.plot(x, x + 1, '|', label='|')
plt.plot(x, x + 2, 'd', label='d')
plt.plot(x, x + 3, 'D', label='D')
plt.plot(x, x + 4, 'x', label='x')
plt.plot(x, x + 5, '+', label='+')
plt.plot(x, x + 6, 'H', label='H')
plt.plot(x, x + 7, 'h', label='h')
plt.plot(x, x + 8, '*', label='*')
plt.plot(x, x + 9, 'p', label='p')
plt.plot(x, x + 10, 's', label='s')
plt.legend(bbox_to_anchor=(1.05, 1), loc='upper left', borderaxespad=0.)
Line Styles 线条风格
| character | description |
|---|---|
| ‘-’ | solid line style 实线 |
| ‘--’ | dashed line style 虚线 |
| ‘-.’ | dash-dot line style 点划线 |
| ‘:’ | dotted line style 实点线 |
# 示例
plt.plot(x, x + 0, linestyle='-') # 实线
plt.plot(x, x + 1, linestyle='--') # 虚线
plt.plot(x, x + 2, linestyle='-.') # 点划线
plt.plot(x, x + 3, linestyle=':') # 实点线

Example format strings:
# 示例
plt.plot(x, x + 0, 'b', label='b')		# blue markers with default shape
plt.plot(x, x + 1, 'or', label='or') 	# red circles
plt.plot(x, x + 2, '-g', label='-g') 	# green solid line
plt.plot(x, x + 3, '--', label='--') 	# dashed line with default color
plt.plot(x, x + 4, '^k:', label='^k:')  	# black triangle_up markers connected by a dotted line
plt.legend(loc='lower right')

Colors 颜色
The supported color abbreviations are the single letter codes
| character | color |
|---|---|
| ‘b’ | blue |
| ‘g’ | green |
| ‘r’ | red |
| ‘c’ | cyan 青色 |
| ‘m’ | magenta 品红 |
| ‘y’ | yellow |
| ‘k’ | black |
| ‘w’ | white 白色 |


 被折叠的 条评论
为什么被折叠?
被折叠的 条评论
为什么被折叠?
 到【灌水乐园】发言


