


作图部分
在直角坐标系上作图
1、绘制单根二维曲线
x = -2:0.01:2; % 取x值,步长是0.01
y = x.^2;  %注意这里有.

plot(x,y);
结果如图: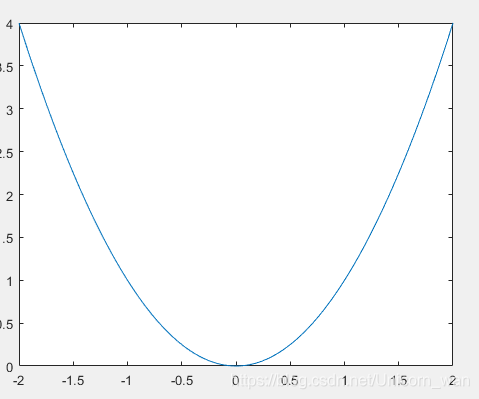

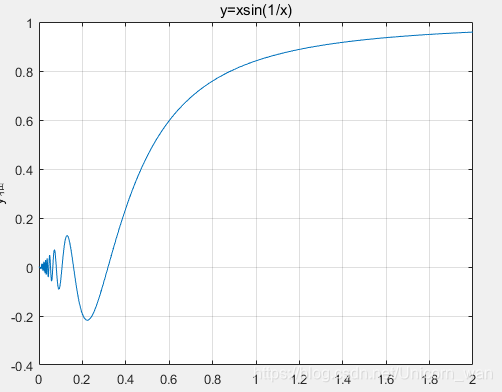
% 在直角坐标系上作图
x=0:0.001:2;
y=x.*sin(1./(x+eps)); %加eps避免0作分母
plot(x,y)

title('y=xsin(1/x)'); %加标题
xlabel('x轴');
ylabel('y轴');
grid on     %网格模式打开
结果如图:
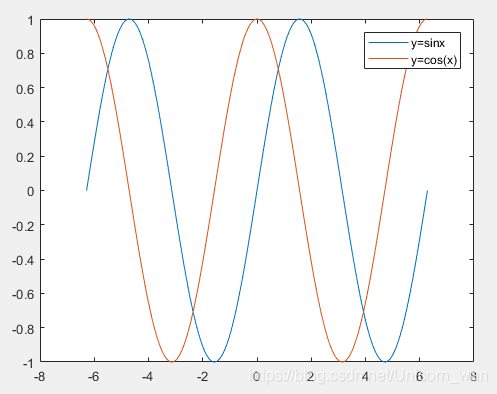
% 在直角坐标系上作图
x=-2*pi:pi/100:2*pi;
y1=sin(x);
y2=cos(x);
plot(x,y1,x,y2)
legend('y=sinx','y=cos(x)') %图标标注

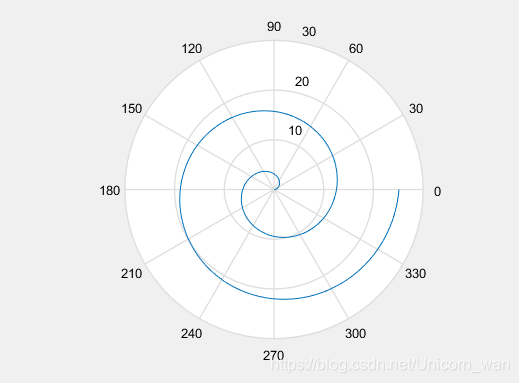
theta = 0:0.01*pi:4*pi; %theta的单位是弧度
rho = 2*theta;
polar(theta,rho);
求极限部分

%求极限
syms x;
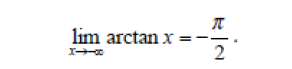
limit(atan(x),x,-inf)
结果是:ans = -pi/2,即:
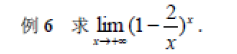
syms x;
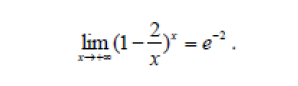
limit((1-2/x)^x,x,inf)
结果是: ans = exp(-2),即:
syms x;
limit((x-1)/abs(x-1),x,1)
运行结果是:ans=NaN, 即:极限不存在
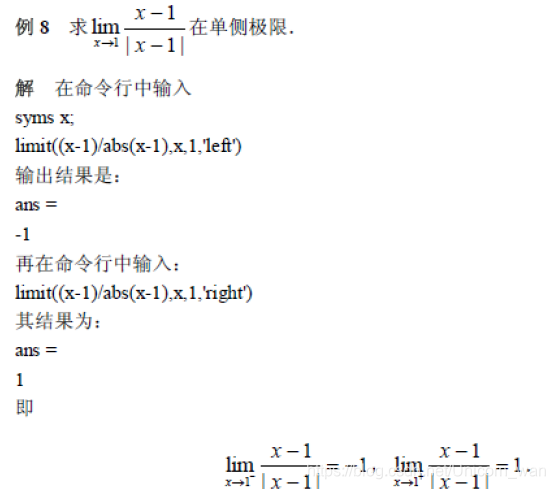
2、求单侧极限


 1148
1148


 被折叠的 条评论
为什么被折叠?
被折叠的 条评论
为什么被折叠?
 到【灌水乐园】发言


