


系列文章目录:
python数据分析(一)——series和读取外部数据
python数据分析(二)——DataFrame
python数据分析(三)——pandas缺失值处理
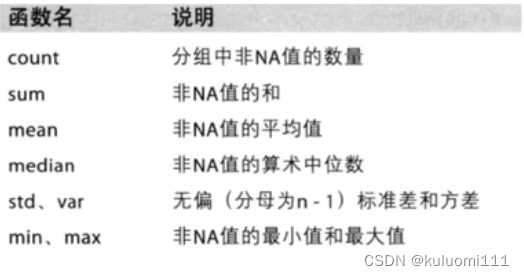
python数据分析(四)——pandas常用统计方法
数据的合并和分组聚合
前言
对于这一组电影数据,希望统计电影分类(genre)的情况,应该如何处理数据?
思路:重新构造一个全为0的数组,列名为分类,如果某一条数据中分类出现过,就让0变为1
一、字符串离散化实例
代码如下(示例):
import matplotlib.pyplot as plt
import pandas as pd
import numpy as np
from matplotlib.font_manager import FontProperties

font = FontProperties(fname="/System/Library/Fonts/Supplemental/Songti.ttc", size=14)

df = pd.read_csv("./IMDB-Movie-Data.csv")

temp_list = list(df["Genre"].str.split(","))  # [[], [], []]
# print(temp_list)
genre_list = list(set([i for j in temp_list for i in j]))

# 构造全为0的数组
zeros_df = pd.DataFrame(np.zeros((df.shape[0], len(genre_list))), columns=genre_list)

# print(zeros_df)

# 给每个电影出现分类的位置赋值1
for i in range(df.shape[0]):
    # zeros_df.loc[0, ["Sci-fi", "Musical"] = 1
    # loc[index, columns]第一个参数为索引,第二个参数为列
    # iloc[index]只接受索引,不接受列参数
    zeros_df.loc[i, temp_list[i]] = 1

# 统计每个分类的电影的数量和
genre_count = zeros_df.sum(axis=0)
# print(zeros_df)

# 排序
genre_count = genre_count.sort_values(ascending=False)

# 画图
plt.figure(figsize=(20, 8), dpi=80)
_x = genre_count.index
_y = genre_count.values
plt.bar(range(len(_x)), _y, width=0.5)

plt.xticks(range(len(_x)), _x, rotation=45, fontproperties=font)
plt.yticks(range(0, 520, 100), fontproperties=font)

plt.xlabel("种类", fontproperties=font)
plt.ylabel("数量", fontproperties=font)

plt.show()
二、数据合并join:行索引
join:默认情况下是把行行索引相同的数据合并在一起,按照对应的行索引合并
数据合并 行索引
In [18]: t1 = pd.DataFrame(np.ones((2, 4)), index=list("AB"),columns=list("abcd"))
In [19]: t1
Out[19]:
     a    b    c    d
A  1.0  1.0  1.0  1.0
B  1.0  1.0  1.0  1.0

In [20]: t2 = pd.DataFrame(np.zeros((3, 3)), index=list("ABC"),columns=list("xyz"))
In [21]: t2
Out[21]:
     x    y    z
A  0.0  0.0  0.0
B  0.0  0.0  0.0
C  0.0  0.0  0.0

In [22]: t1.join(t2) # 行数以t1为准
Out[22]:
     a    b    c    d    x    y    z
A  1.0  1.0  1.0  1.0  0.0  0.0  0.0
B  1.0  1.0  1.0  1.0  0.0  0.0  0.0

In [23]: t2.join(t1) # 行数以t2为准
Out[23]:
     x    y    z    a    b    c    d
A  0.0  0.0  0.0  1.0  1.0  1.0  1.0
B  0.0  0.0  0.0  1.0  1.0  1.0  1.0
C  0.0  0.0  0.0  NaN  NaN  NaN  NaN
三、数据合并merge:列索引
merge:按照指定的列把数据按照一定的方式合并到一起
数据合并 列索引
In [18]: t1 = pd.DataFrame(np.ones((2, 4)), index=list("AB"),columns=list("abcd"))
In [19]: t1
Out[19]:
     a    b    c    d
A  1.0  1.0  1.0  1.0
B  1.0  1.0  1.0  1.0

In [27]: t3 = pd.DataFrame(np.arange(9).reshape(3,3),columns=list("fax"))

In [28]: t3
Out[28]:
   f  a  x
0  0  1  2
1  3  4  5
2  6  7  8

# 默认的合并方式是交集,inner
In [29]: t1.merge(t3,on="a")
Out[29]:
     a    b    c    d  f  x
0  1.0  1.0  1.0  1.0  0  2
1  1.0  1.0  1.0  1.0  0  2

# outer合并方式是并集
In [30]: t1.merge(t3,on="a",how="outer")
Out[30]:
     a    b    c    d  f  x
0  1.0  1.0  1.0  1.0  0  2
1  1.0  1.0  1.0  1.0  0  2
2  4.0  NaN  NaN  NaN  3  5
3  7.0  NaN  NaN  NaN  6  8

In [31]: t1.loc["A","a"]=100
In [32]: t1
Out[32]:
       a    b    c    d
A  100.0  1.0  1.0  1.0
B    1.0  1.0  1.0  1.0

In [33]: t1.merge(t3,on="a",how="outer")
Out[33]:
       a    b    c    d    f    x
0  100.0  1.0  1.0  1.0  NaN  NaN
1    1.0  1.0  1.0  1.0  0.0  2.0
2    4.0  NaN  NaN  NaN  3.0  5.0
3    7.0  NaN  NaN  NaN  6.0  8.0

In [34]: t3.merge(t1,on="a",how="outer")
Out[34]:
     f      a    x    b    c    d
0  0.0    1.0  2.0  1.0  1.0  1.0
1  3.0    4.0  5.0  NaN  NaN  NaN
2  6.0    7.0  8.0  NaN  NaN  NaN
3  NaN  100.0  NaN  1.0  1.0  1.0

# left左边为准,NaN补全
In [35]: t3.merge(t1,on="a",how="left")
Out[35]:
   f  a  x    b    c    d
0  0  1  2  1.0  1.0  1.0
1  3  4  5  NaN  NaN  NaN
2  6  7  8  NaN  NaN  NaN

# right右边为准,NaN补全
In [36]: t3.merge(t1,on="a",how="right")
Out[36]:
     f      a    x    b    c    d
0  NaN  100.0  NaN  1.0  1.0  1.0
1  0.0    1.0  2.0  1.0  1.0  1.0
如果列索引不相同,无法使用on参数,则可以使用left_on和right_on参数
数据合并 列索引
In [37]: t1 = pd.DataFrame(np.ones((3, 4)),index=list("ABC"), columns=list("MNOP"))
In [38]: t1["O"]=list("abc")

In [39]: t1
Out[39]:
     M    N  O    P
A  1.0  1.0  a  1.0
B  1.0  1.0  b  1.0
C  1.0  1.0  c  1.0

In [53]: t2 = pd.DataFrame(np.zeros((2, 5)),index=list("AB"), columns=list("YWXYZ"))
In [54]: t2["X"]=list("cd")

In [55]: t2
Out[55]:
     Y    W  X    Y    Z
A  0.0  0.0  c  0.0  0.0
B  0.0  0.0  d  0.0  0.0

# 默认是交集
In [56]: t1.merge(t2,left_on="O",right_on="X")
Out[56]:
     M    N  O    P    Y    W  X    Y    Z
0  1.0  1.0  c  1.0  0.0  0.0  c  0.0  0.0

In [57]: t1.merge(t2,left_on="O",right_on="X",how="outer")
Out[57]:
     M    N    O    P    Y    W    X    Y    Z
0  1.0  1.0    a  1.0  NaN  NaN  NaN  NaN  NaN
1  1.0  1.0    b  1.0  NaN  NaN  NaN  NaN  NaN
2  1.0  1.0    c  1.0  0.0  0.0    c  0.0  0.0
3  NaN  NaN  NaN  NaN  0.0  0.0    d  0.0  0.0

In [58]: t1.merge(t2,left_on="O",right_on="X",how="left")
Out[58]:
     M    N  O    P    Y    W    X    Y    Z
0  1.0  1.0  a  1.0  NaN  NaN  NaN  NaN  NaN
1  1.0  1.0  b  1.0  NaN  NaN  NaN  NaN  NaN
2  1.0  1.0  c  1.0  0.0  0.0    c  0.0  0.0

In [59]: t1.merge(t2,left_on="O",right_on="X",how="right")
Out[59]:
     M    N    O    P    Y    W  X    Y    Z
0  1.0  1.0    c  1.0  0.0  0.0  c  0.0  0.0
1  NaN  NaN  NaN  NaN  0.0  0.0  d  0.0  0.0
四、数据分组聚合
#返回类型
#DataFrameGroupBy
#可以进行遍历
#调用聚合方法

df.groupby(by='columns_name')
grouped是一个DataFrameGroupBy对象,是可迭代的
grouped中的每一个元素是一个元组
元组里面是(索引(分组的值),分组之后的DataFrame)

# 对国家和省份进行分组统计
grouped = df.groupby(by=[df['Country'],df['State/Province'])
# series类型

# 获取分组之后的某一部分数据
df.groupby(by=['Country','State/Province'])['Country'].count()
# series类型

# 对某几列数据进行分组
df['Country'].grouby(by=[df['Country'],df['State/Province']]).count()
# series类型

t1 = df[['Country']].grouby(by=[df['Country'],df['State/Province']]).count()
t2 = df.groupby(by=['Country','State/Province'])[['Country']].count()
以上两条命令结果一样,但与之前结果的区别是返回的是DataFrame类型
美国和中国的星巴克数量
import matplotlib.pyplot as plt
import pandas as pd
import numpy as np
from matplotlib.font_manager import FontProperties

font = FontProperties(fname="/System/Library/Fonts/Supplemental/Songti.ttc", size=14)

df = pd.read_csv("starbucks_store_worldwide.csv")
# print(df.info())
# print(df.head(1))
grouped = df.groupby(by='Country')
# print(grouped)
# 返回类型
# DataFrameGroupBy
# 可以进行遍历
# df[df['Country']='US']
# 调用聚合方法
country_count = grouped['Brand'].count()
print(country_count['US'])
print(country_count['CN'])

13608
2734
中国各个省份的星巴克数量
import matplotlib.pyplot as plt
import pandas as pd
import numpy as np
from matplotlib.font_manager import FontProperties

font = FontProperties(fname="/System/Library/Fonts/Supplemental/Songti.ttc", size=14)

df = pd.read_csv("starbucks_store_worldwide.csv")

china_data = df[df['Country'] == 'CN']

grouped = china_data.groupby(by='State/Province').count()['Brand']
五、索引和复合索引
- 获取index:df.index
- 指定index:df.index = [‘x’,‘y’]
- 重新设置index:df.reindex(list(‘abcdef’))
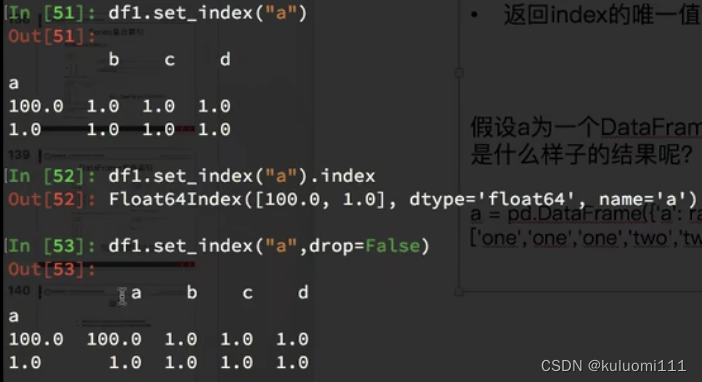
- 指定某一列作为index:df.set_index(‘country’,drop=False)
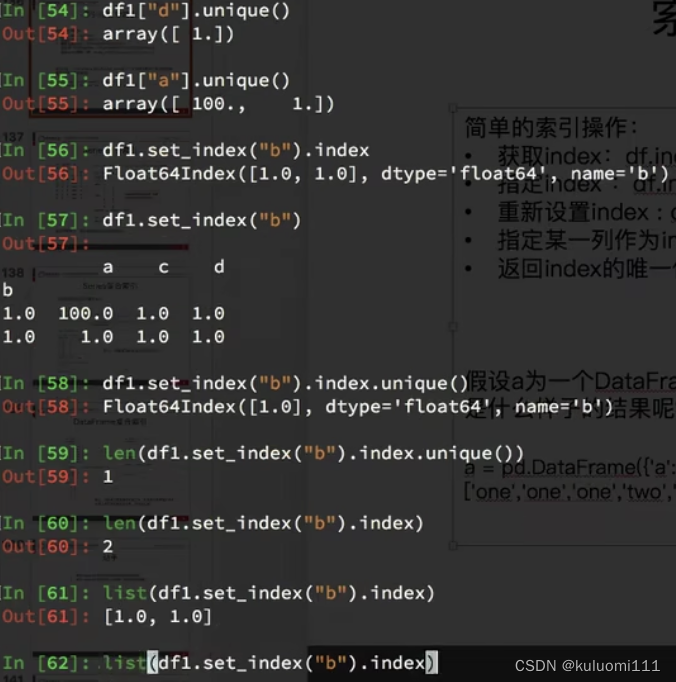
- 返回index的唯一值:df.set_index(‘country’).index.unique()
指定某一列作为索引,但是不希望删掉,设置drop=False保留


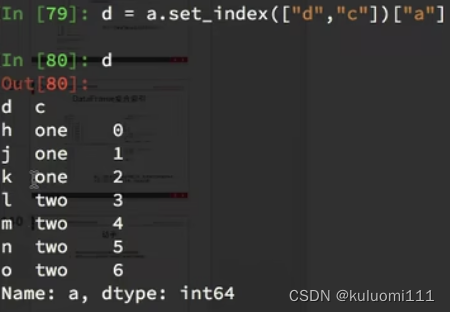
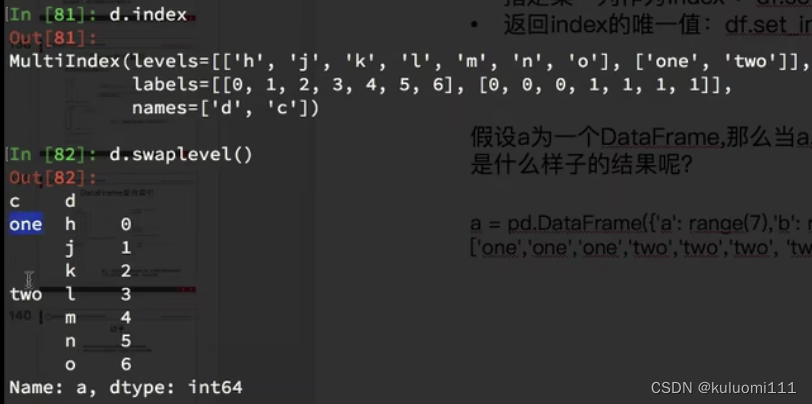
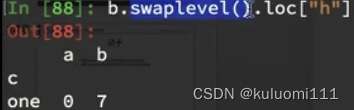
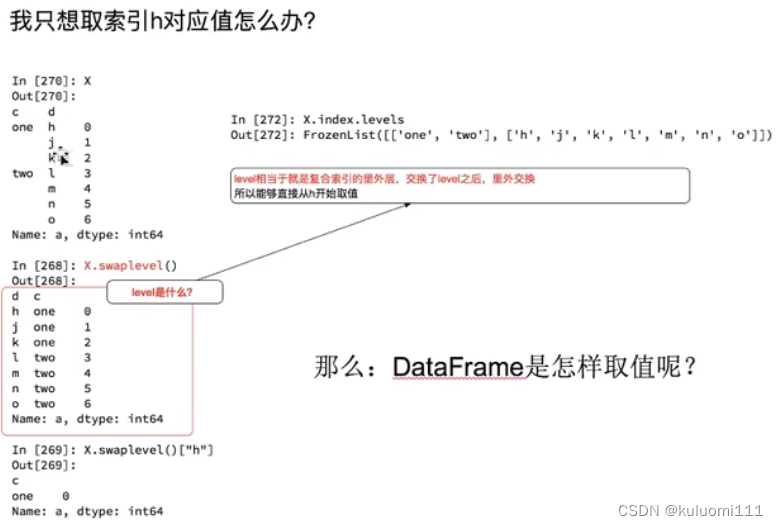
取内部索引时,交换索引:d.swaplevel()
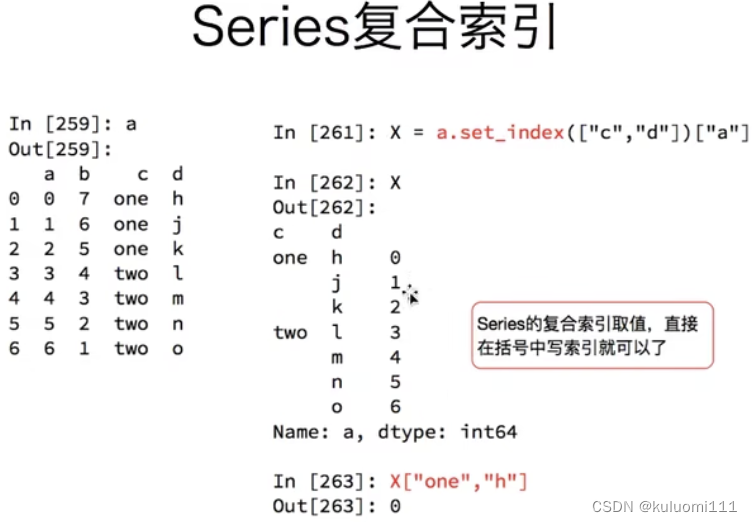
对于series来说,直接方括号[]取,对于dataframe数据来说,加上loc[]

series复合索引
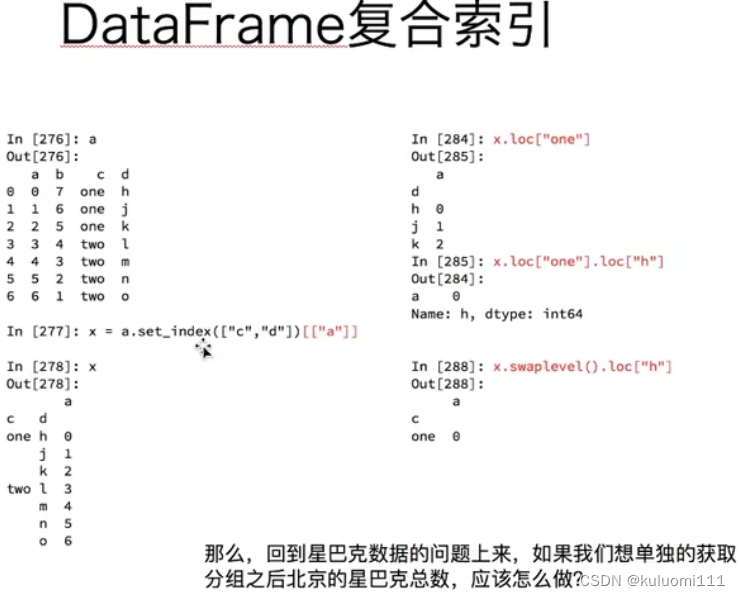
dataframe复合索引
六、索引练习
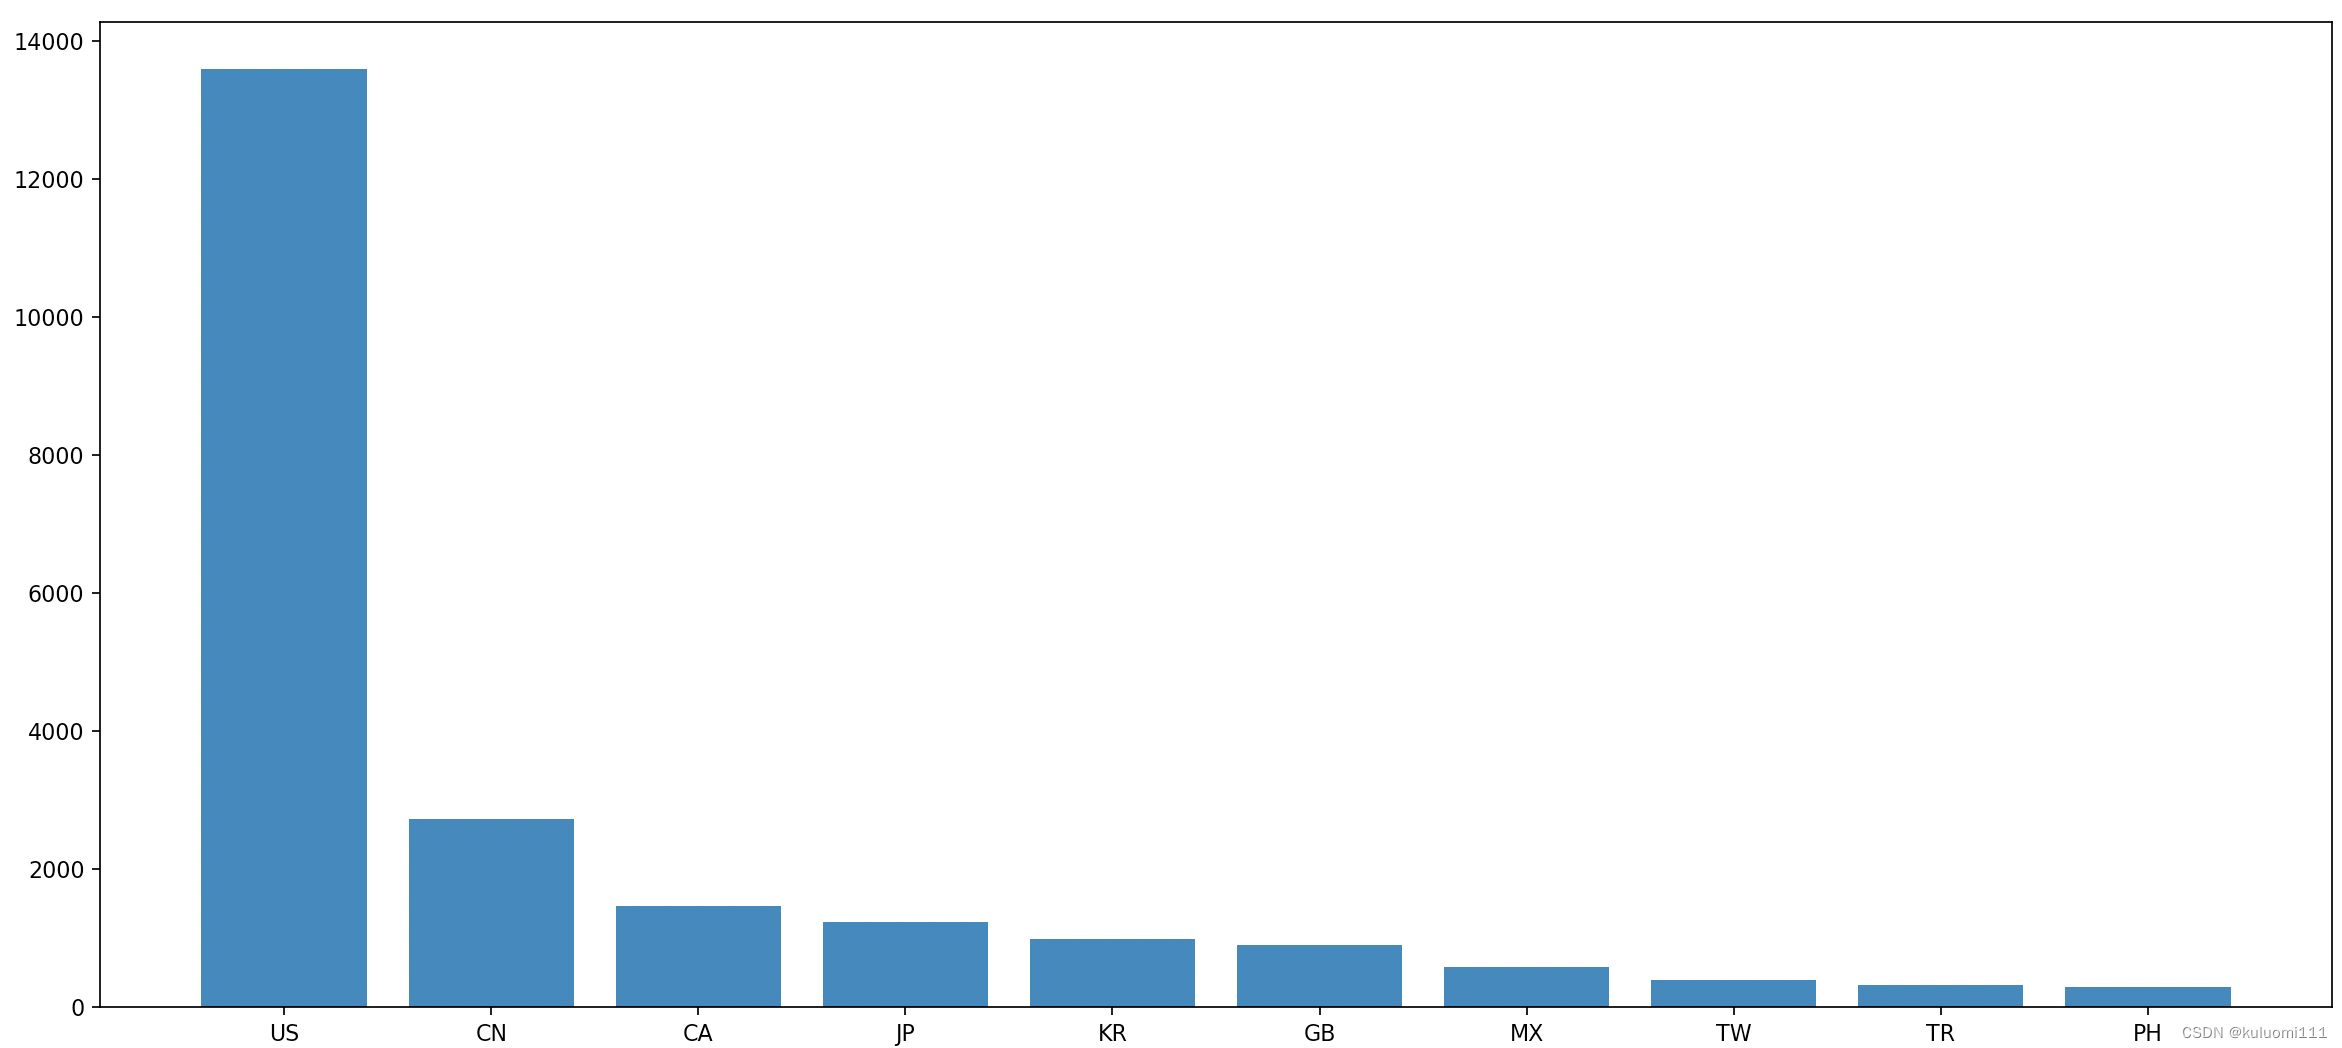
店铺总数排名前10的国家
import matplotlib.pyplot as plt
import pandas as pd
from matplotlib.font_manager import FontProperties

font = FontProperties(fname="/System/Library/Fonts/Supplemental/Songti.ttc", size=14)


df = pd.read_csv("starbucks_store_worldwide.csv")

# 使用matplotlib呈现出店铺总数排名前10的国家
# 准备数据
data1 = df.groupby(by='Country').count()['Brand'].sort_values(ascending=False)[:10]

_x = data1.index
_y = data1.values

plt.figure(figsize=(20, 8), dpi=80)

plt.bar(range(len(_x)), _y)

plt.xticks(range(len(_x)), _x)
plt.show()
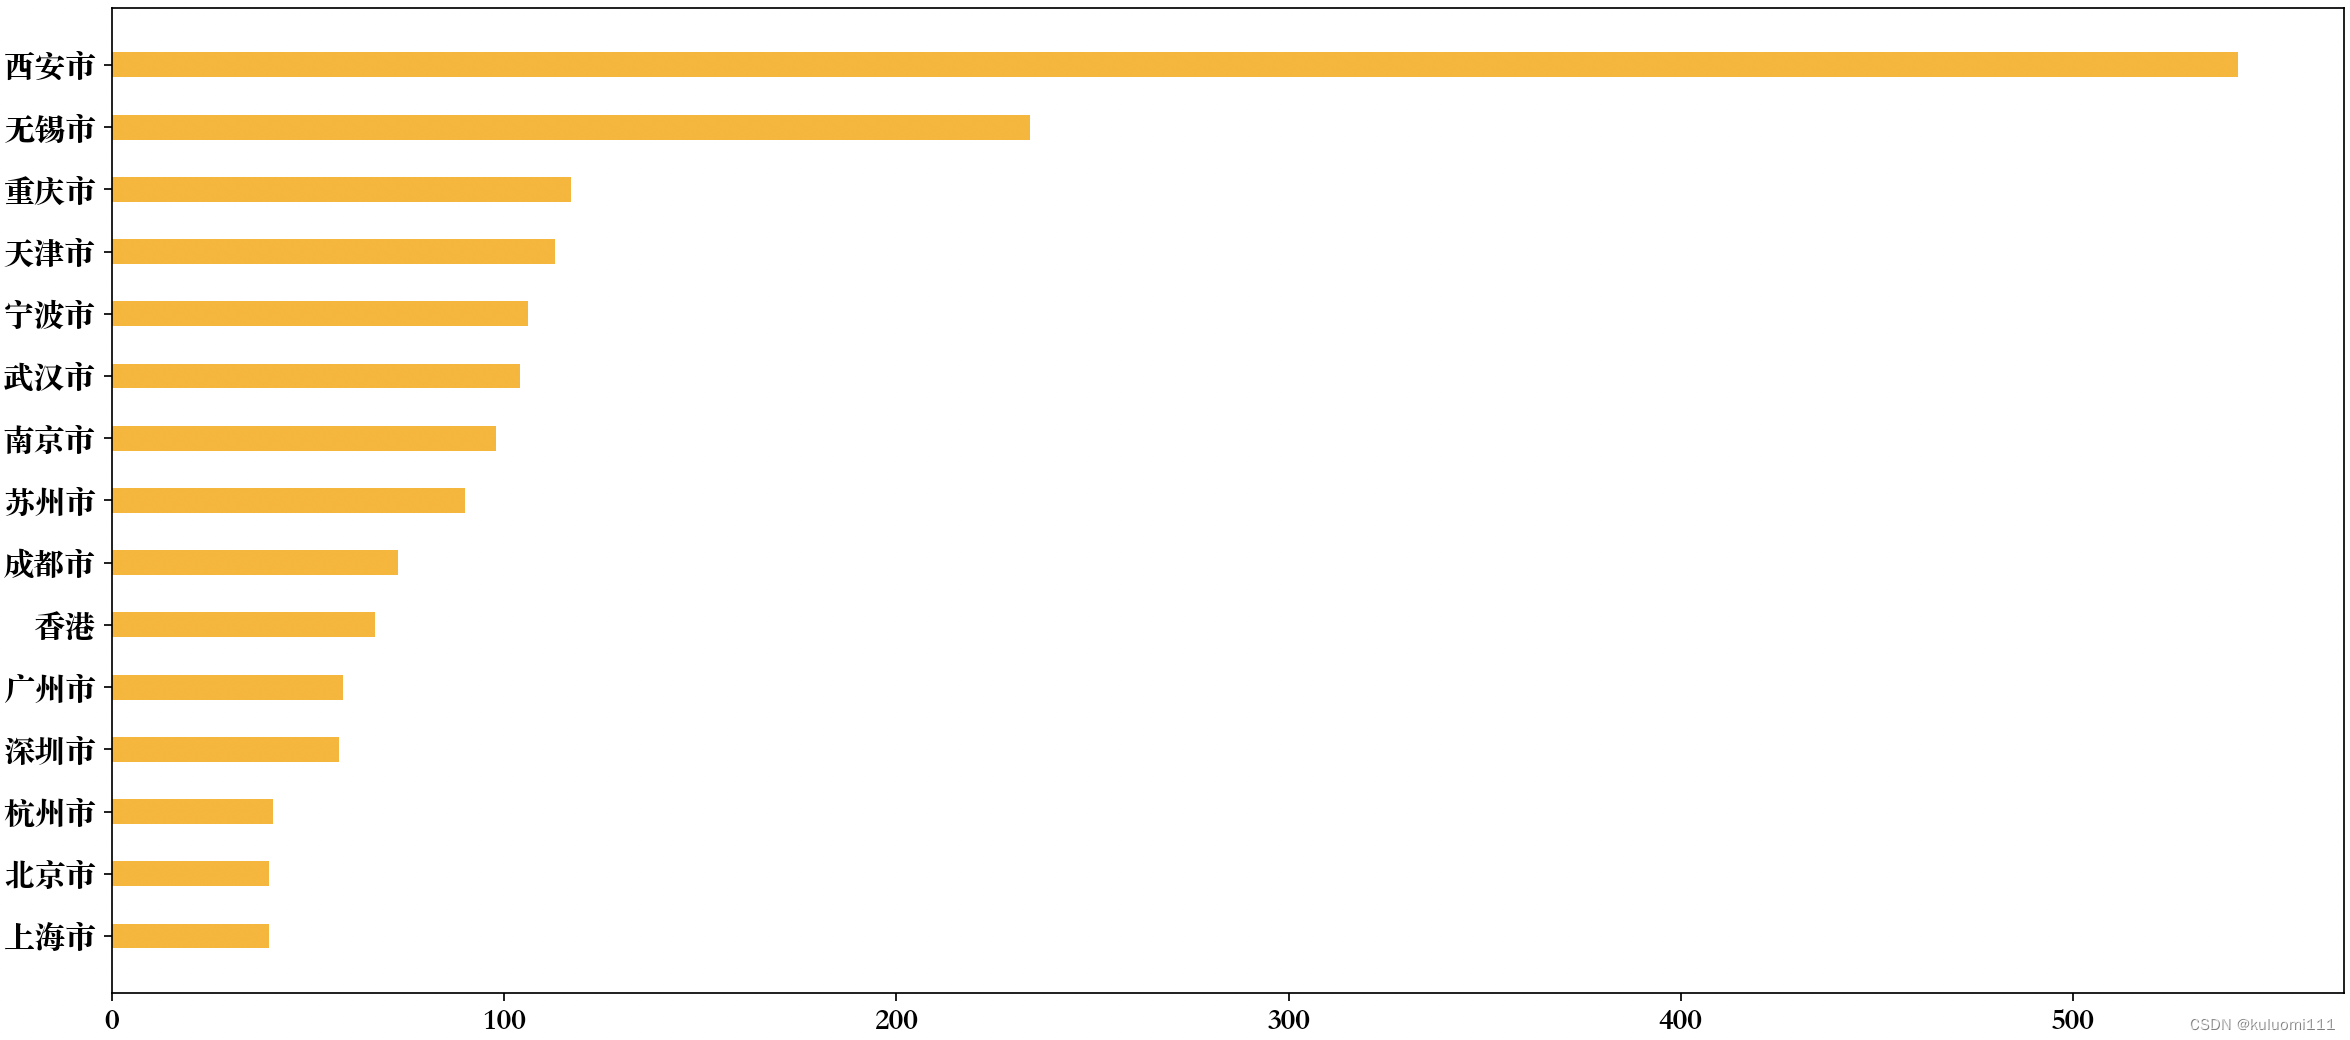
中国排名前10的城市
import matplotlib.pyplot as plt
import pandas as pd
from matplotlib.font_manager import FontProperties

font = FontProperties(fname="/System/Library/Fonts/Supplemental/Songti.ttc", size=14)


df = pd.read_csv("starbucks_store_worldwide.csv")
df = df[df['Country'] == 'CN']

# 使用matplotlib呈现中国排名前10城市的星巴克数据
data1 = df.groupby(by='City').count()['Brand'].sort_values(ascending=False)[:15]
data1 = data1.rename(index={'Hong Kong': '香港'})

_x = data1.index
_y = data1.values

plt.figure(figsize=(20, 8), dpi=80)

plt.barh(range(len(_x)), sorted(_y, reverse=False), height=0.4, color='orange')

plt.yticks(range(len(_x)), _x, fontproperties=font)
plt.xticks(fontproperties=font)
plt.show()
不同年份书的数量
df = pd.read_csv("books.csv")

# print(df.info())

data1 = df[pd.notnull(df['original_publication_year'])]

grouped = data1.groupby(by='original_publication_year').count()['title'][:10]
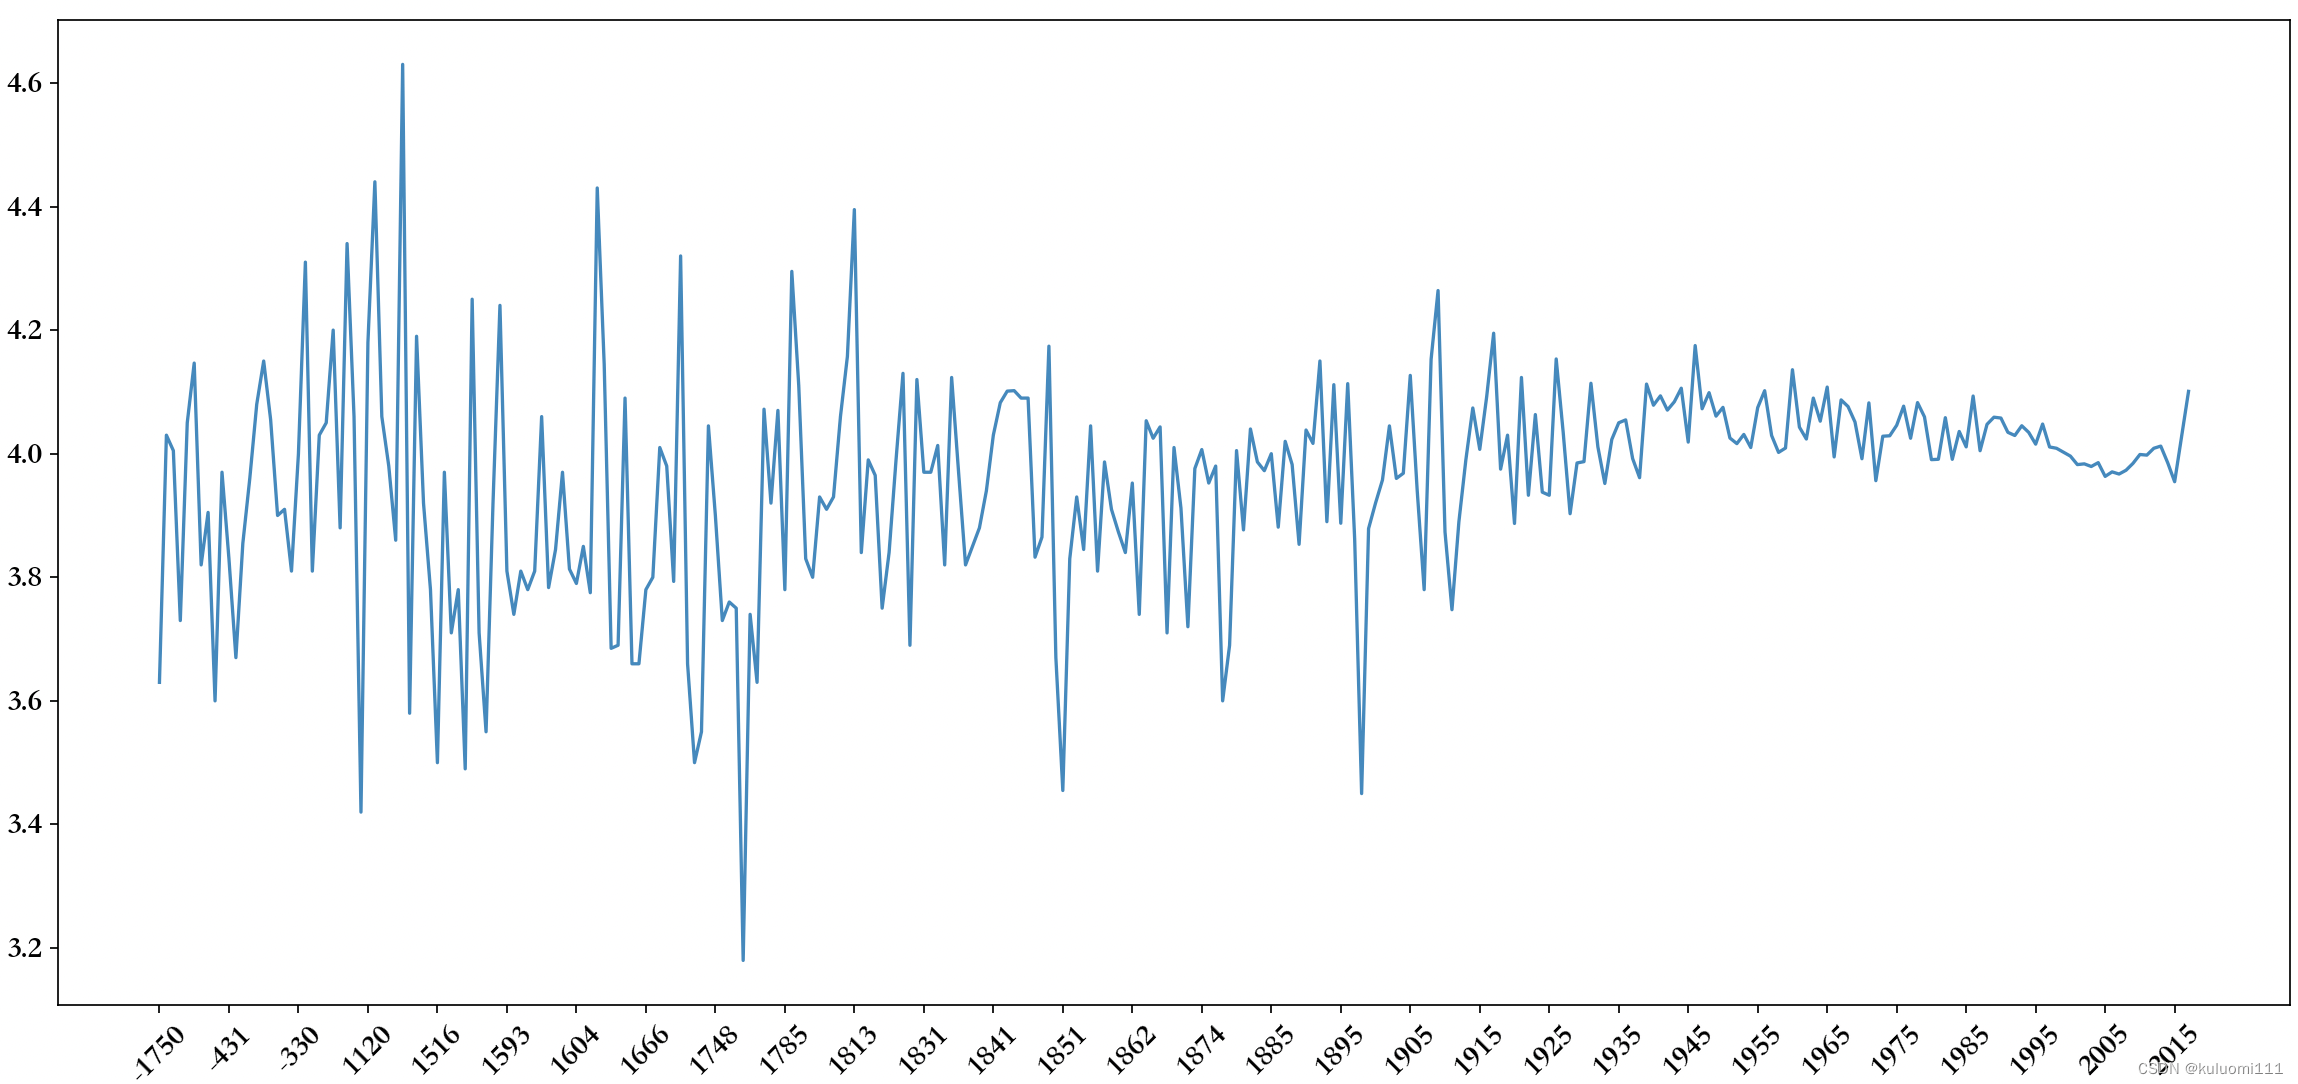
不同年份书的平均评分情况
data1 = df[pd.notnull(df['original_publication_year'])]

grouped = data1['average_rating'].groupby(by=data1['original_publication_year']).mean()

_x = grouped.index
_y = grouped.values

plt.figure(figsize=(20, 8), dpi=80)

plt.plot(range(len(_x)), _y)

plt.xticks(list(range(len(_x)))[::10], _x[::10].astype(int), fontproperties=font, rotation=45)
plt.yticks(fontproperties=font)

plt.show()
七、总结
把字符串离散化
- 获取字符串的去重后列表
- 构造全为0的数组,columns为字符串的列表
- 给全为0的数组赋值,遍历
join
- 按照index进行分组
- t1.join(t2)
merge
- 按照列数据进行分组
- t1.merge(t2, on=‘a’, how=‘inner’) 内连接
- t1.merge(t2, on=‘a’, how=‘outter’) 外连接
- t1.merge(t2, on=‘a’, how=‘left’) 以t1为准
- t1.merge(t2, on=‘a’, how=‘right’) 以t2为准
- t1.merge(t2, left_on=‘a’, right_on = ‘b’, how=‘right’) 没有相同的列名时
分组聚合
- df.groupby(by=‘xx’)得到groupby对象,能够调用聚合方法,能够遍历
- df.groupby(by=‘xx’).count()
- df.groupby(by=‘xx’).mean()
- df.groupby(by=‘xx’, ‘xx’).sum() 带复合索引的dataframe
索引
- df.index
- df.index=[‘a’, ‘c’] 设置索引的值
- df.set_index(‘a’) 设置某一列为索引
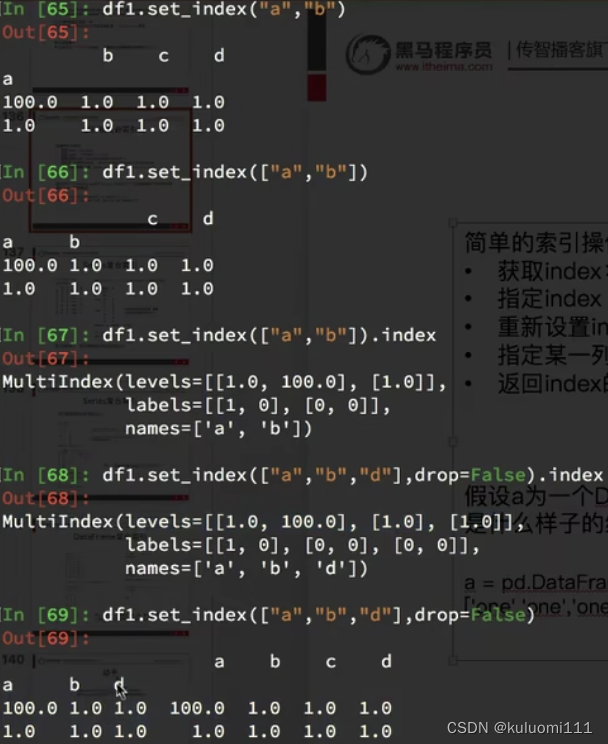
- df.set_index([‘a’, ‘c’])
- 从复合索引中取值 series: s1[‘a’][‘b’] s1[‘a’, ‘b’] dataframe df.loc[‘a’].loc[‘b’]
- 从里层索引开始选择 df.swaplevel() 交换里外层索引的位置


 214
214


 被折叠的 条评论
为什么被折叠?
被折叠的 条评论
为什么被折叠?
 到【灌水乐园】发言


