


来源:B站、CSDN、微信公众号等平台整理,非商用!
1、什么是监控,为什么需要监控
监控:监视,控制
随着用户的增多,服务随时可能会被系统oom out of memory 内存溢出 kill -9 mysql
你怎么判断,web服务是因为用户访问过多,达到了瓶颈?还是程序代码bug导致的,内存过多?
上线一个新网站: 压力测试 2000并发, oom: out of memoery
监控,10—>1500, 2000
2、常见的linux监控命令
http://man.linuxde.net/par/3
free
df
top
htop(epel)
uptime
iftop
iostat
iotop
vmstat
netstat(下午提问tcp的三次握手,四次挥手)
nethogs 每一个进程用了多少流量
总结:cpu,内存,硬盘,网络
3、使用shell脚本监控服务器
#!/bin/bash
while true
do
  Free=`free -m | awk 'NR==2{print $NF}'`
  if [ $Free -lt 100 ]
  then
     echo $Free | mail -s "当前内存" y3967z@163.com
  fi
  sleep 60
done

ab -n 10000 -c 3 http://10.0.0.100/zabbix/index.php
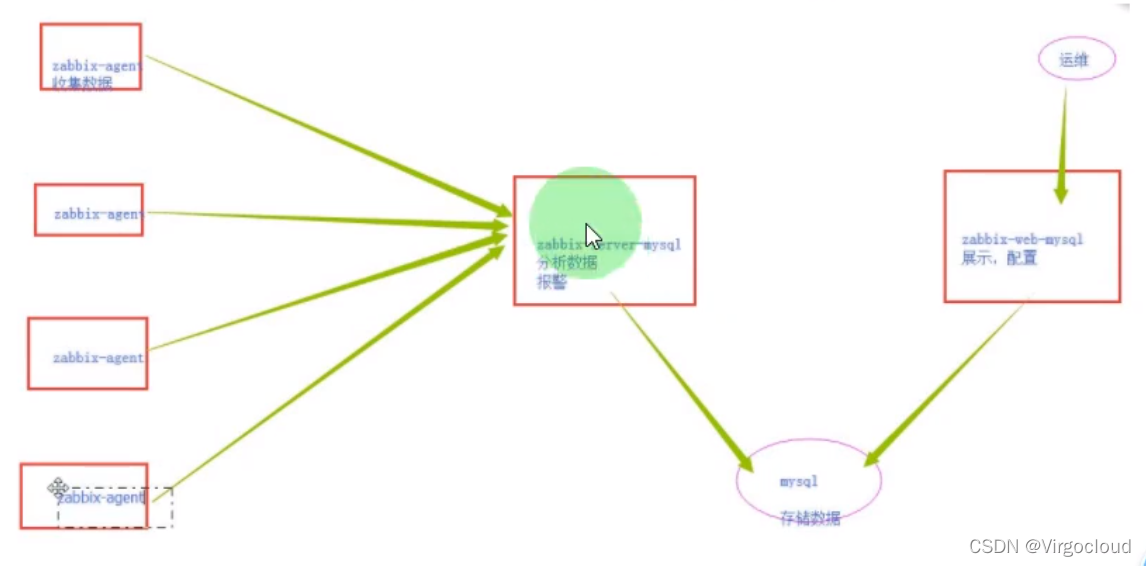
4、zabbix的基础服务架构
5、zabbix生产环境安装
-
zabbix LTS 5年
-
zabbix 标准版 7个月
# 1、wget安装包
wget http://repo.zabbix.com/zabbix/4.0/rhel/7/x86_64/zabbix-release-4.0-1.el7.noarch.rpm
# 2、安装
rpm -ivh zabbix-release-4.0-1.el7.noarch.rpm
# 3、安装zabbix服务端和zabbix-web前端
yum install zabbix-server-mysql zabbix-web-mysql -y
# 4、安装mariadb,创建zabbix库,授权zabbix用户
yum install mariadb-server -y
# 5、启动数据库并设置开机自启
systemctl start mariadb && systemctl enable mariadb
#6、初始化数据库
mysql_secure_installation
回车
n
.
.
.
y
# 7、授权数据库并设置字符集
MariaDB [(none)]> create database zabbix character set utf8 collate utf8_bin;
MariaDB [(none)]> grant all privileges on zabbix.* to zabbix@localhost identified by
'123456';
# 8、导入zabbix表结构和初始数据
zcat /usr/share/doc/zabbix-server-mysql*/create.sql.gz | mysql -uzabbix -p123456 zabbix
# 9、检查zabbix库是否导入成功
mysql -uroot zabbix -e 'show tables' ##返回表格即为成功##
# 10、配置启动zabbix-server
vi /etc/zabbix/zabbix_server.conf
DBHost=localhost
DBName=zabbix
DBUser=zabbix
DBPassword=123456
# 11、启动zabbix-server
systemctl start zabbix-server && systemctl enable zabbix-server
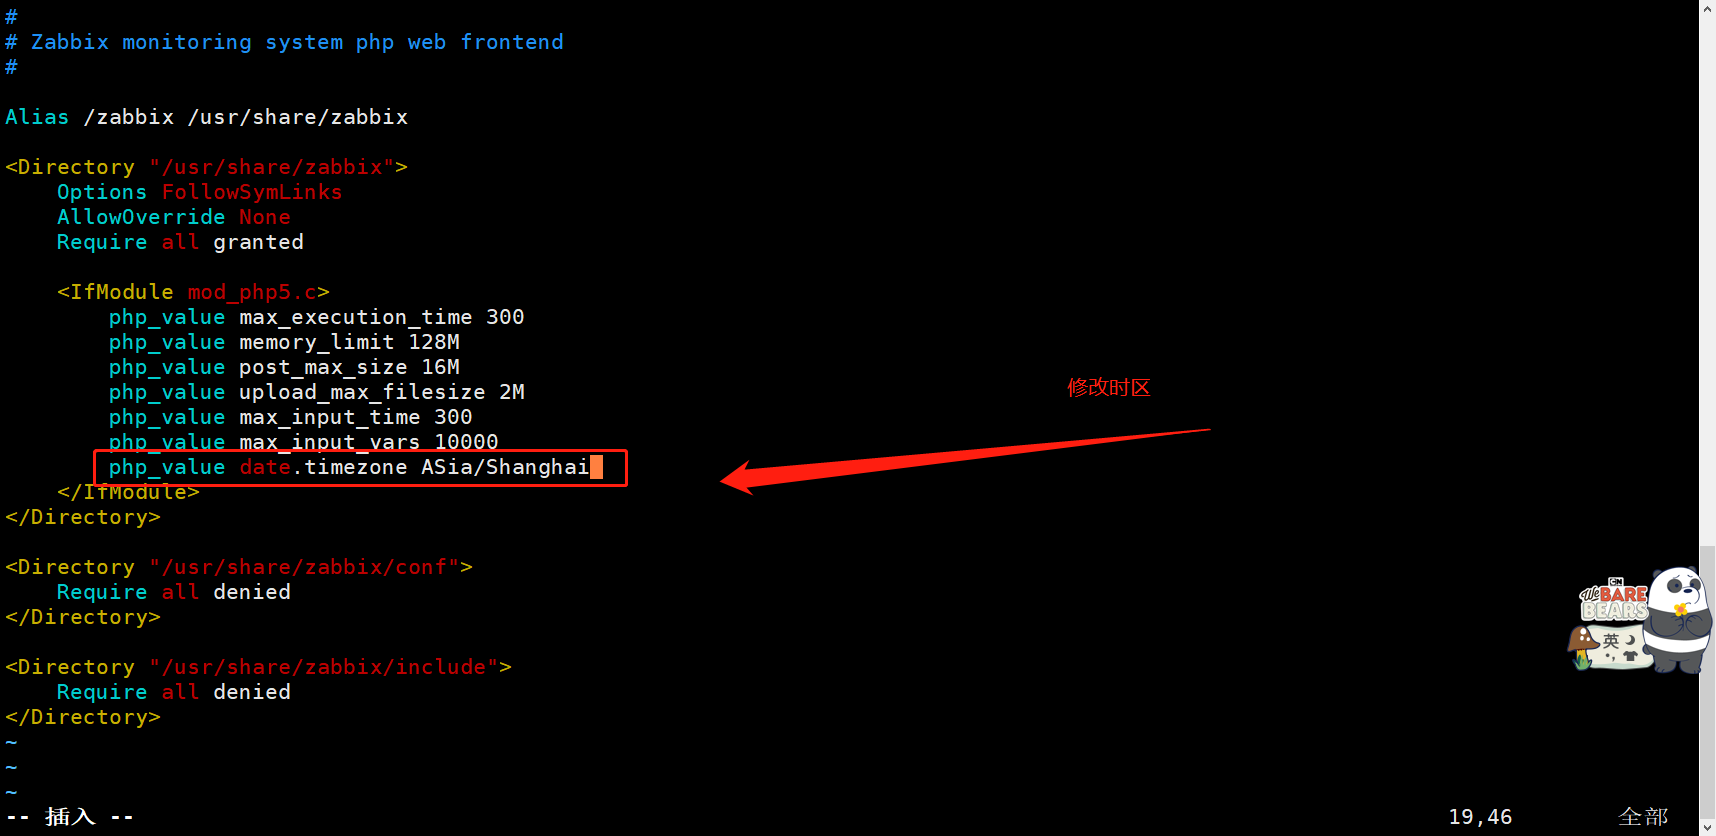
# 12、修改Zabbix前端的PHP配置,并启动httpd
vi /etc/httpd/conf.d/zabbix.conf
php_value date.timezone Asia/Shanghai
systemctl start httpd && systemctl enable httpd
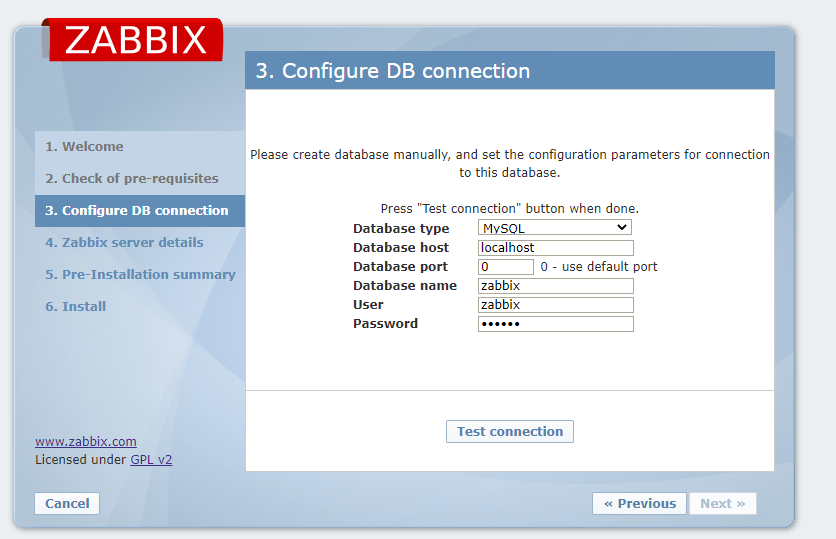
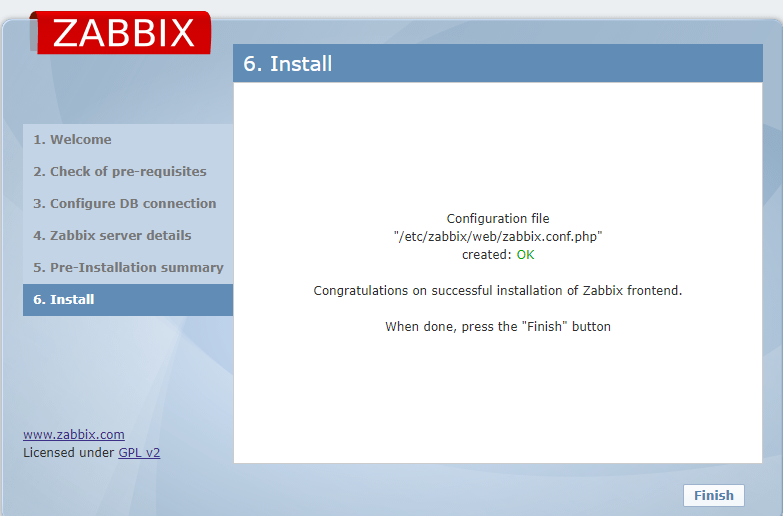
# 13、前端zabbix-web的安装
http://IP/zabbix
# 14、后期修改zabbix数据库密码的时候,需要修改的配置文件:
/etc/zabbix/web/zabbix.conf.php.
# 15、http://IP/zabbix/zabbix.php
登录的账号密码;
Admin
zabbix
6、监控一台服务器主机
6.1、安装zabbix-agent
rpm -ivh https://mirror.tuna.tsinghua.edu.cn/zabbix/zabbix/4.0/rhel/7/x86_64/zabbix-agent-4.0.11-1.el7.x86_64.rpm
6.2、配置zabbix-agent
vim /etc/zabbix/zabbix_agentd.conf
Server=10.0.0.61 (IP为zabbix服务器地址)
#监控zabbix服务器不用改配置文件,直接安装zabbix-agent即可
6.3、启动zabbix-agent
systemctl start zabbix-agent && systemctl enable zabbix-agent
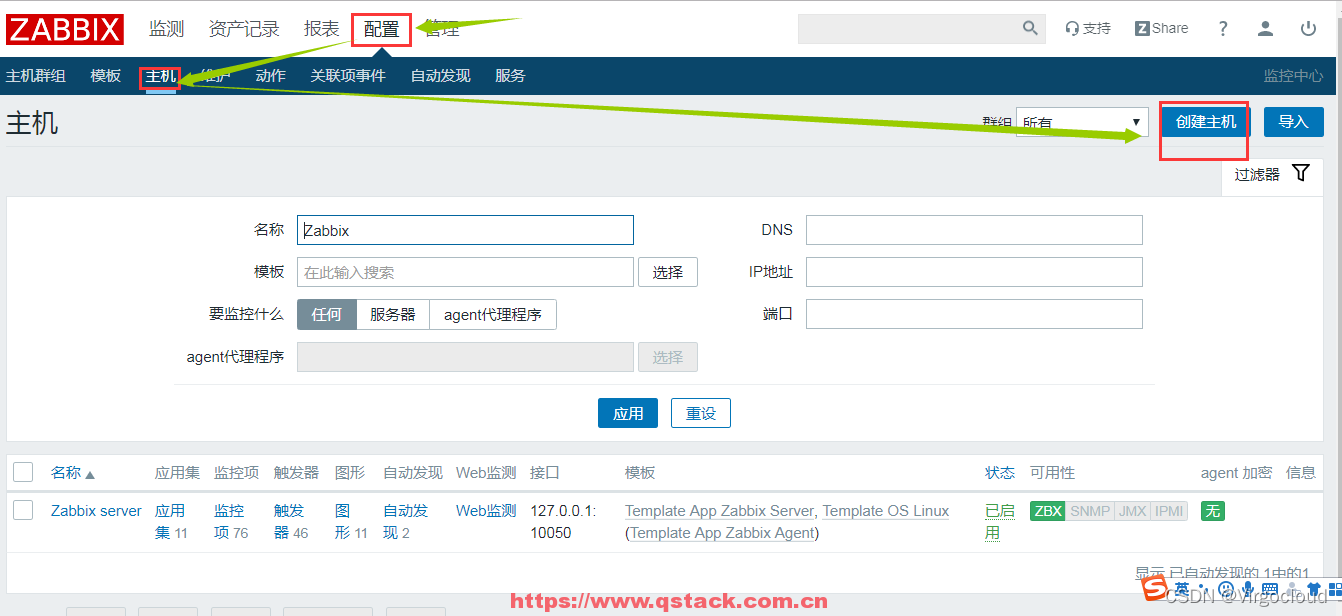
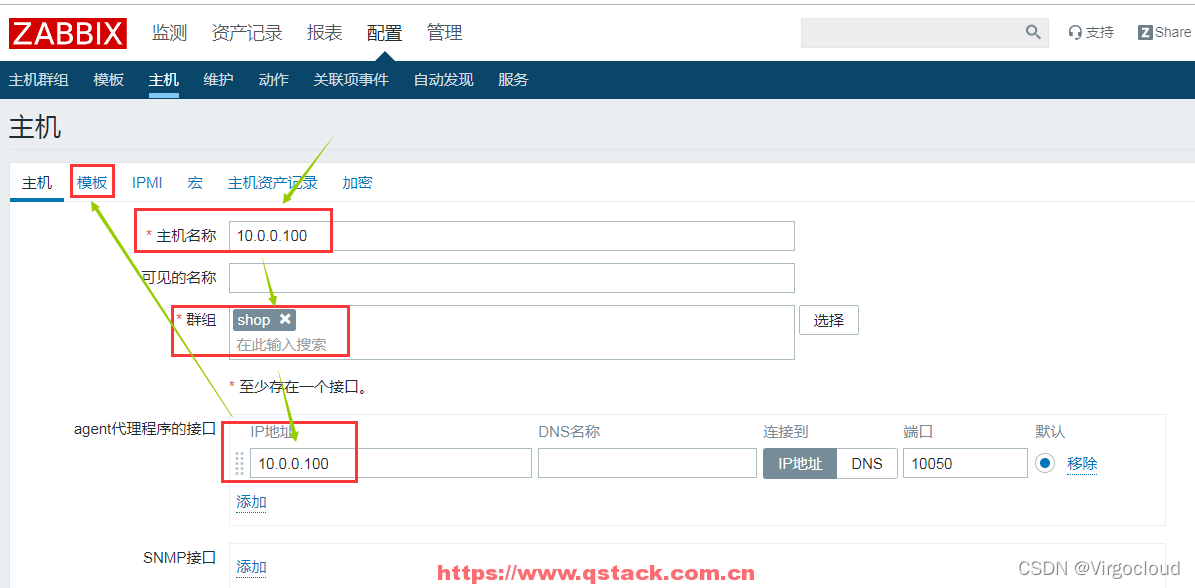
6.4、zabbix-web界面,添加主机

7、自定义监控项
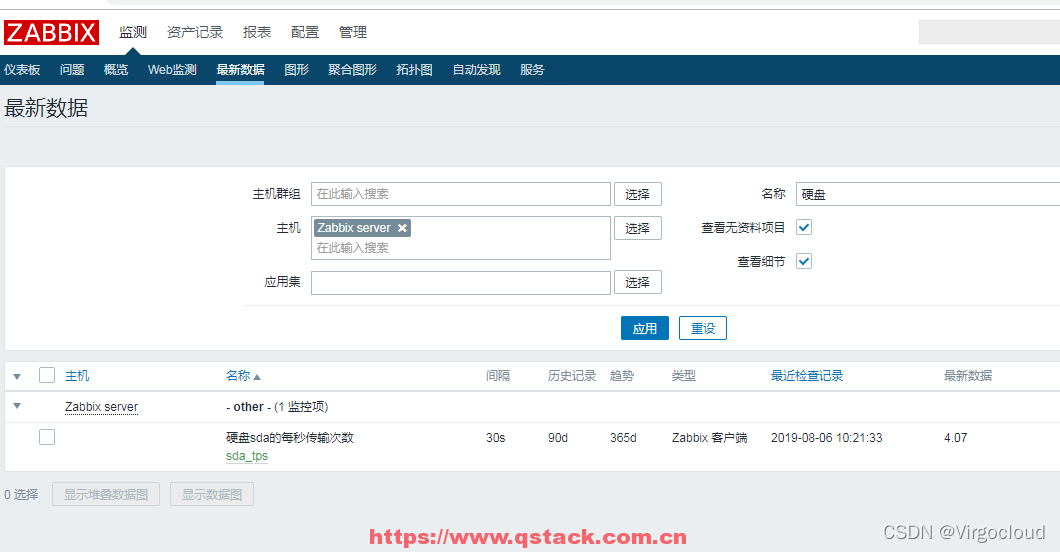
7.1、命令行,手动取值
[root@zabbix-server ~]# iostat|awk '$1 ~/sda/'
sda               4.07        41.98        68.30     255455     415578
[root@zabbix-server ~]# iostat|awk '$1 ~/sda/{print $2}'
4.07
注:安装iostat命令:yum install sysstat -y
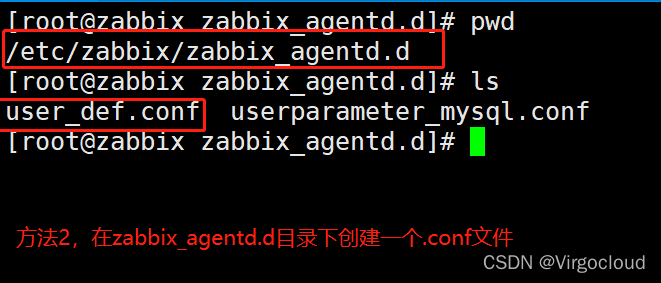
7.2、修改zabbix-agent配置文件
修改配置文件有两种方法:
1、直接修改zabbix_agentd.conf
2、创建一个新的.conf放在zabbix_agentd.conf.d目录下,zabbix_agentd.conf默认是允许导入配置文件
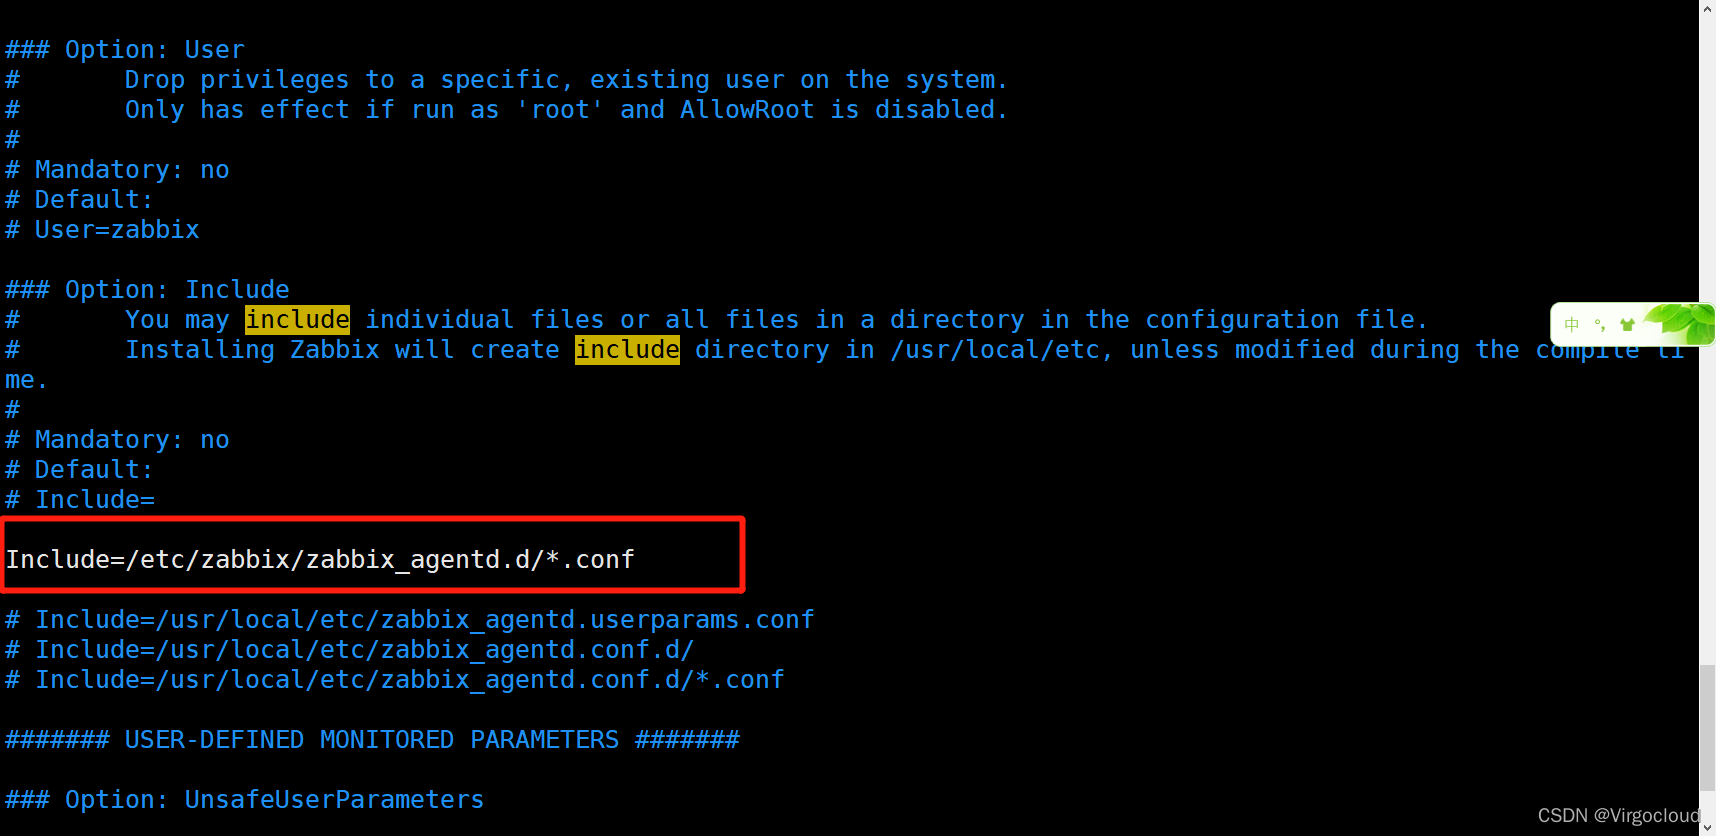
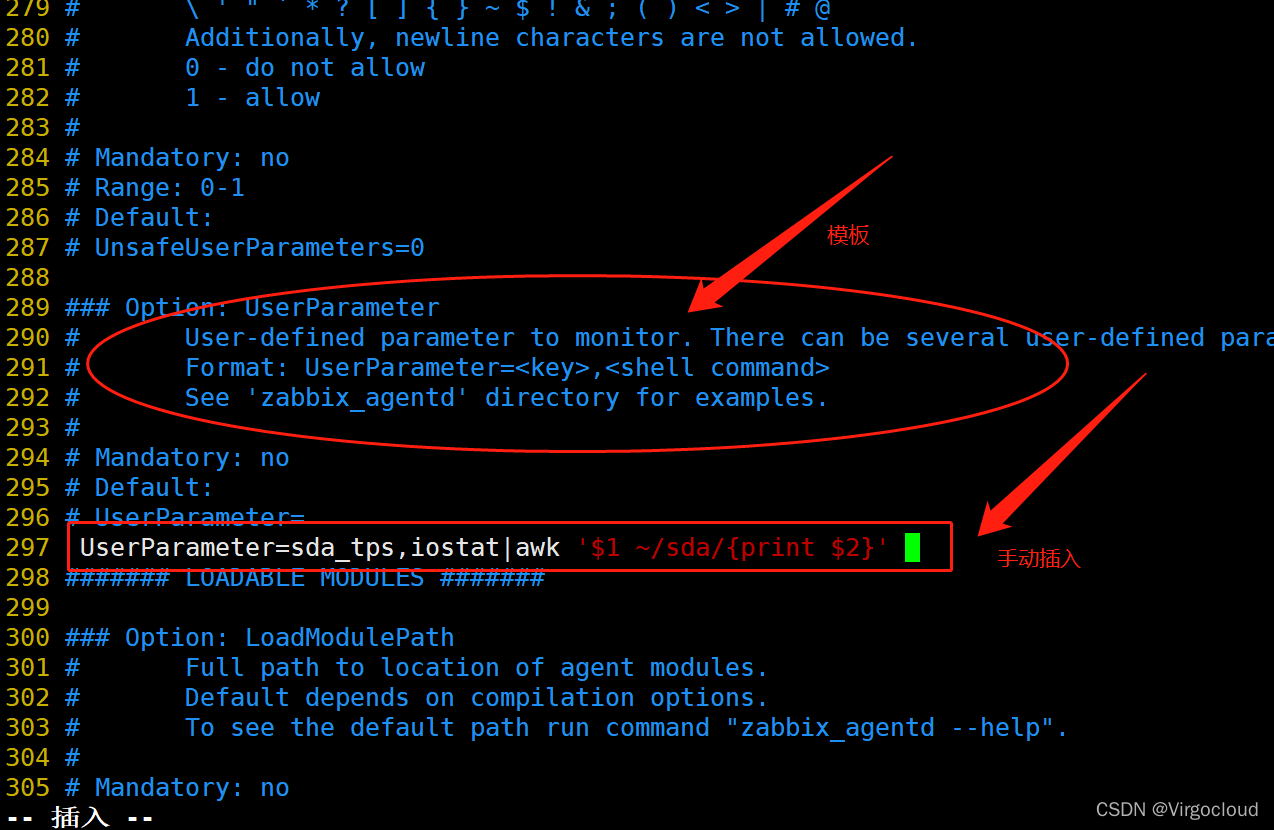
#使用方法1,直接修改zabbix_agentd.conf文件
vim /etc/zabbix/zabbix_agentd.conf

UserParameter=sda_tps,iostat|awk '$1 ~/sda/{print $2}'
#格式:key,shell脚本 (key名称自定义)

systemctl restart zabbix-agent.service
#必须重启zabbix-agent配置文件才能生效
7.3、zabbix_get测试监控项取值
zabbix_get  -s 127.0.0.1 -k sda_tps
#安装zabbix_get命令 yum install zabbix-get.x86_64 -y
#注:只有在zabbix在有这个包,其他服务器需要额外找这个包
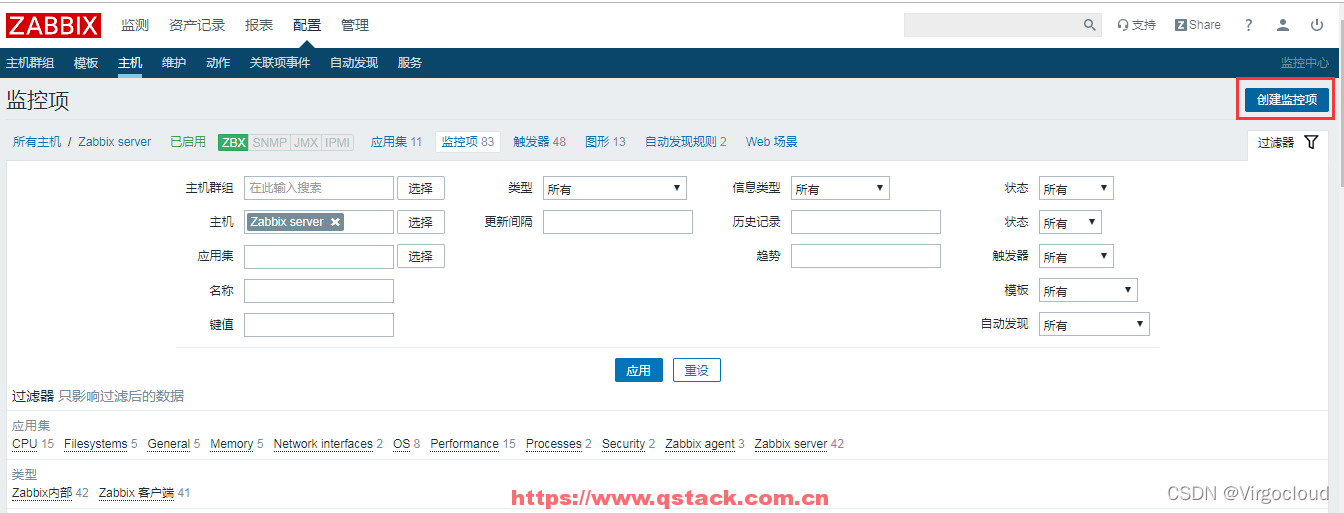
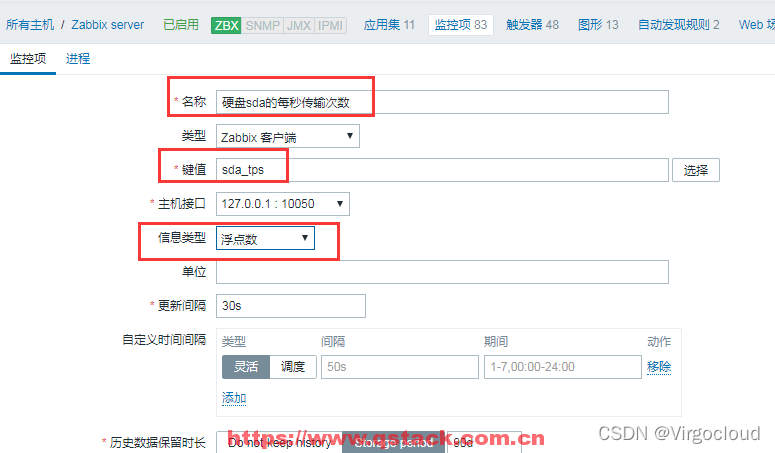
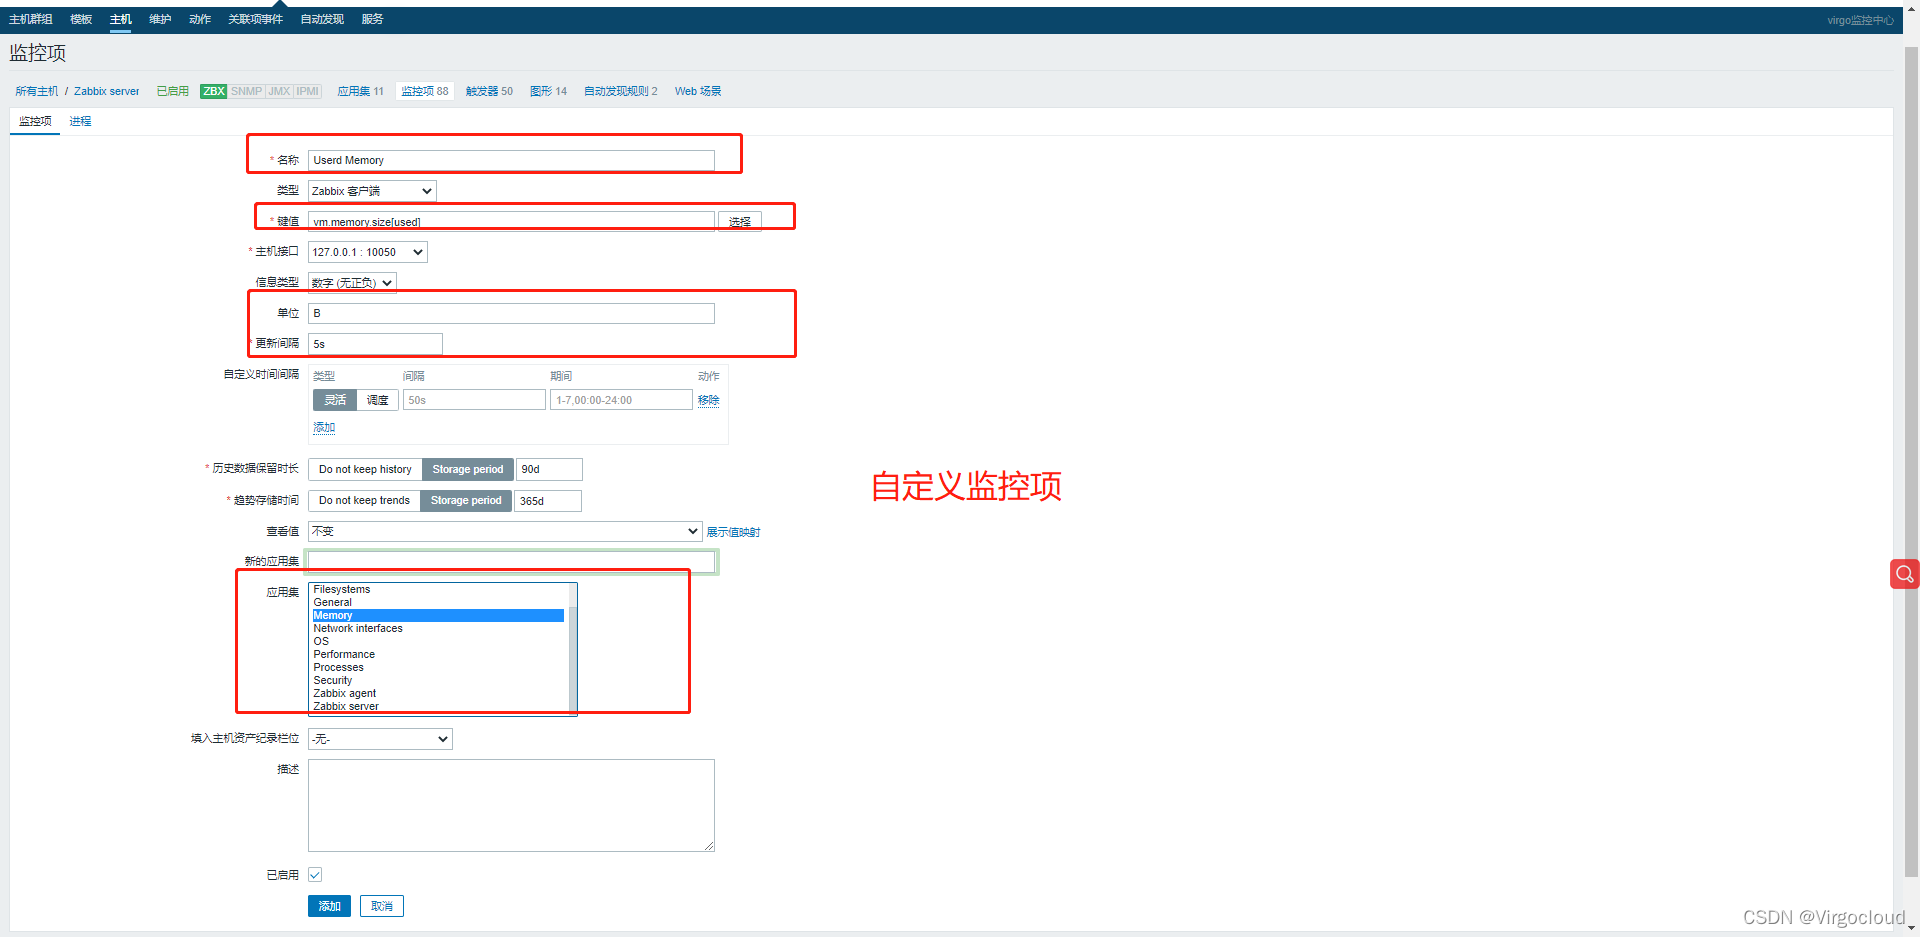
7.4、在web界面添加自定义监控项
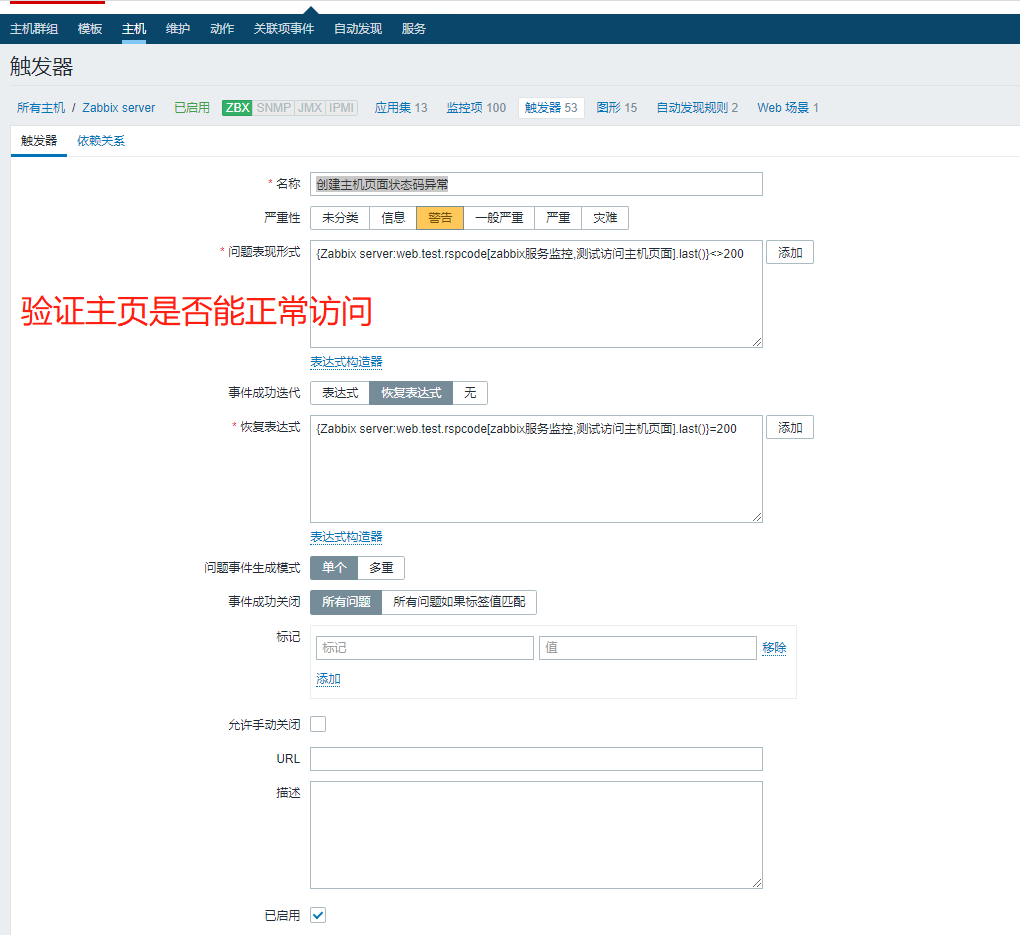
8、自定义触发器

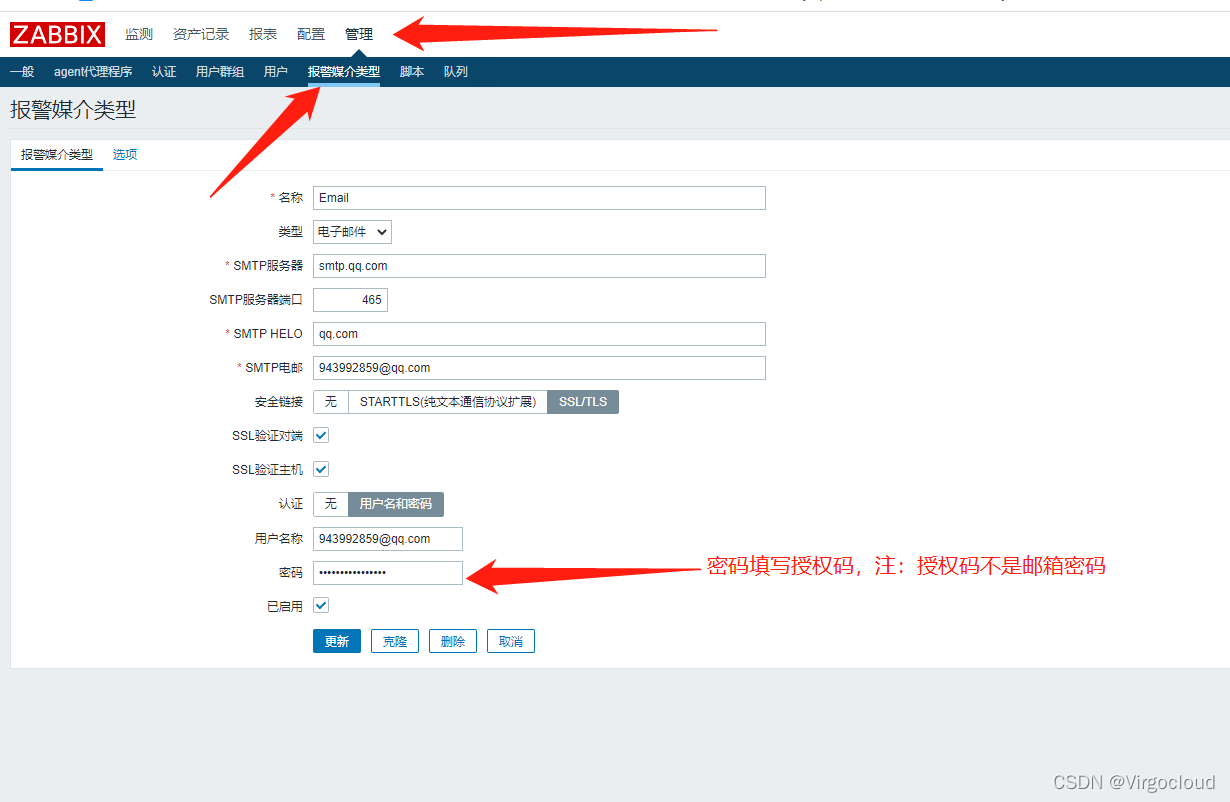
9、邮件报警
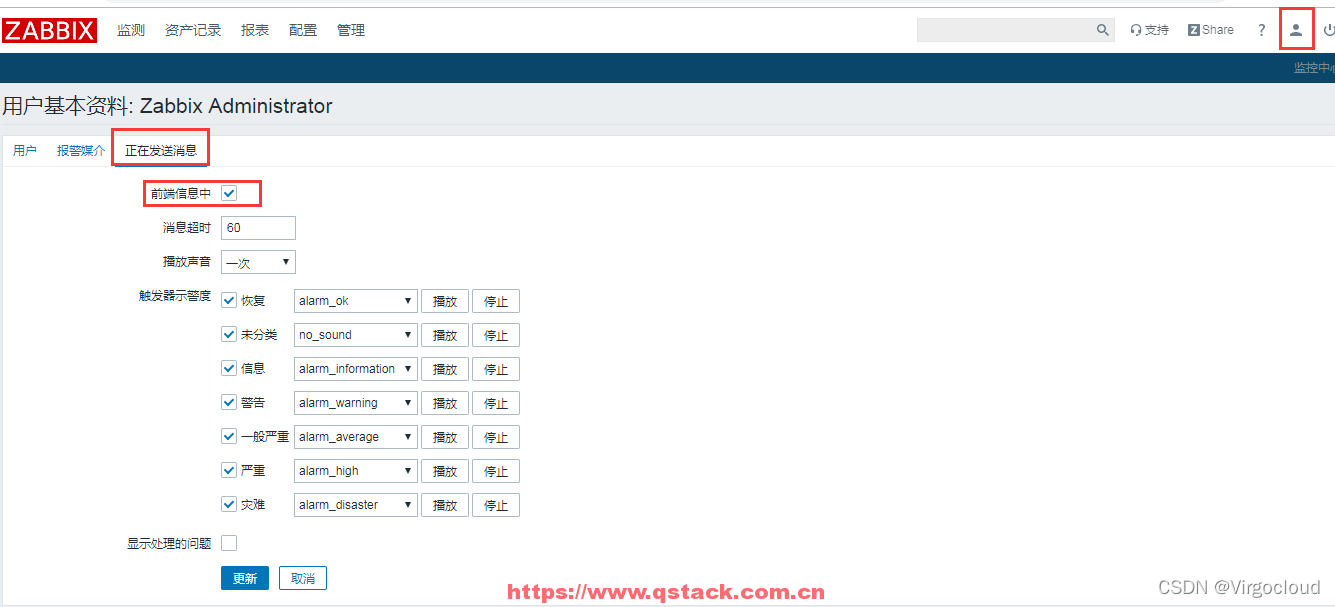
9.1、设置发件人
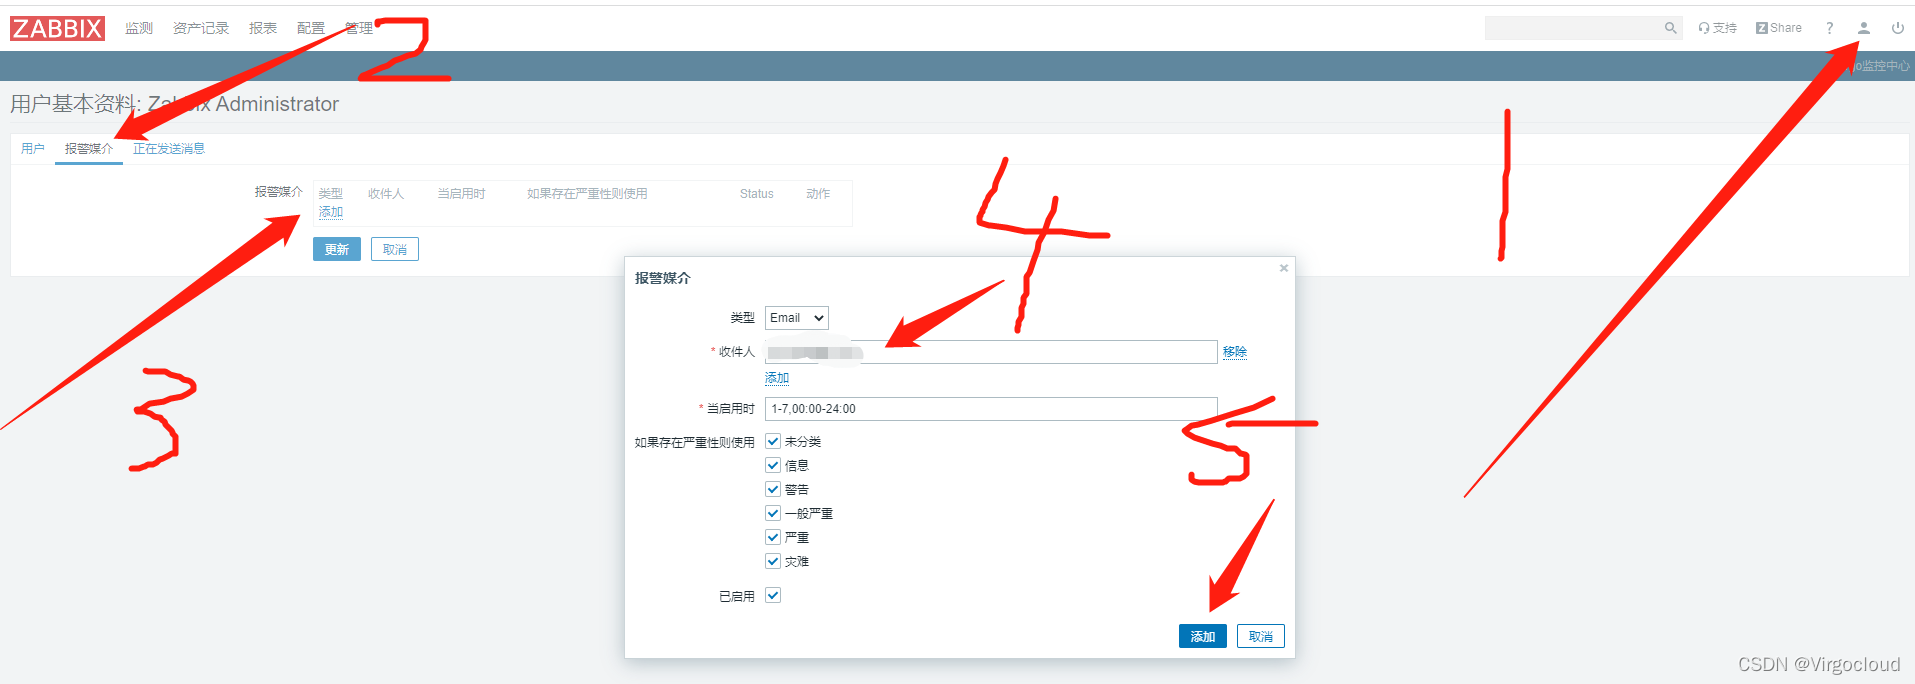
9.2、设置收件人
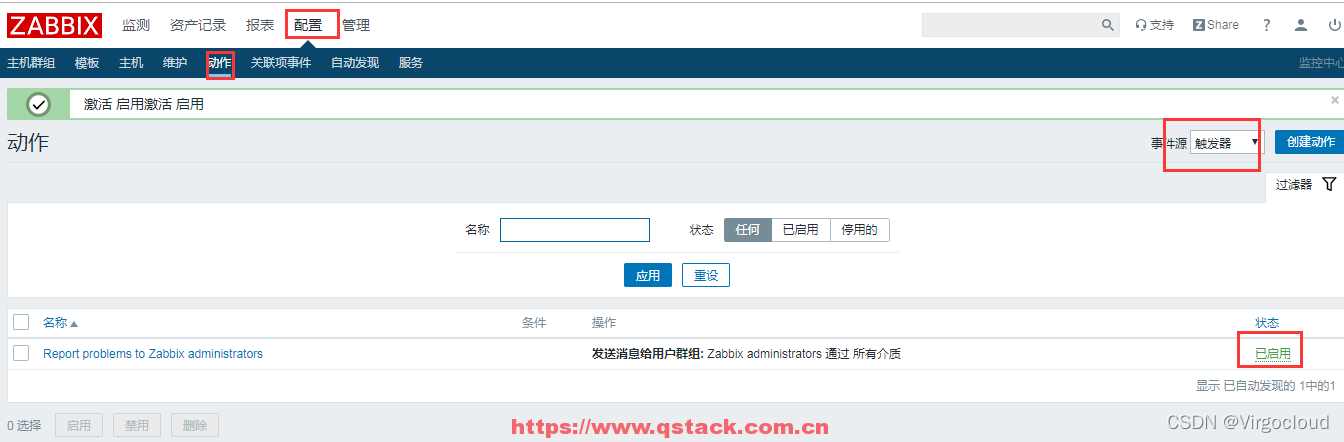
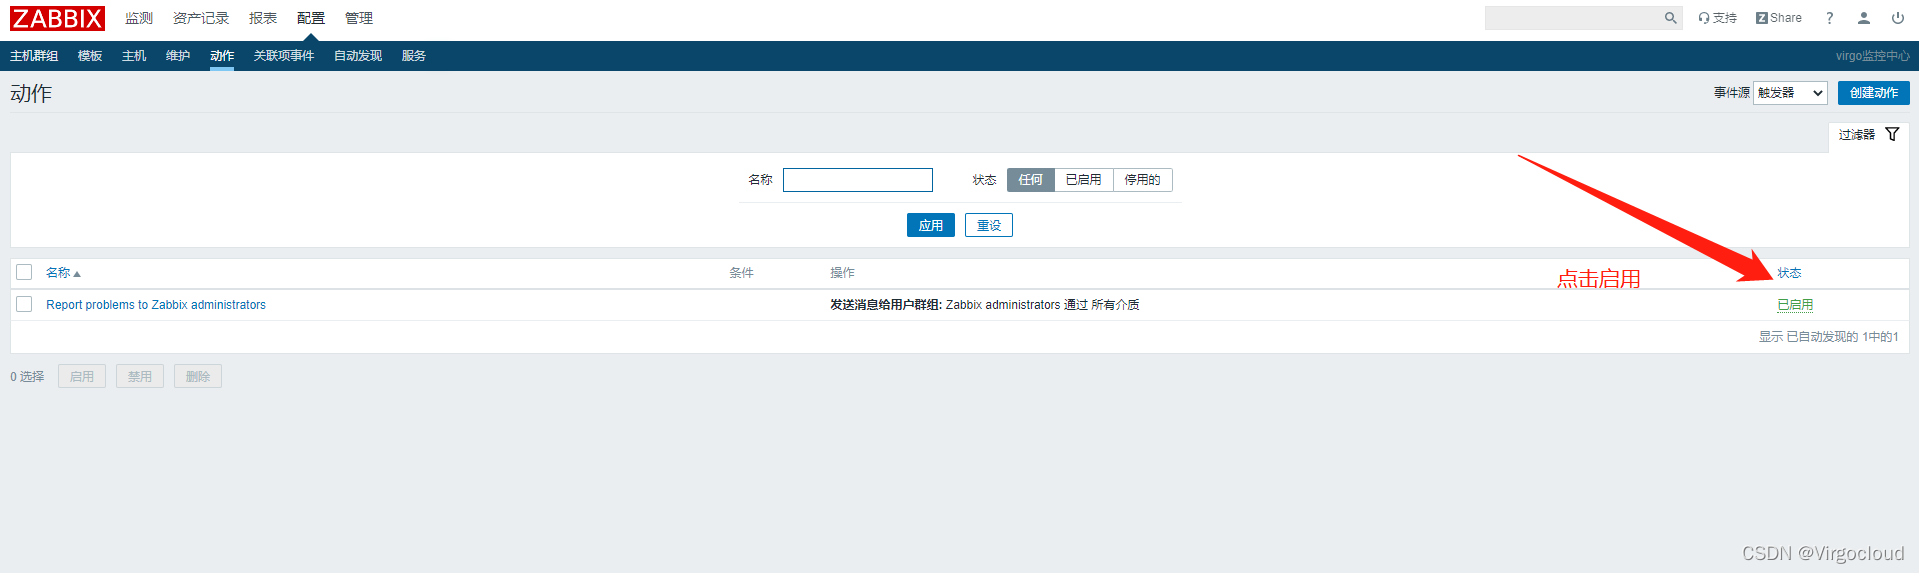
9.3、启动动作
10、微信报警(后期再补充)
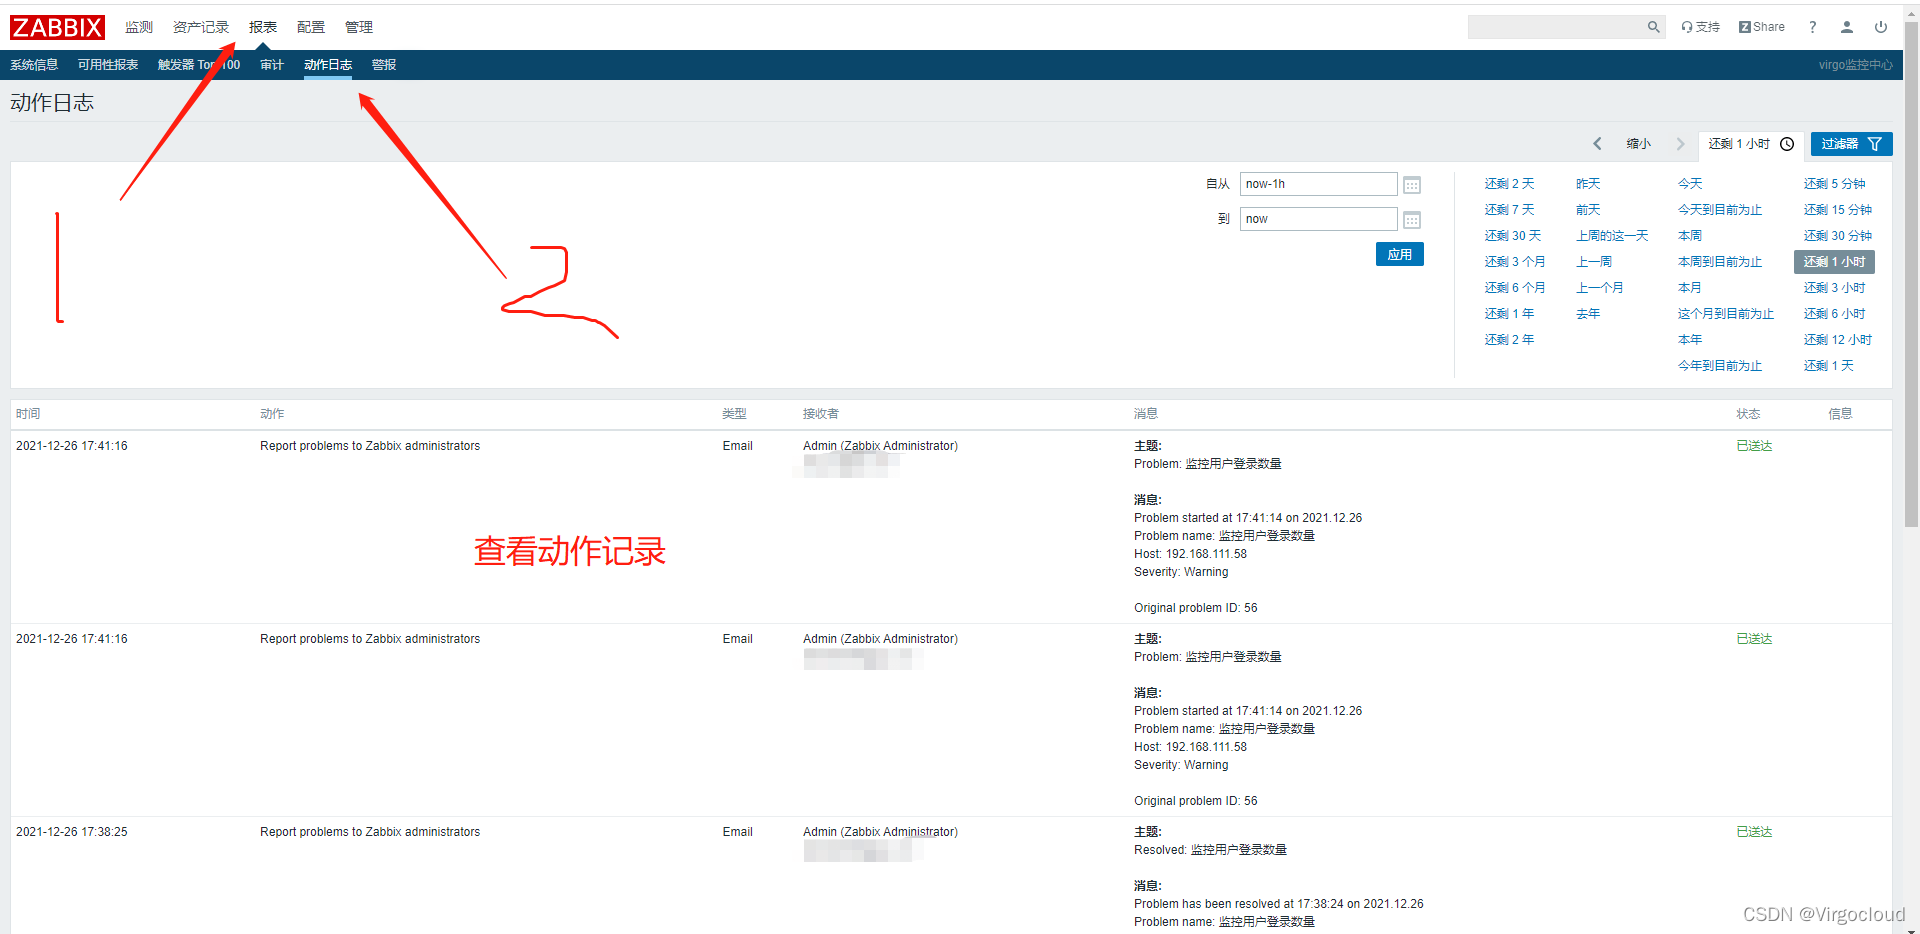
11、查看动作日志
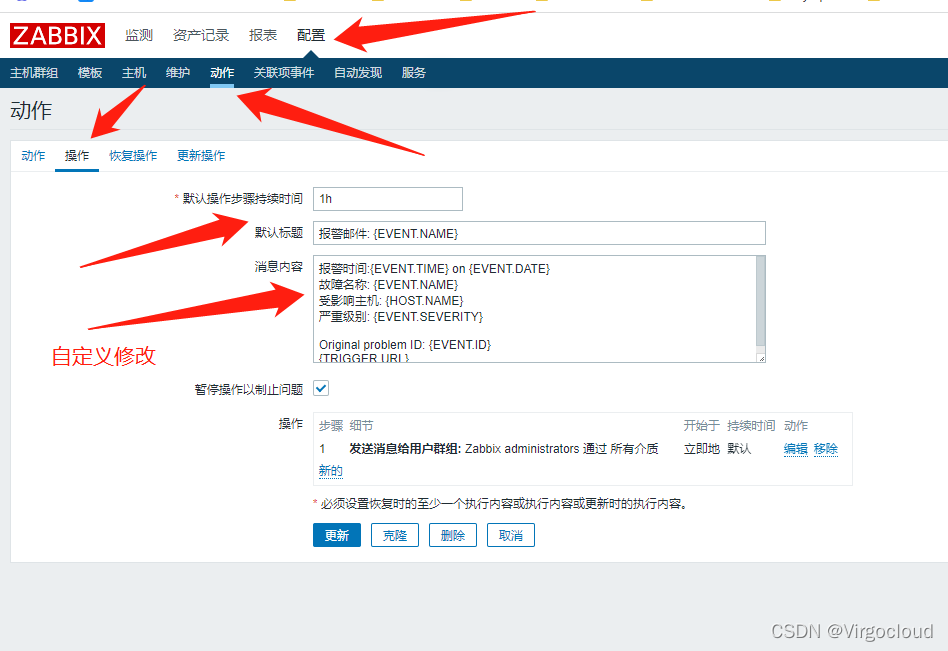
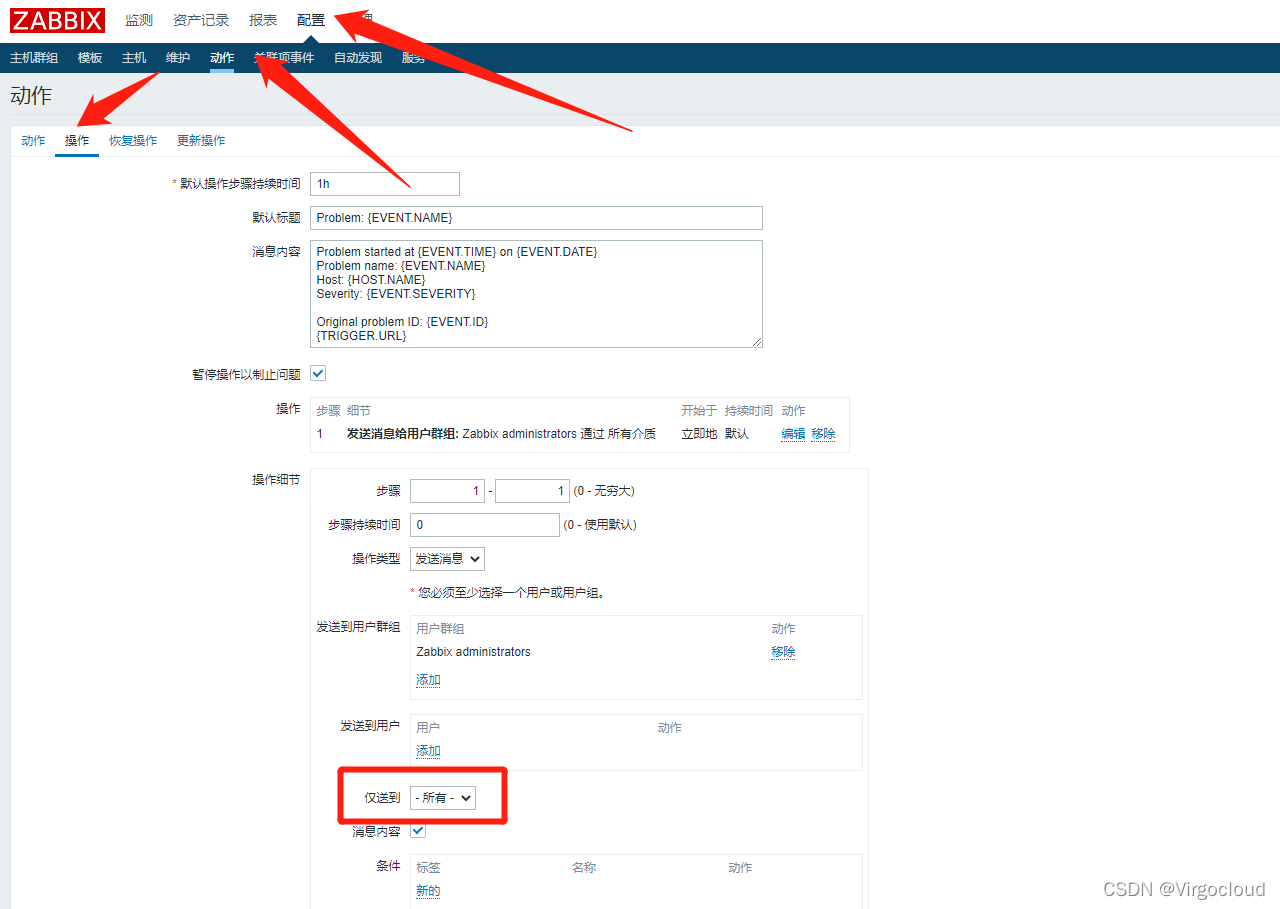
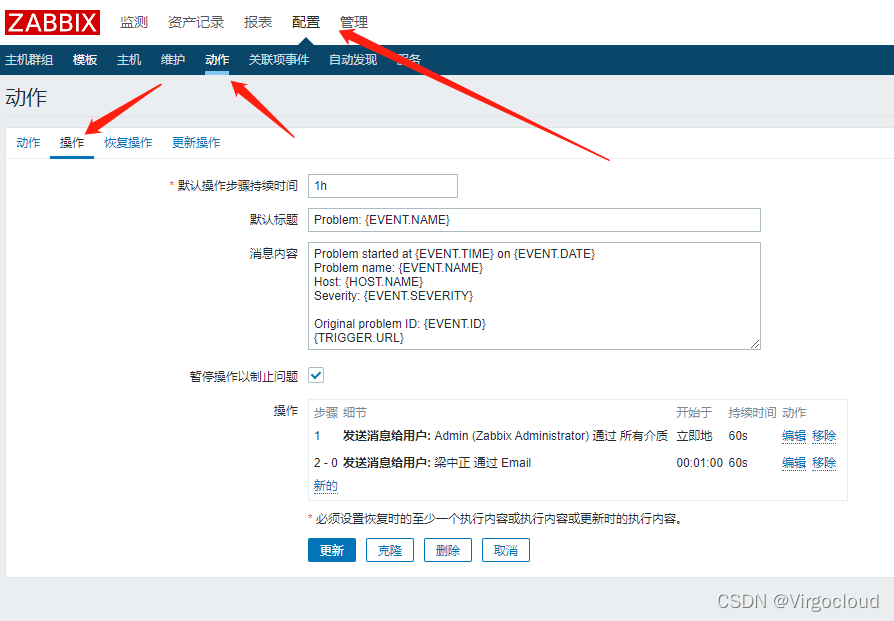
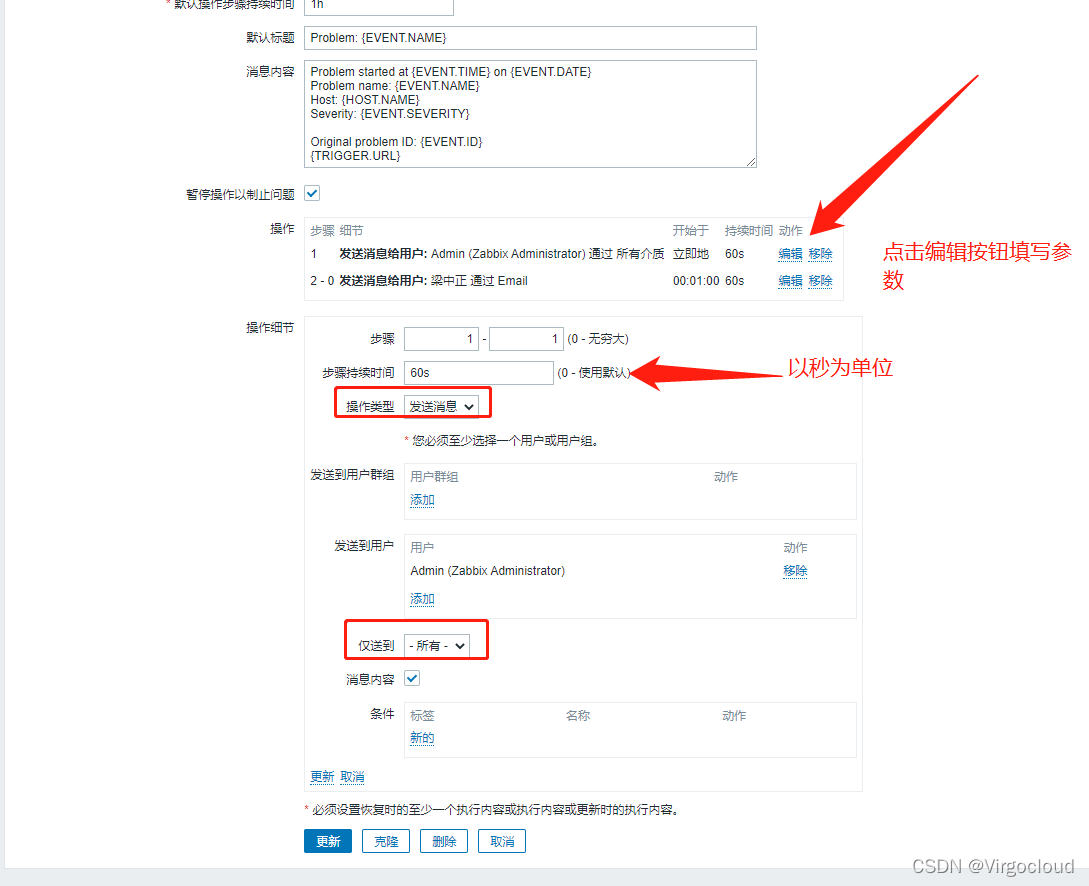
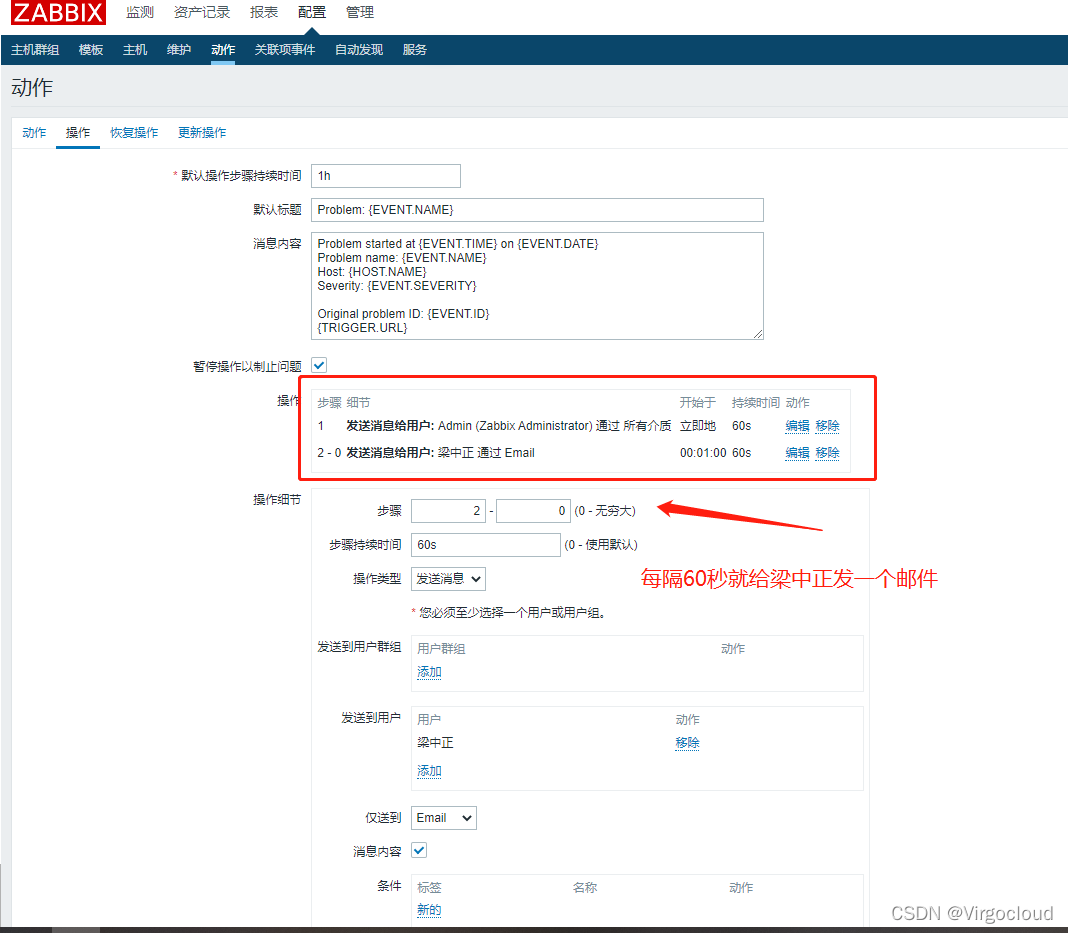
12、故障预处理和报警升级
配置→动作→Report problems to Zabbix administrators→操作
操作类型:发送消息 远程命令
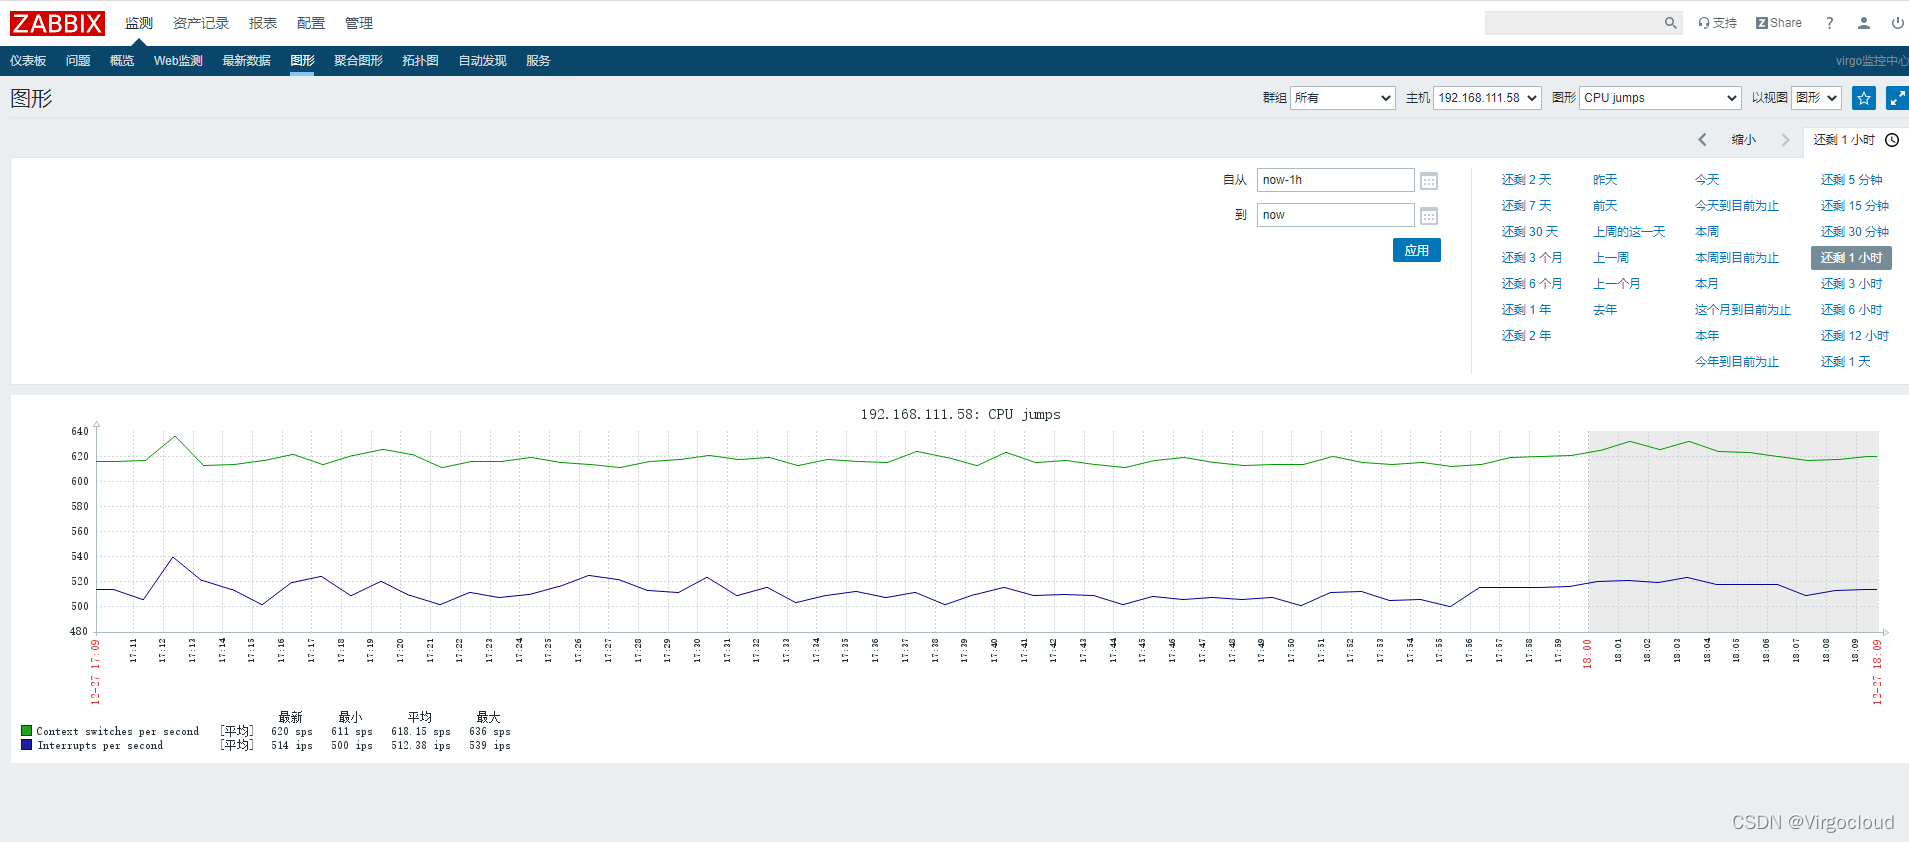
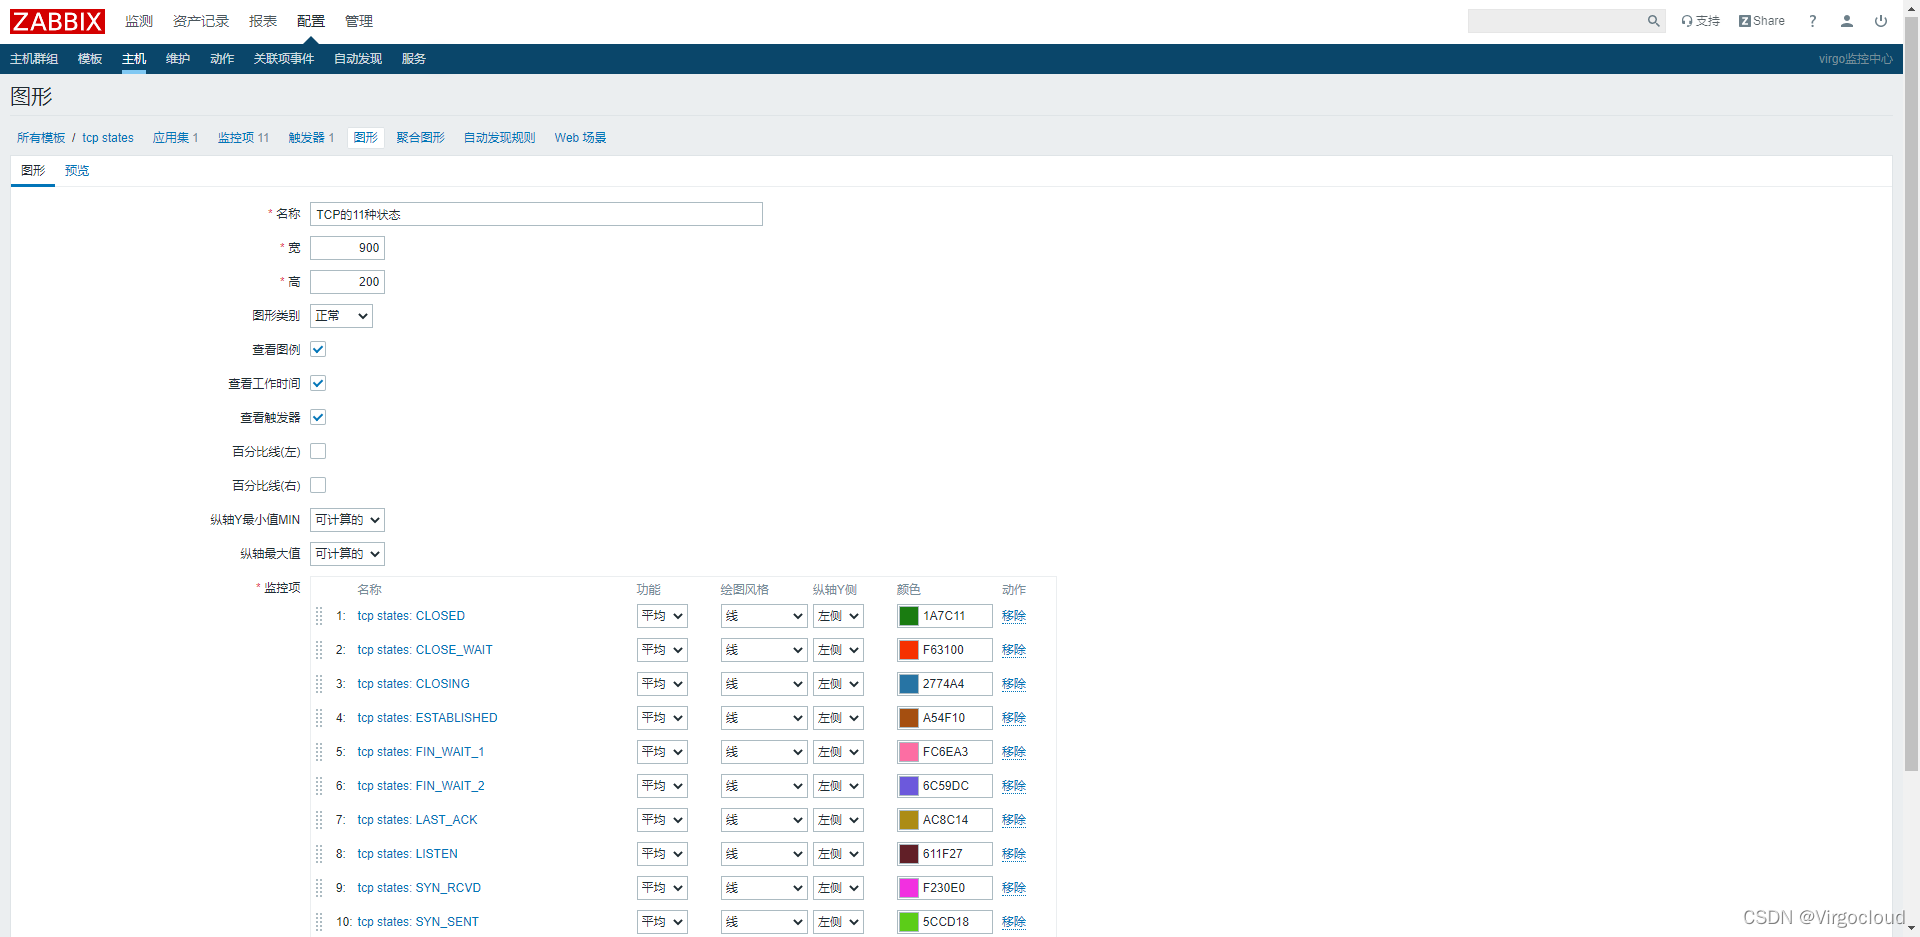
13、zabbix自定义图形
13.1、字体乱码解决方案
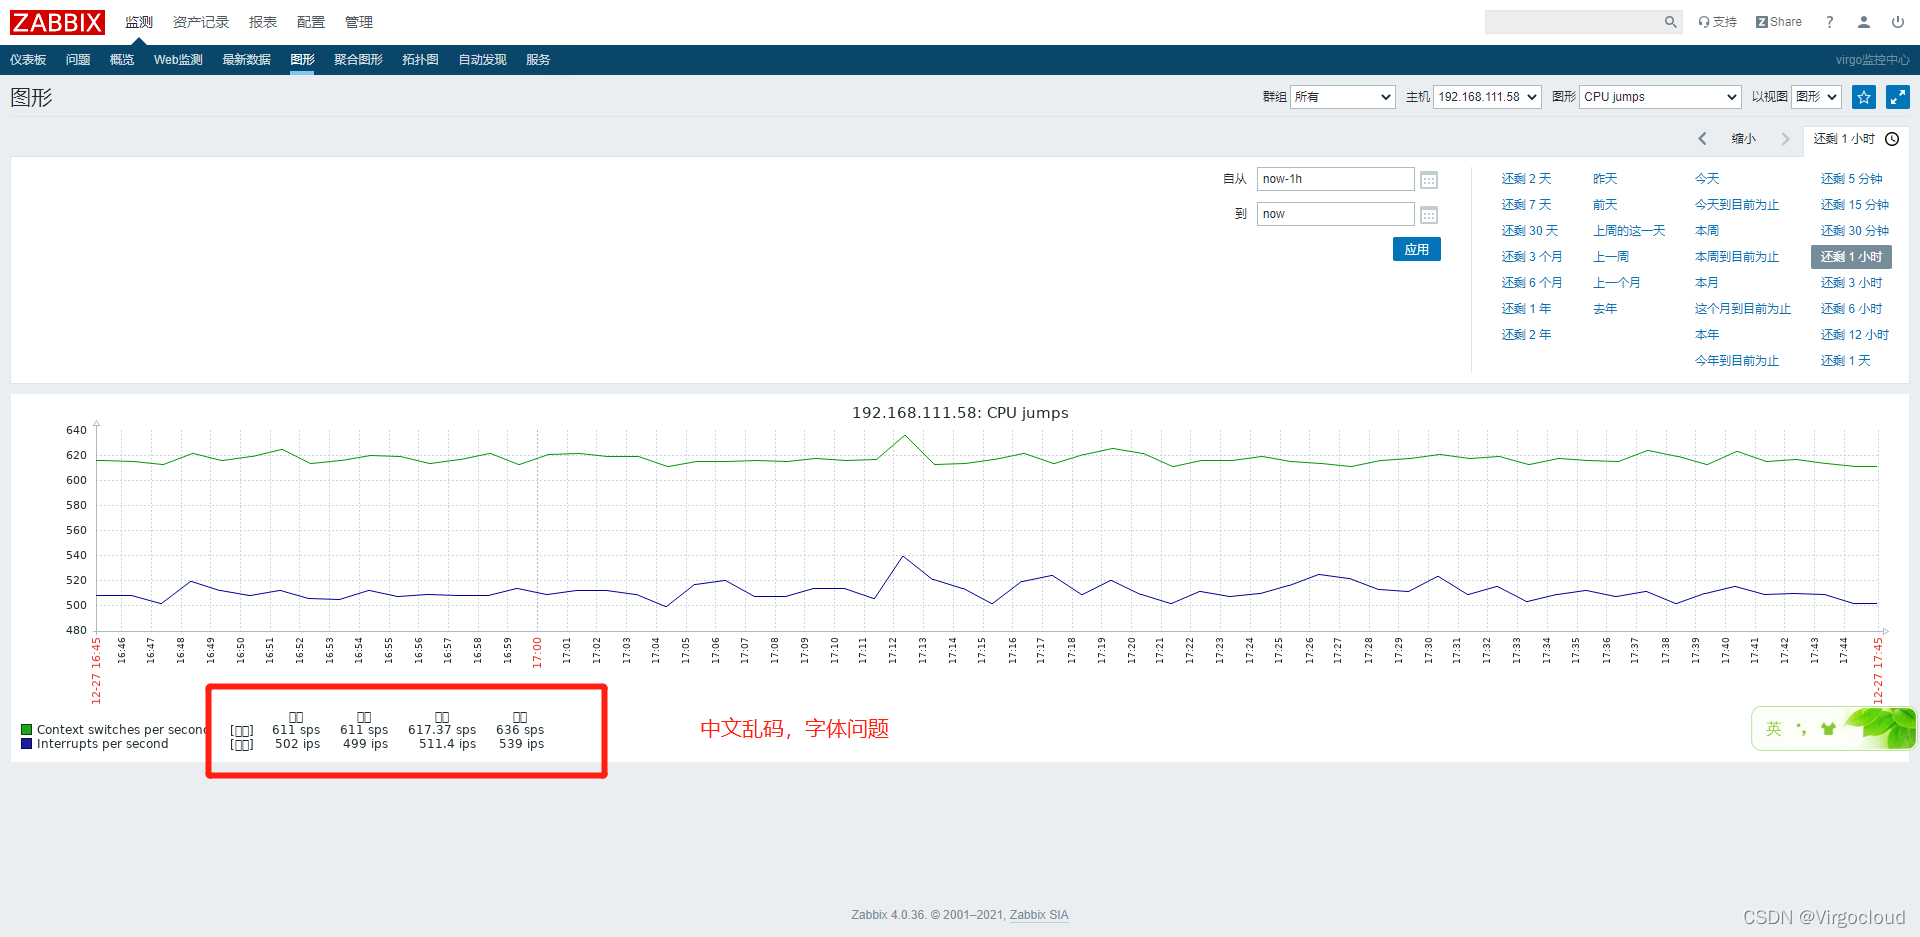
解决方法: 1、到zabbix服务器的/usr/share/zabbix/assets/fonts下
2、在windows系统下找到相应字体C:\Windows\Fonts
3、将字体上传到/usr/share/zabbix/assets/fonts下覆盖原有的字体
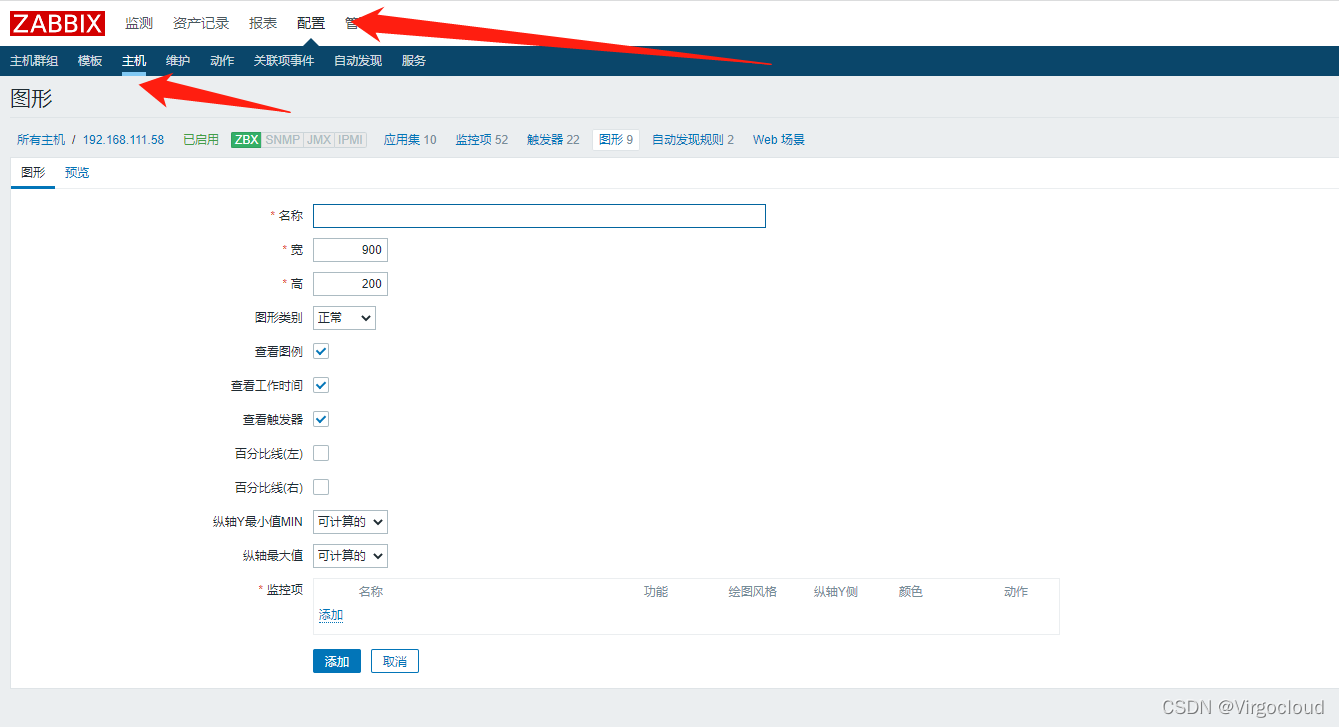
13.2、自定义图形
配置→主机→创建图形
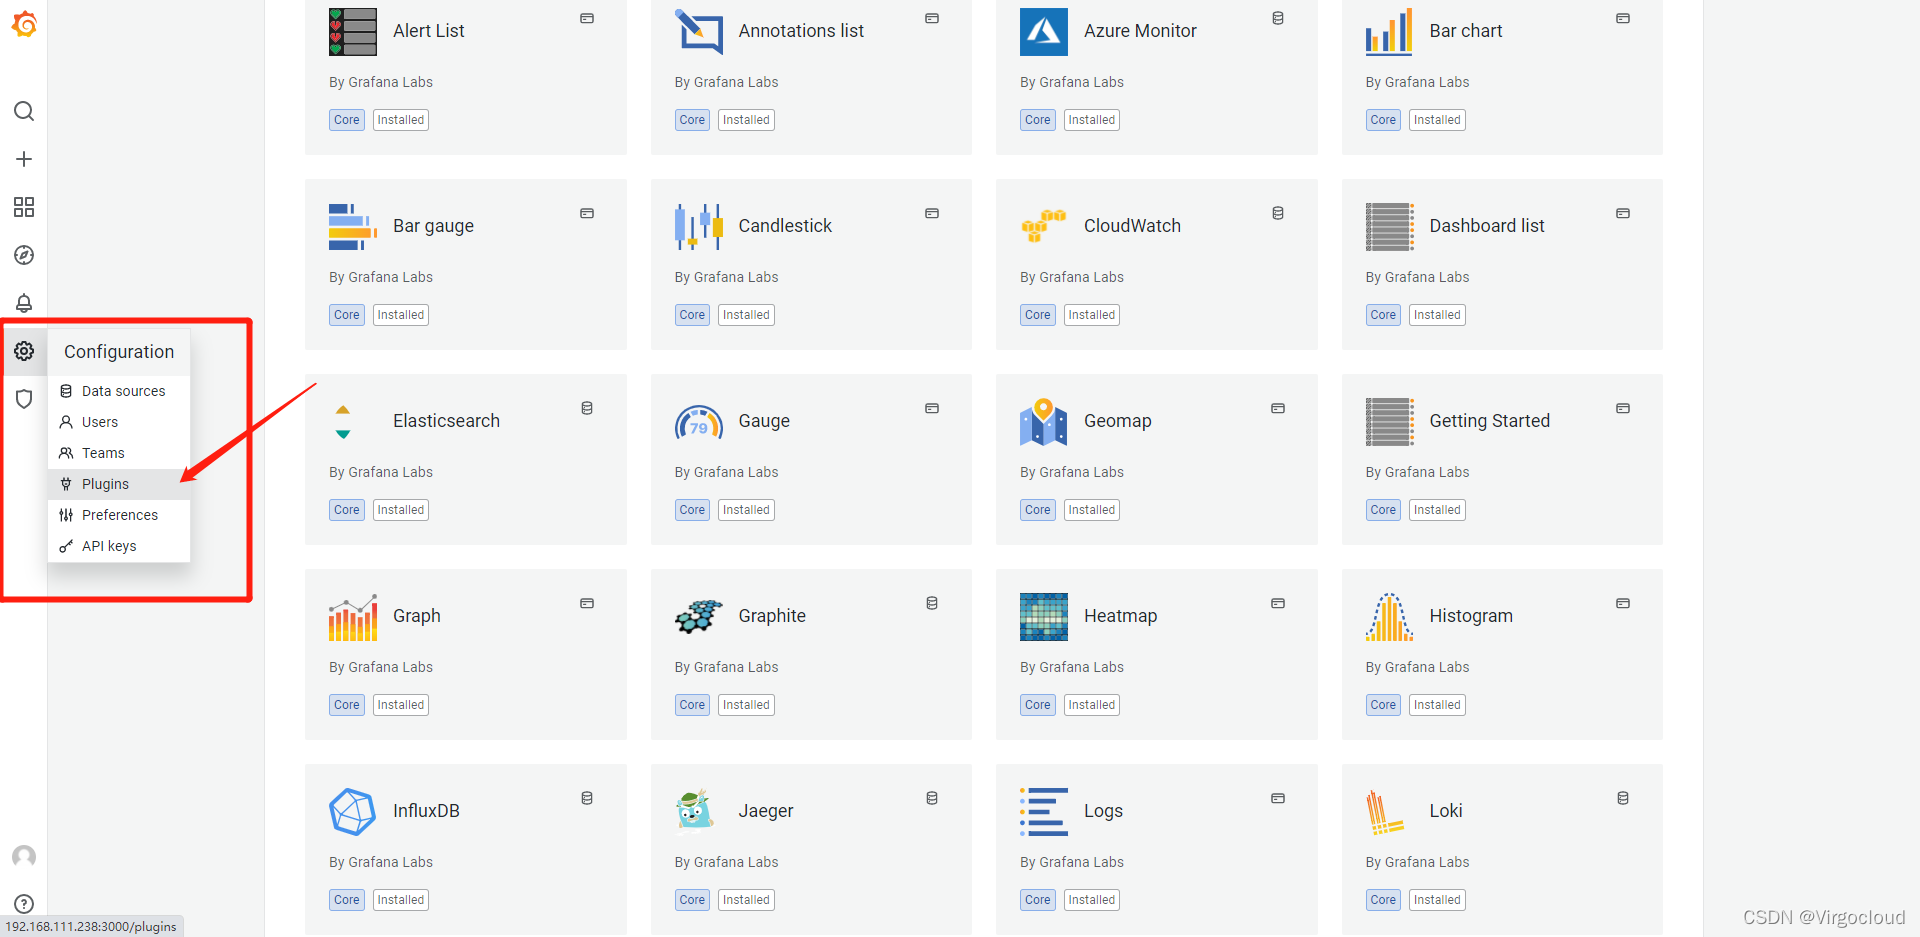
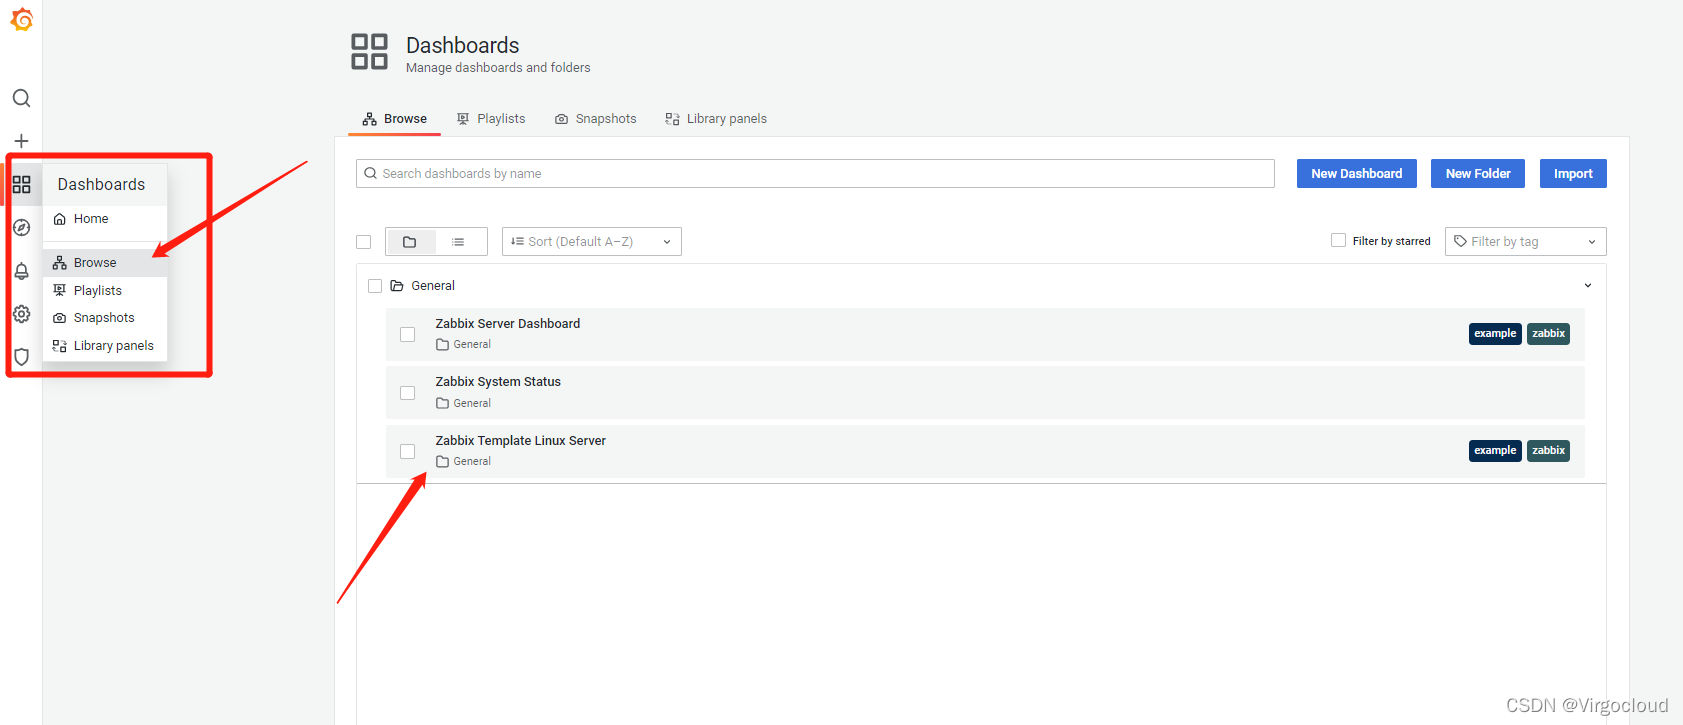
14、使用grafana为zabbix出图
14.1、下载镜像
地址:https://mirror.tuna.tsinghua.edu.cn/grafana/yum/rpm/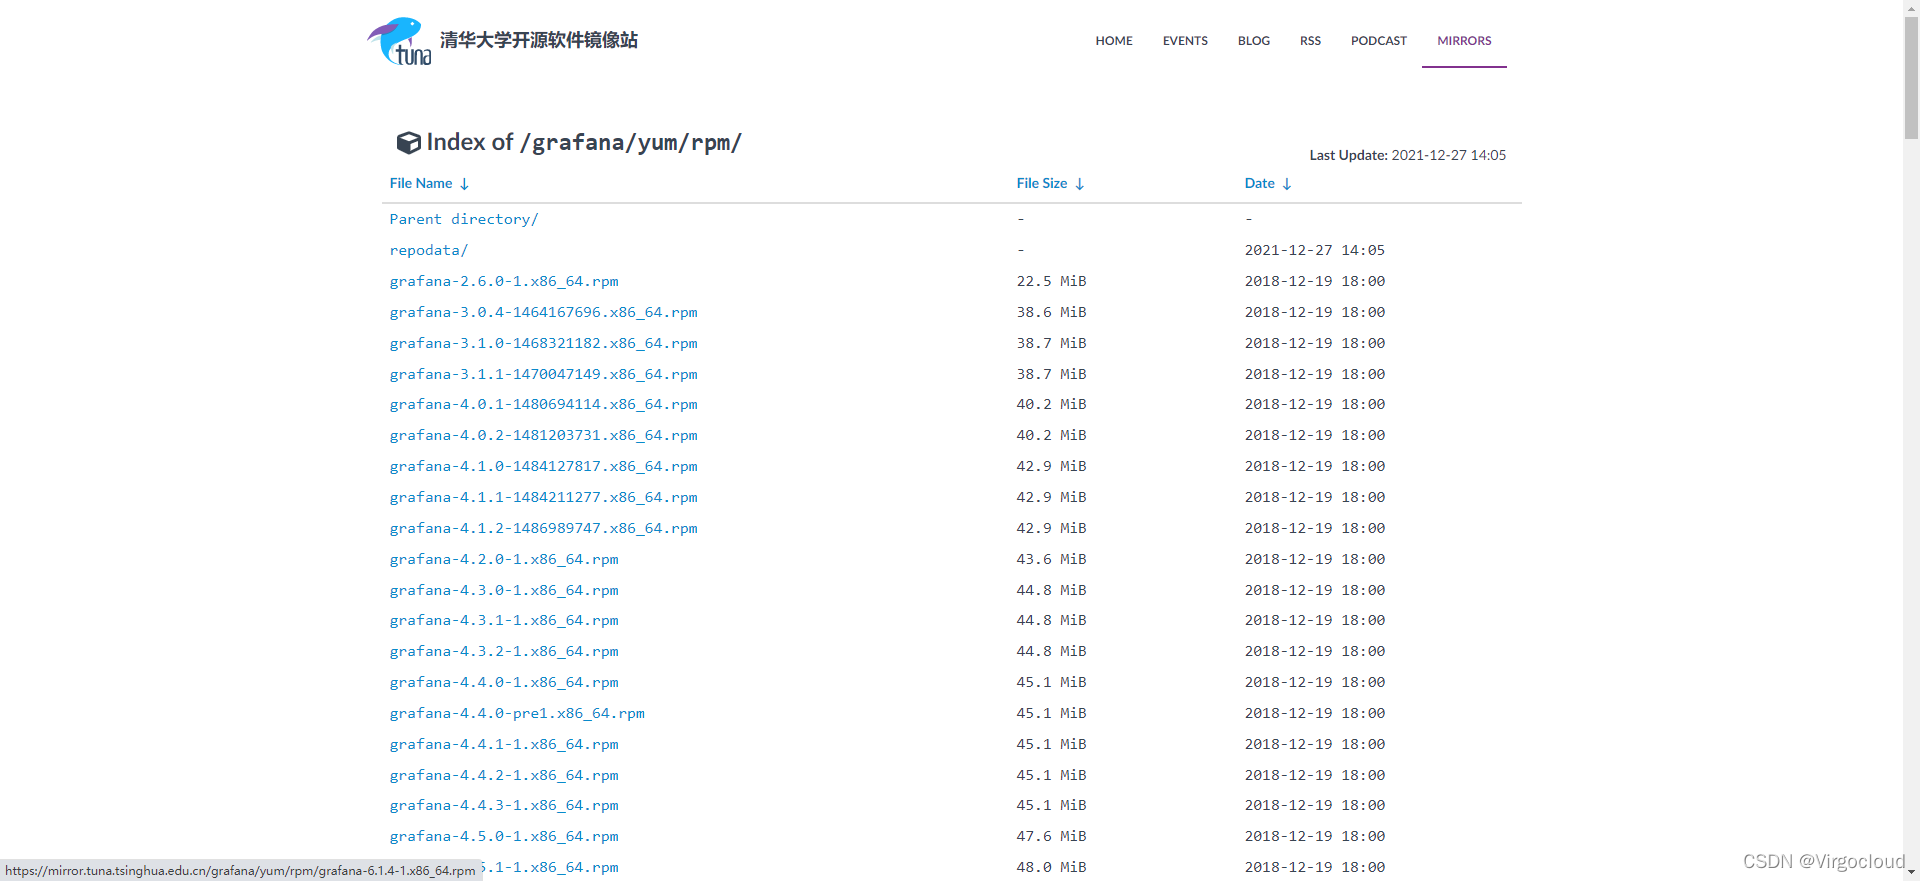
14.2、安装并启动grafana
yum localinstall grafana-8.3.3-1.x86_64.rpm -y

systemctl start grafana-server.service && systemctl enable grafana-server.service

netstat -lntup
14.3、登录测试
登录地址:IP:3000

14.4、安装zabbix插件
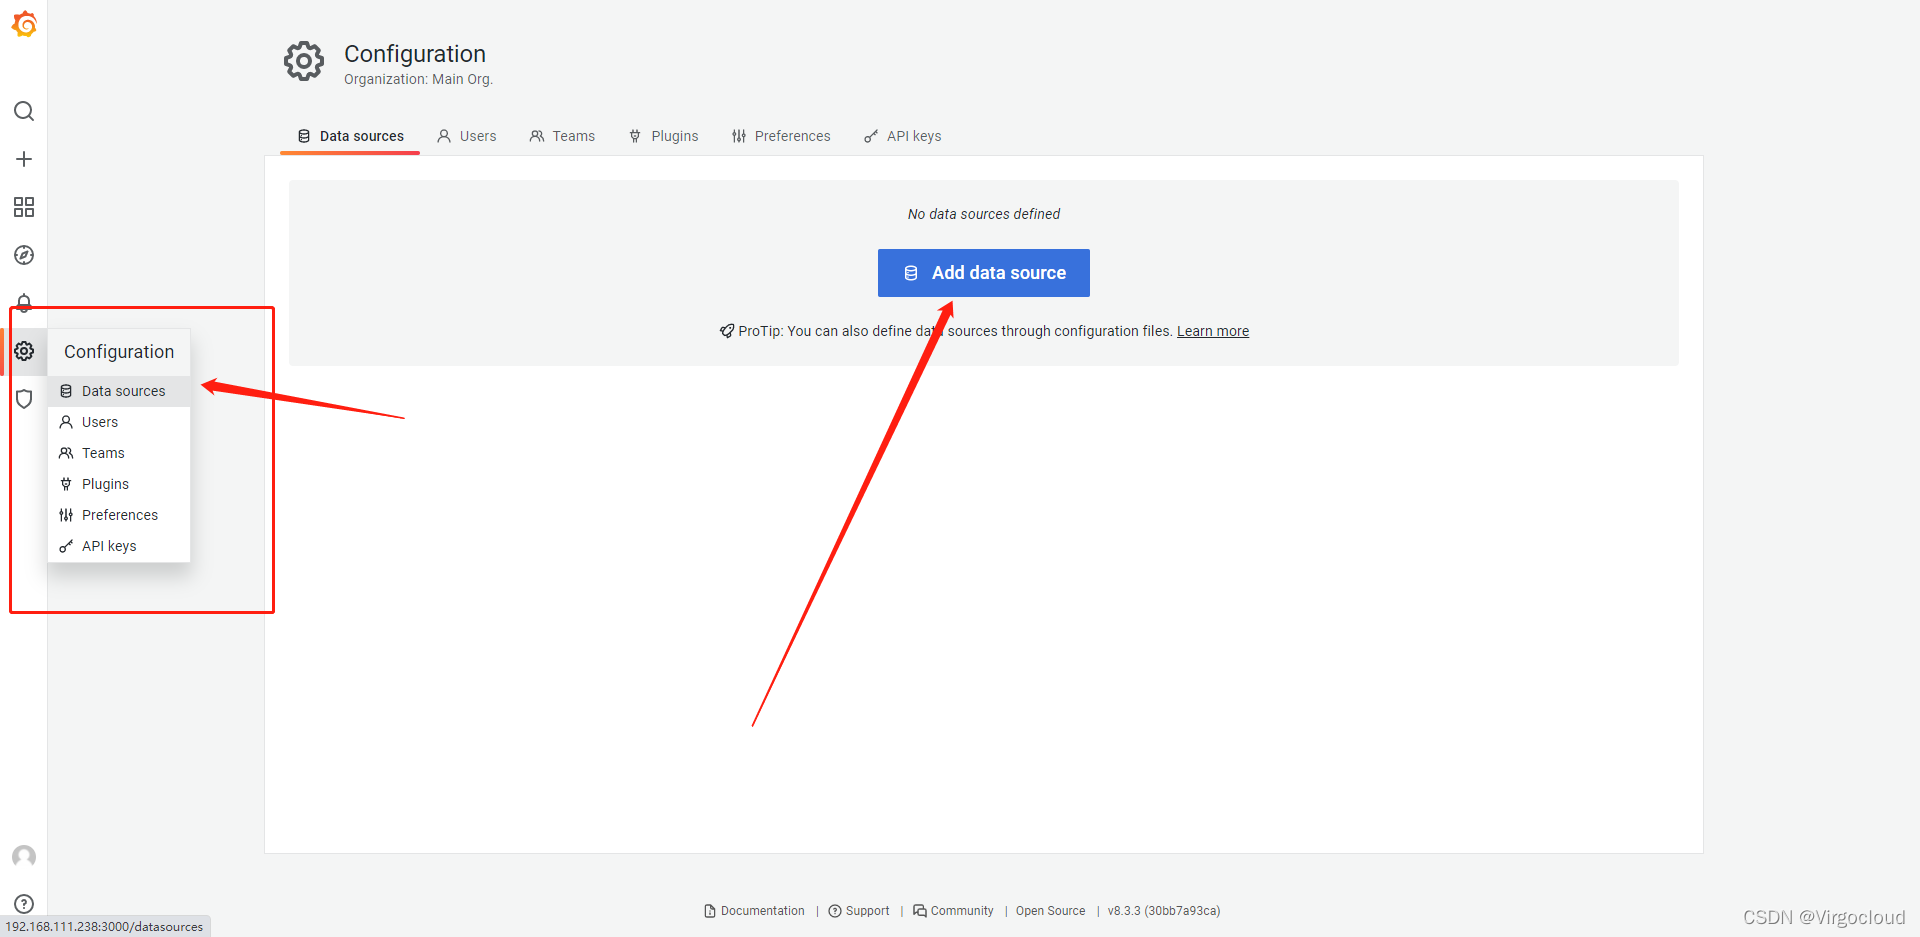
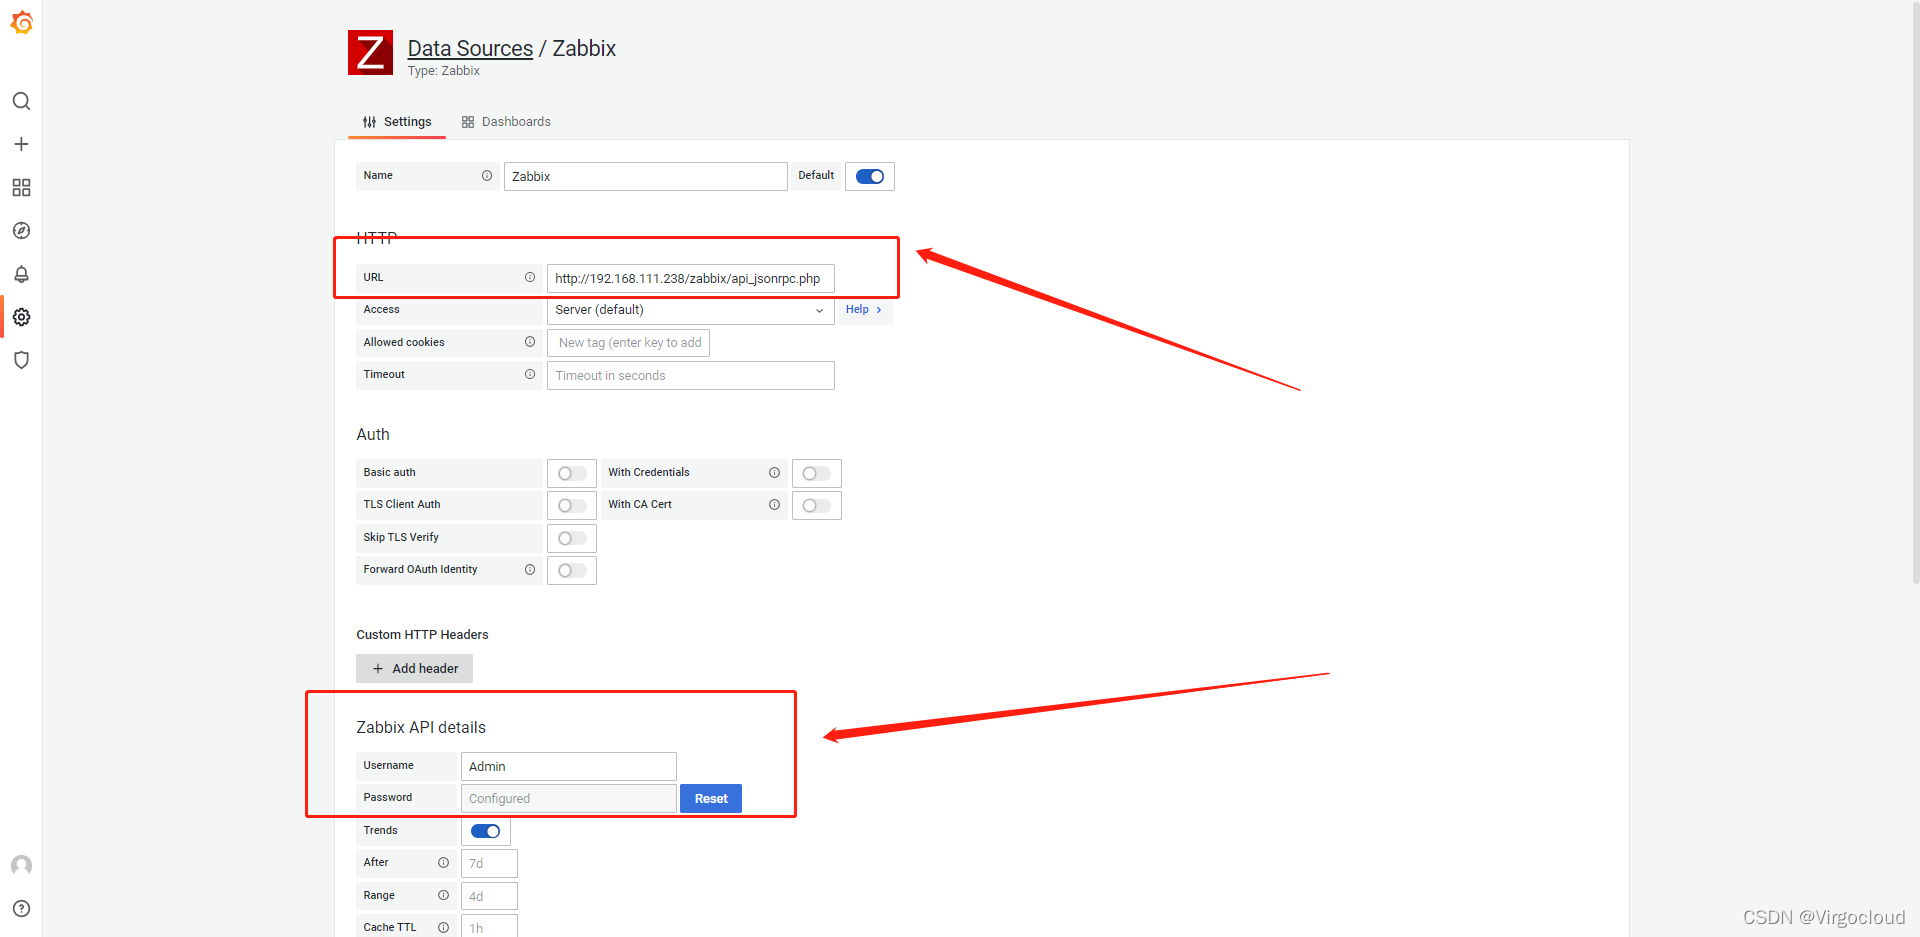
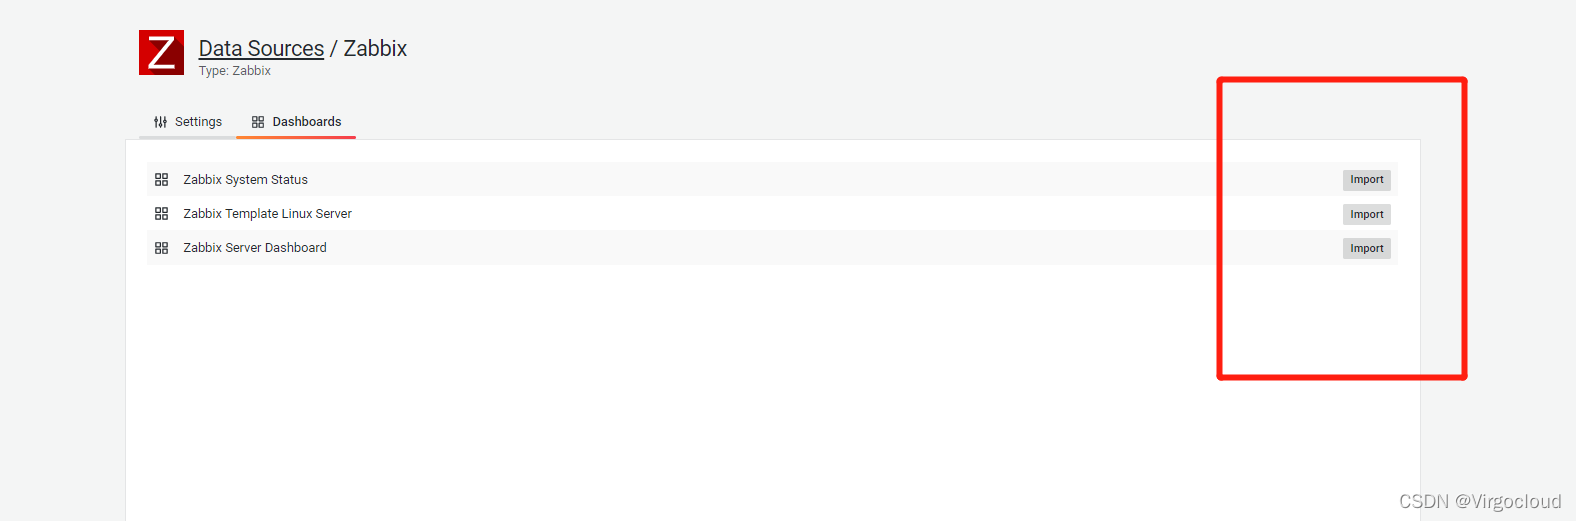
14.5、添加zabbix数据
14.6、自定义监控频率
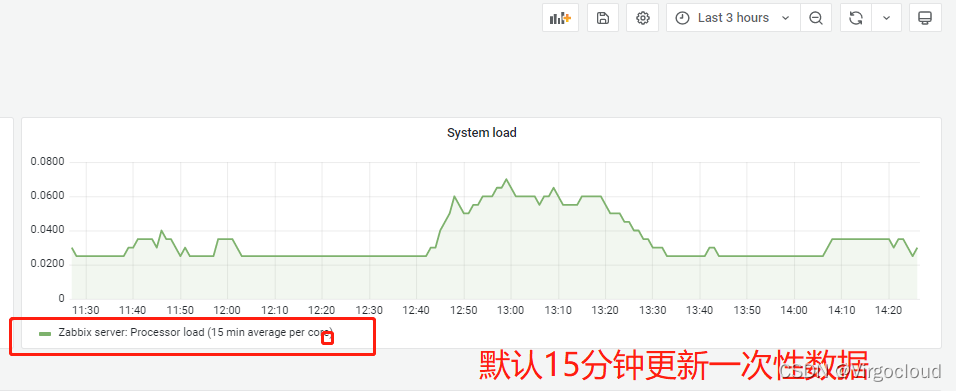
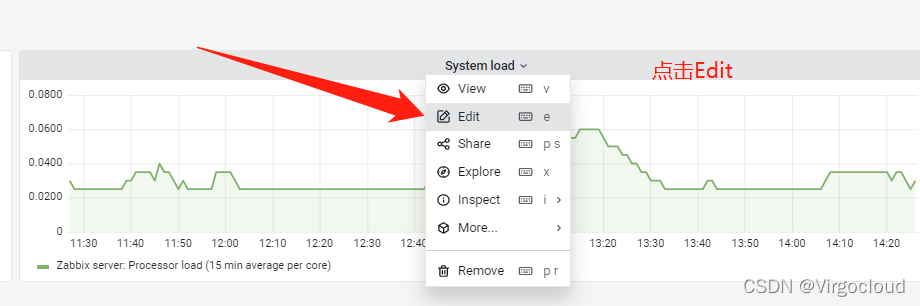
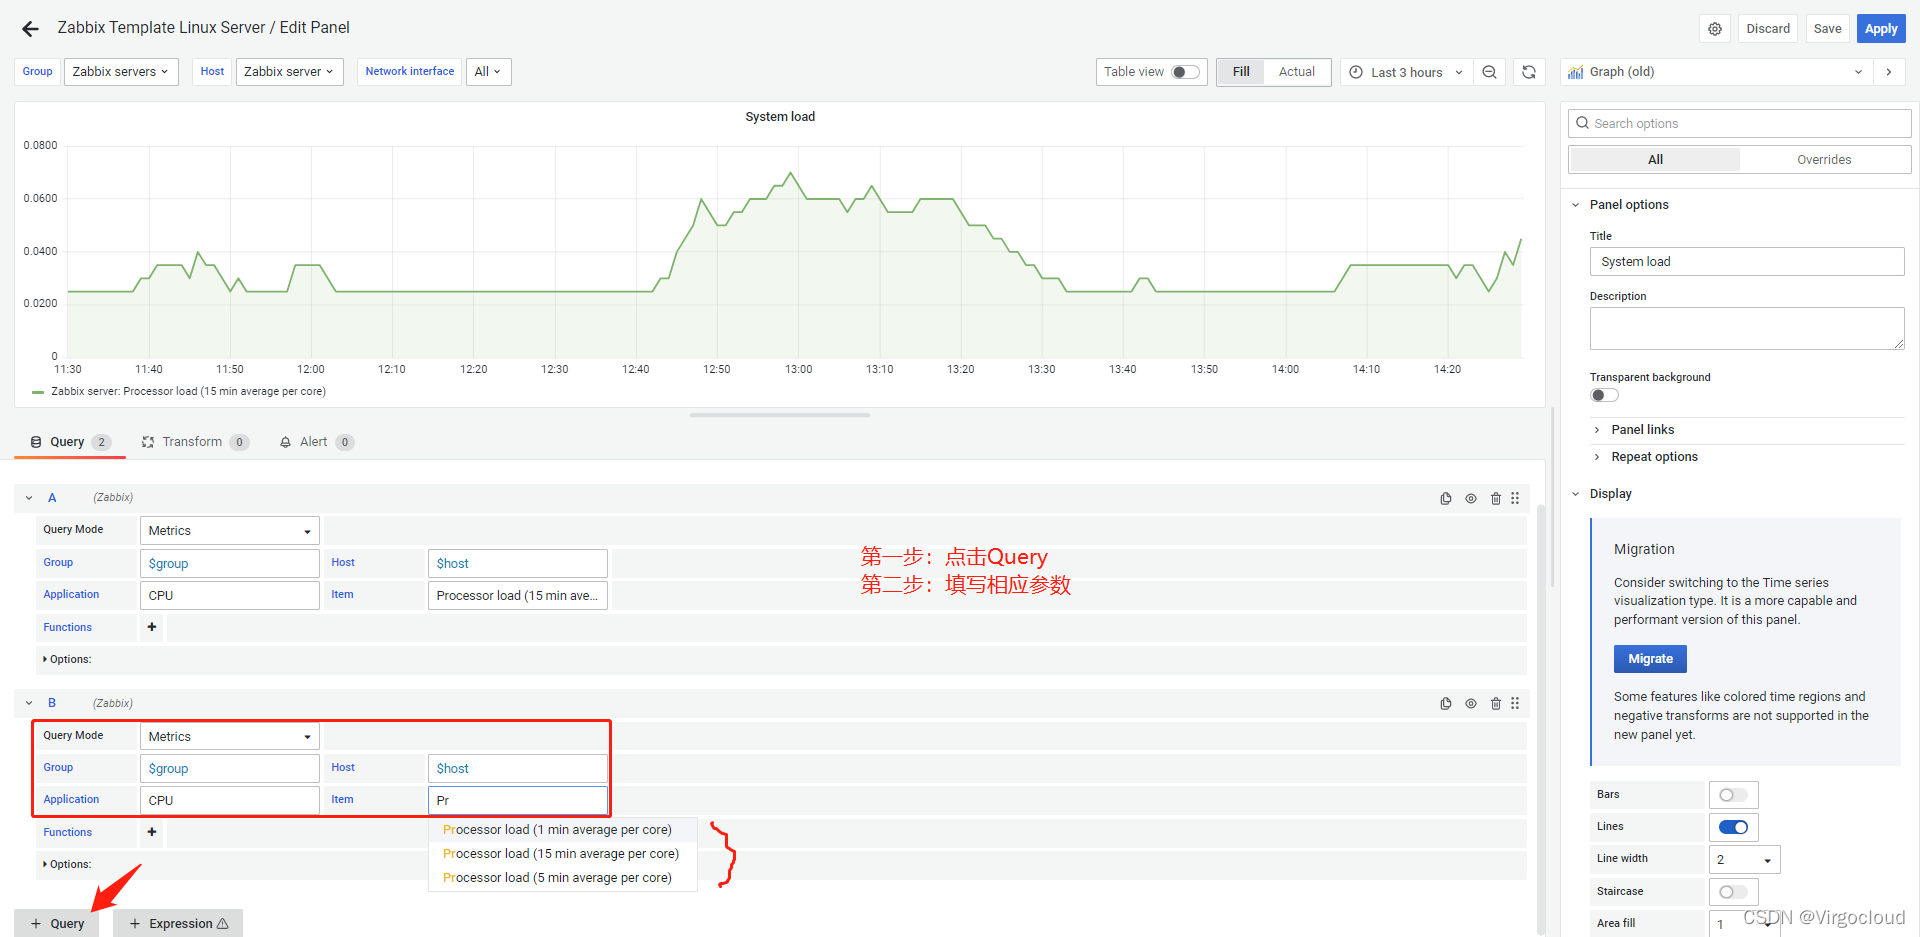
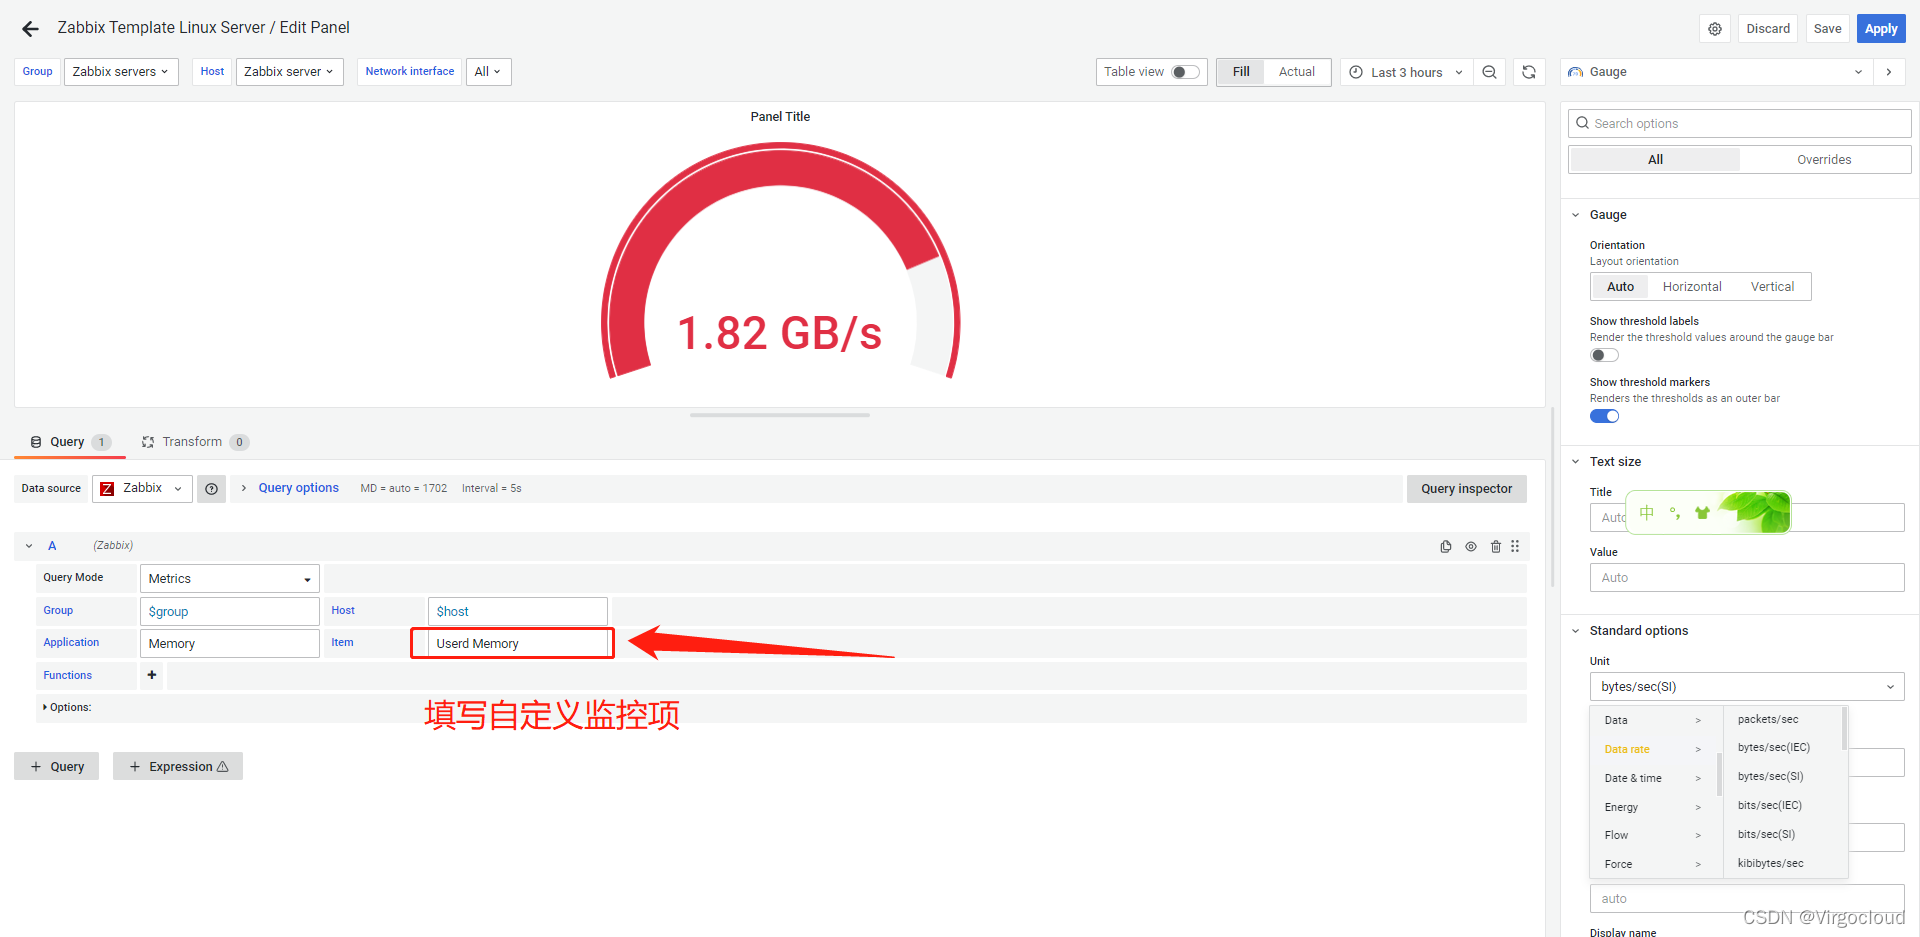
14.7、添加自定义图形
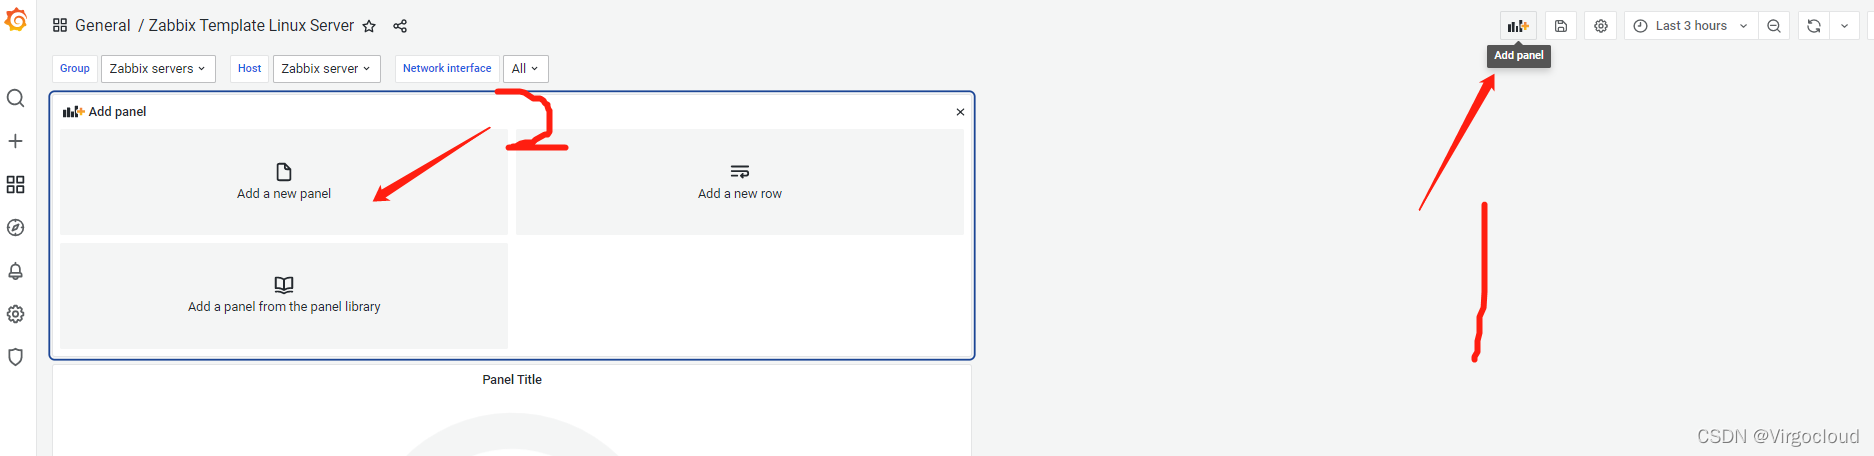

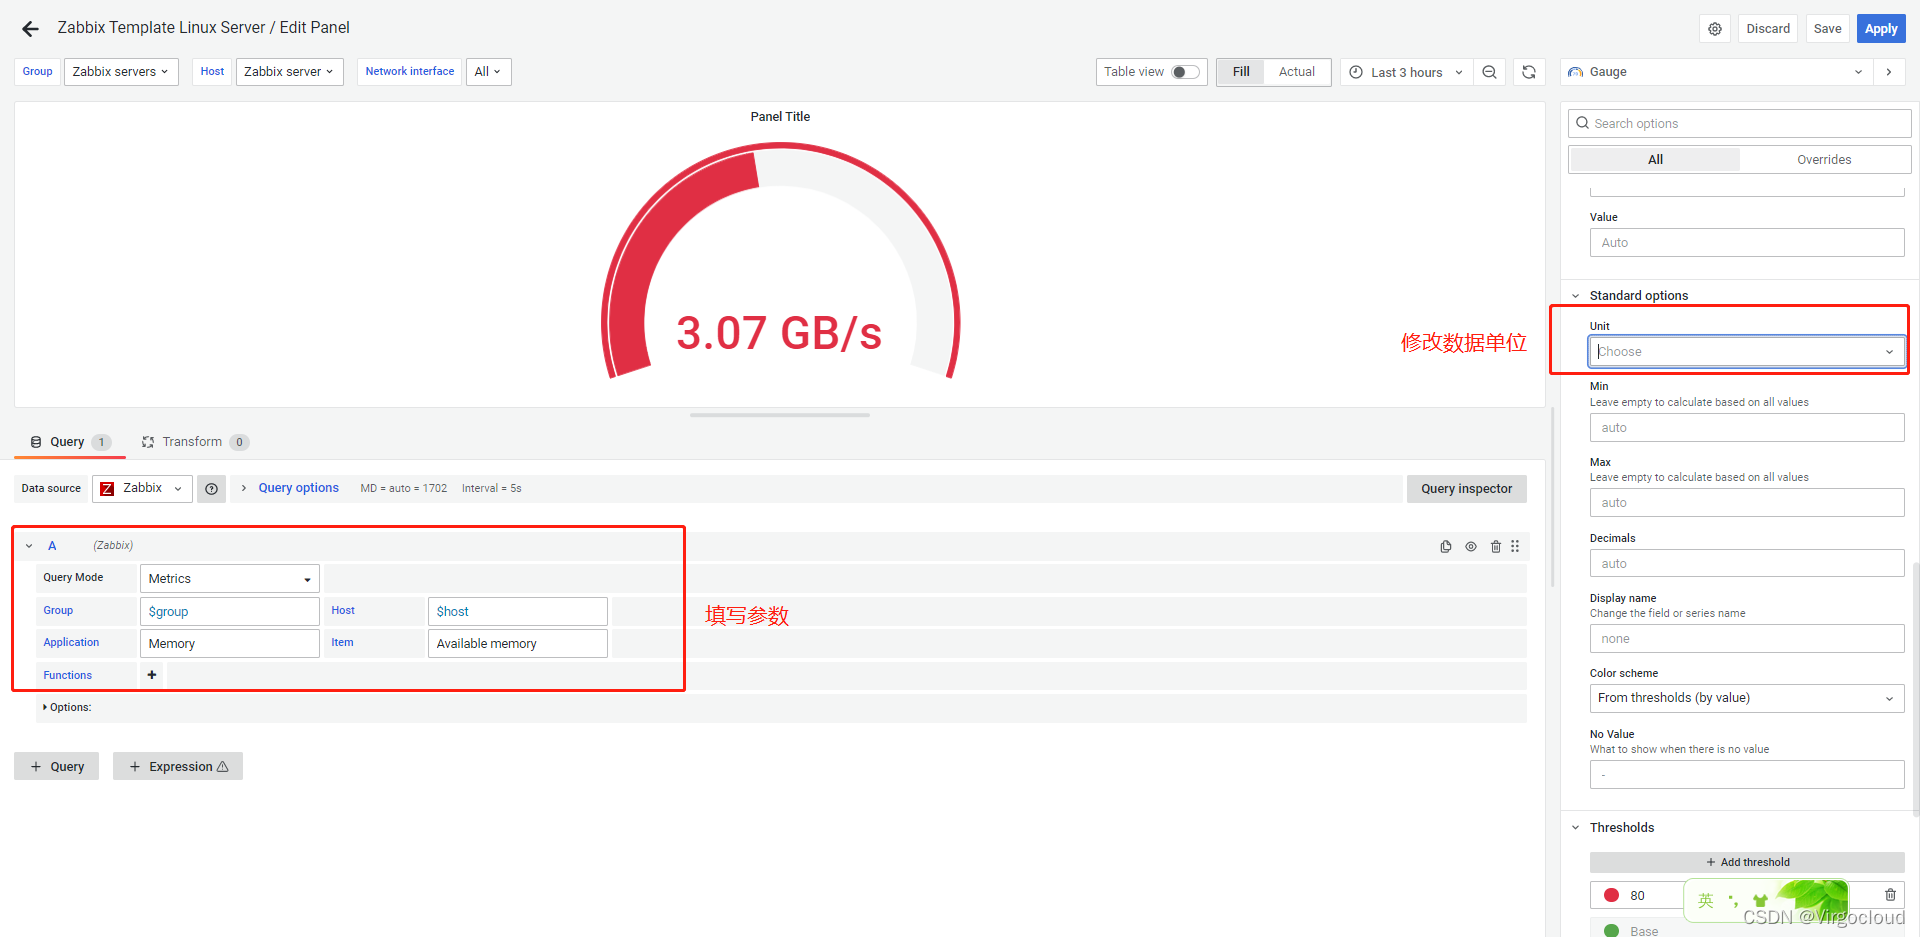
14.8、监控已使用的内存
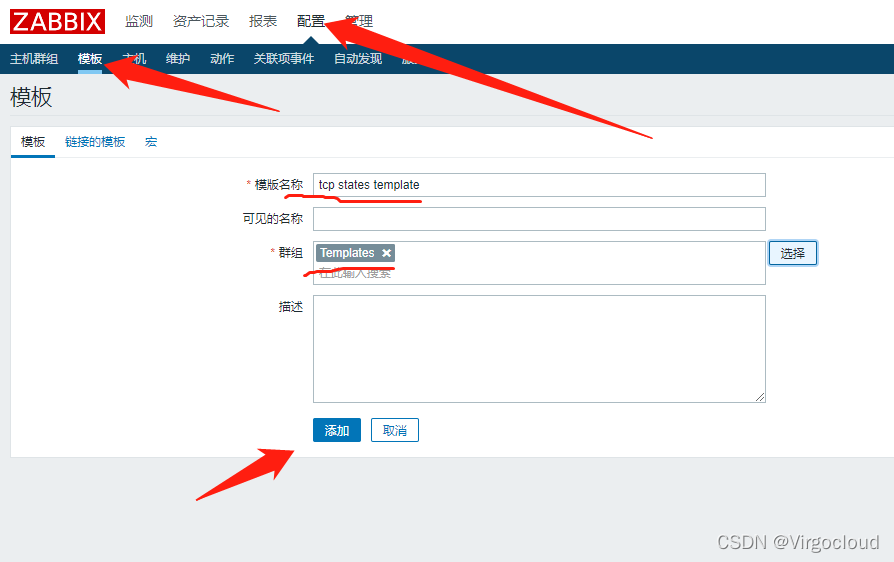
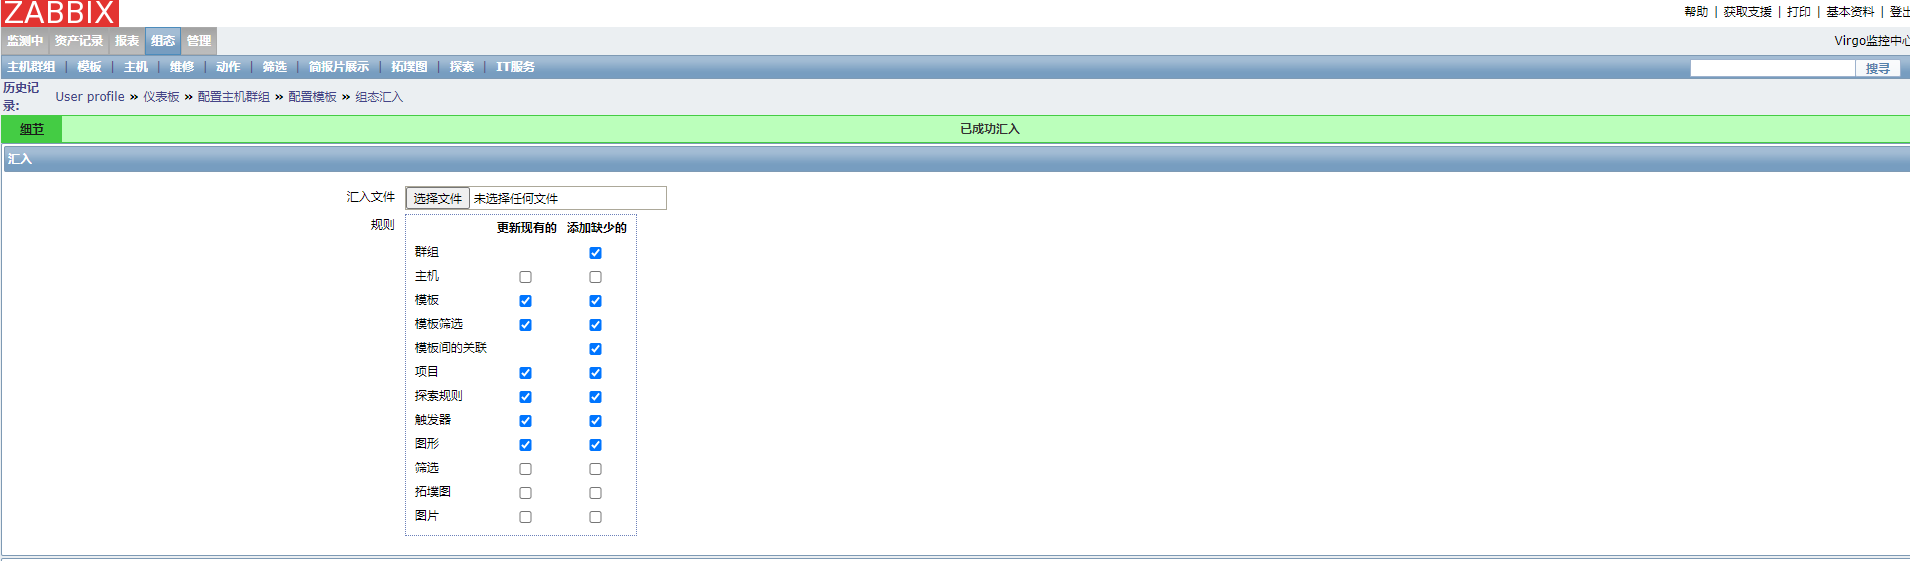
15、自定义监控模板
15.1、创建模板
15.2、将监控项复制到模板里
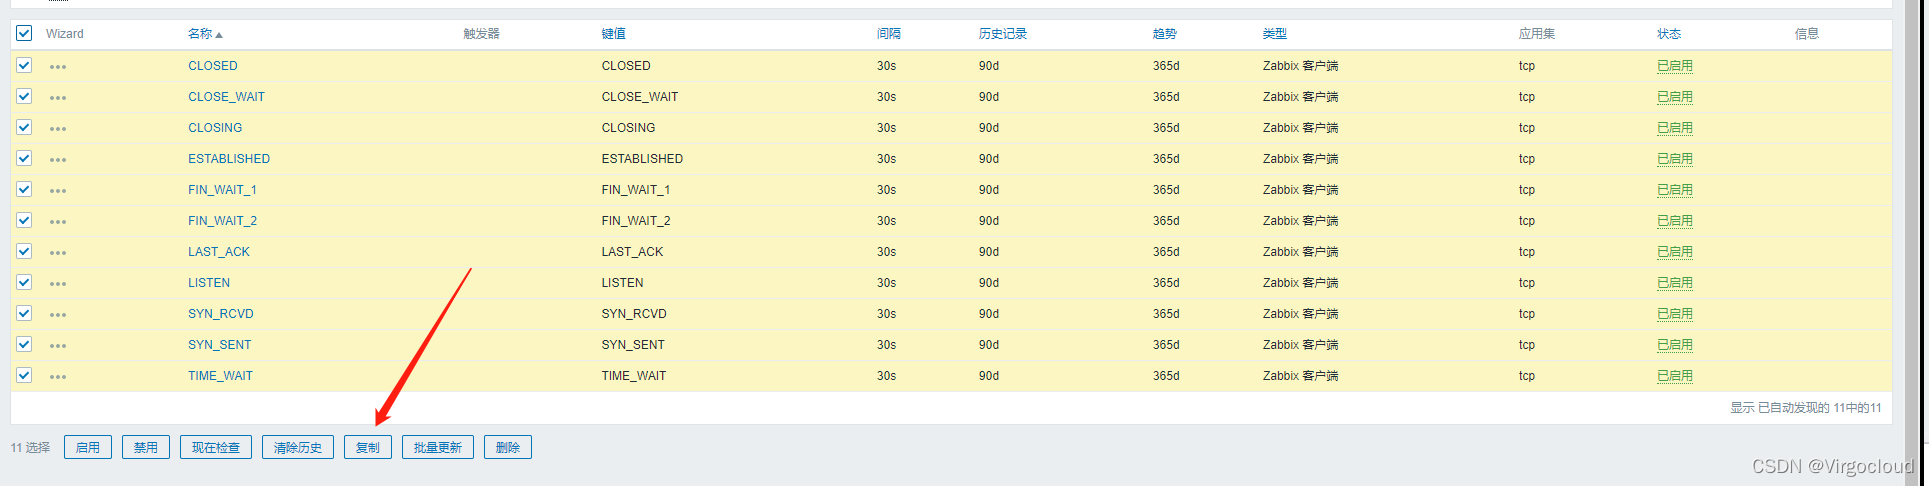

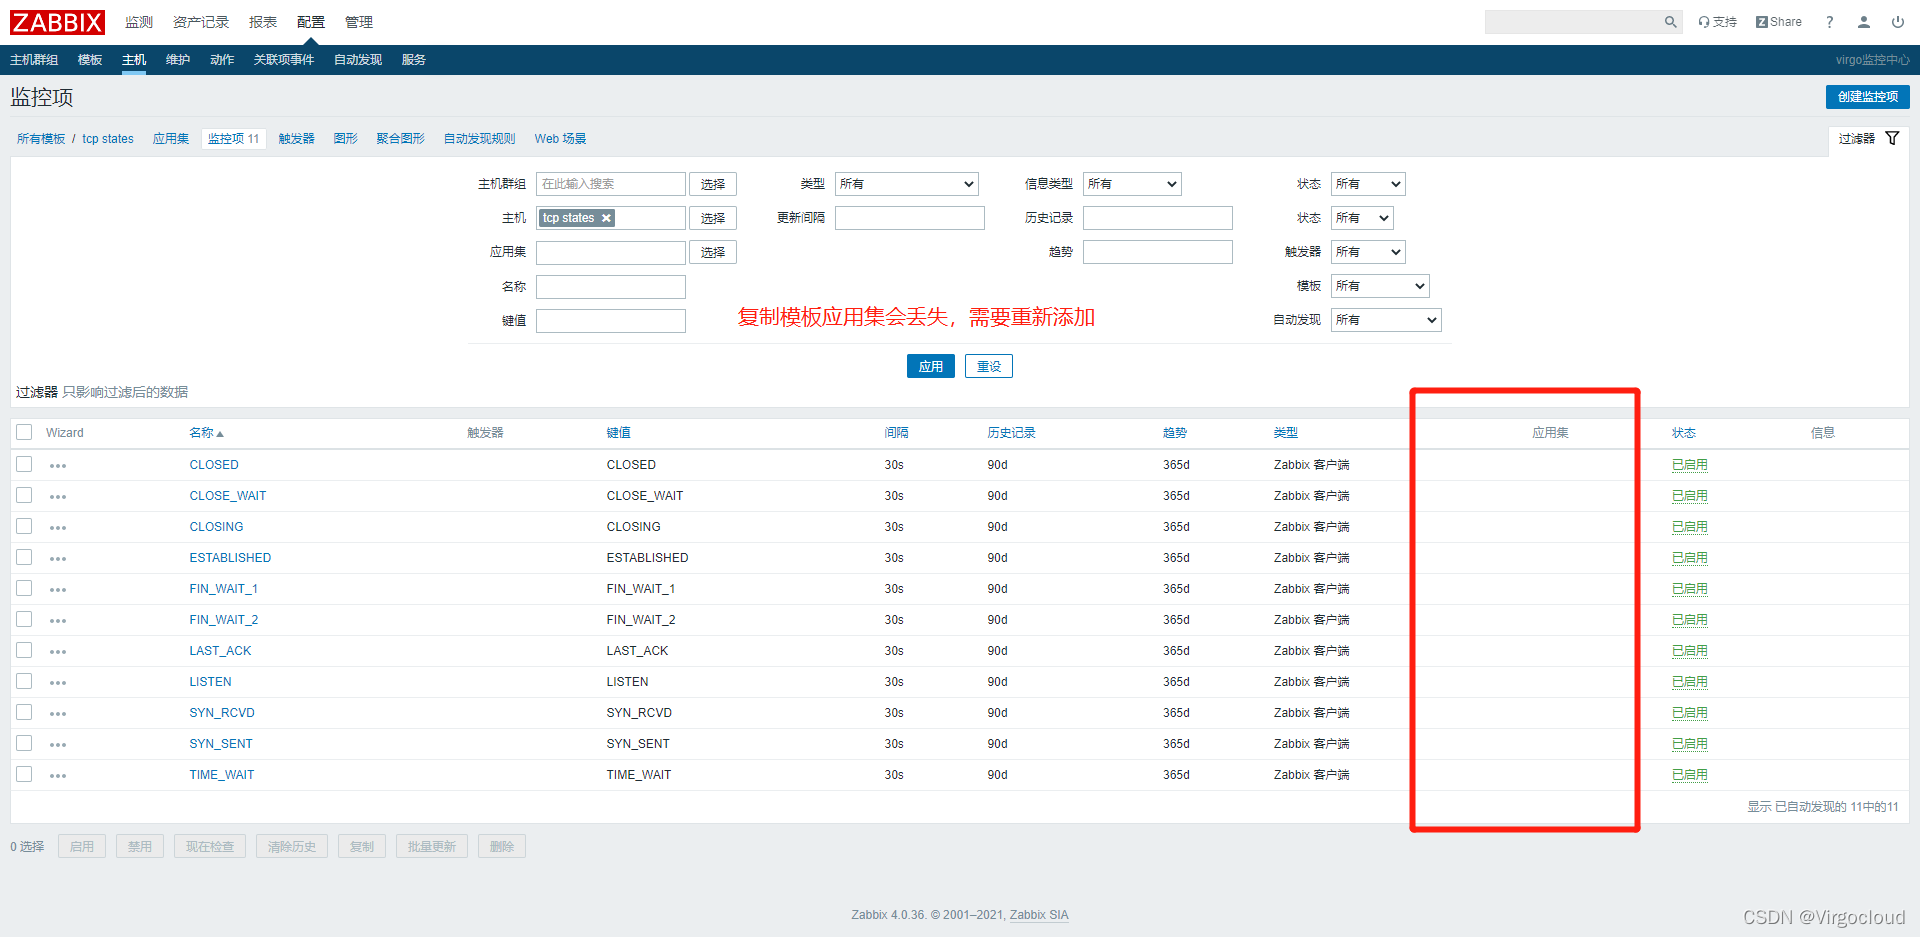
操作方法:全选→批量更新→添加新的或者已经存在的应用→输入应用集名称
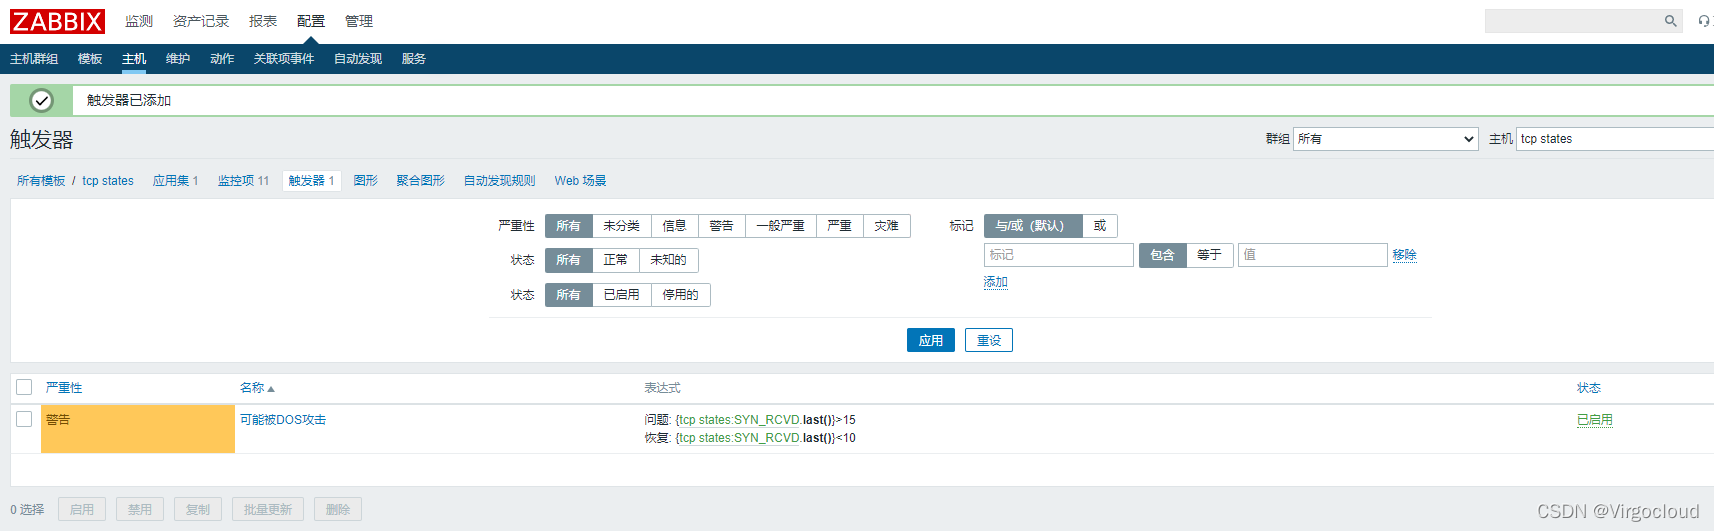
15.3、创建触发器
15.4、创建图形
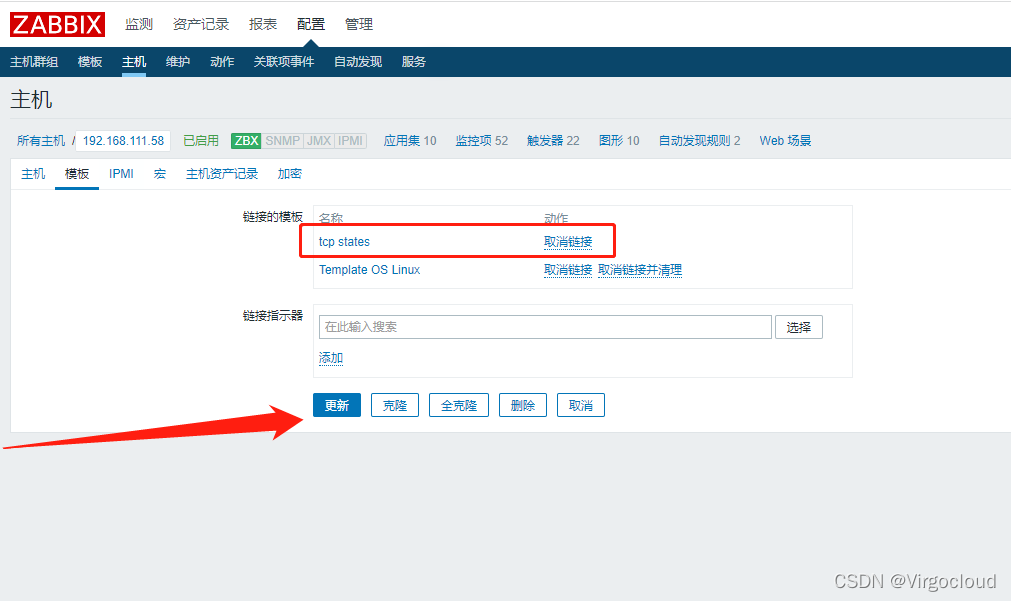
15.5、将模板给其他机器使用
16、添加监控nginx服务
准备环境:
- zabbix服务器
- nginx服务器(需要先安装zabbix-agent服务,具体可查看6.1)
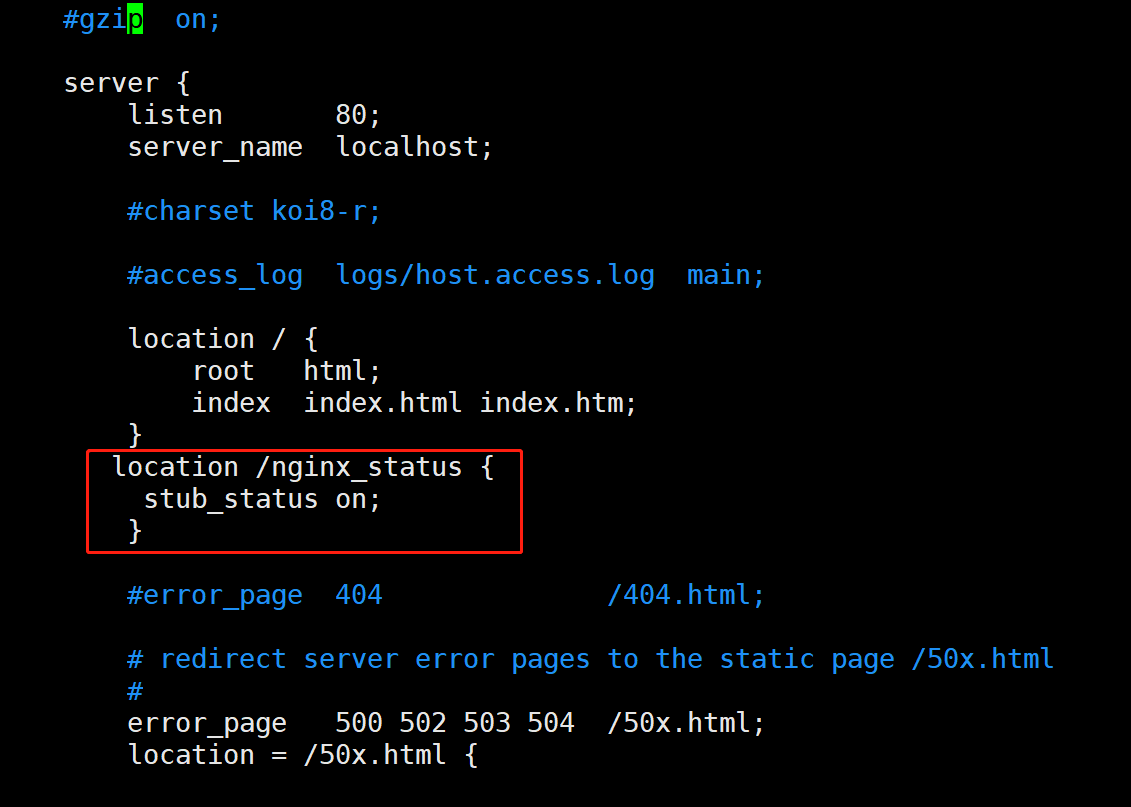
- 开启nginx监控指令
location /nginx_status { stub_status on; }
nginx_status开启方法:https://blog.csdn.net/Virgo626249038/article/details/122338949
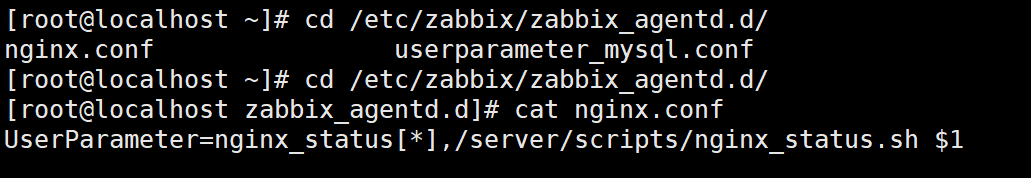
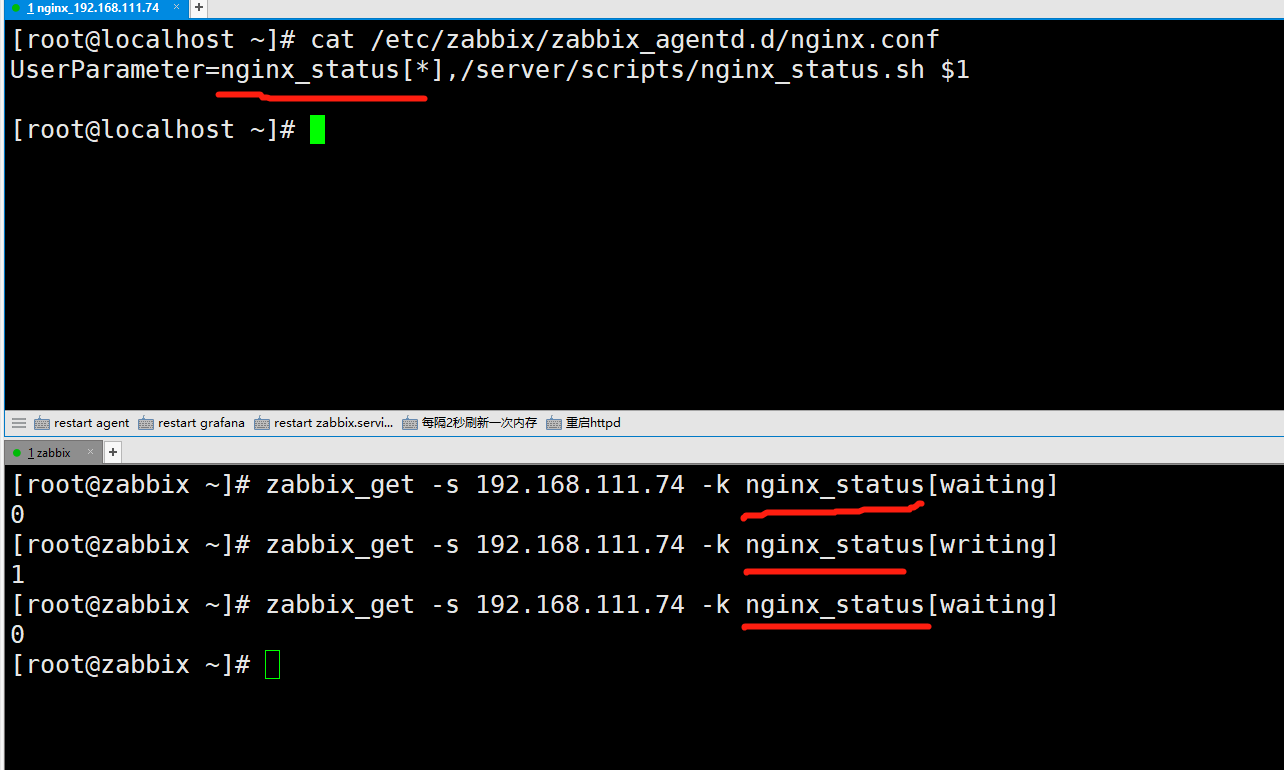
1、在nginx服务器中/etc/zabbix/zabbix_agentd.d/目录下创建nginx.conf文件

UserParameter=nginx_status[*],/bin/bash /server/scripts/nginx_status.sh $1
2、创建/server/scripts/目录,写一个监控脚本放在下面;注/server/scripts/可根据自己需求创建,自定义

#! /bin/bash
# date: 2022-1-6(liangzhongzheng)
# Description:zabbix监控nginx性能以及进程状态
# Note:此脚本需要配置在被监控端,否则ping检测将会得到不符合预期的结果

HOST="192.168.111.74"
PORT="80"

# 检测nginx进程是否存在
function ping {
    /sbin/pidof nginx | wc -l
}
# 检测nginx性能
function active {
    /usr/bin/curl "http://$HOST:$PORT/nginx_status/" 2>/dev/null| grep 'Active' | awk '{print $NF}'
}
function reading {
    /usr/bin/curl "http://$HOST:$PORT/nginx_status/" 2>/dev/null| grep 'Reading' | awk '{print $2}'
}
function writing {
    /usr/bin/curl "http://$HOST:$PORT/nginx_status/" 2>/dev/null| grep 'Writing' | awk '{print $4}'
}
function waiting {
    /usr/bin/curl "http://$HOST:$PORT/nginx_status/" 2>/dev/null| grep 'Waiting' | awk '{print $6}'
}
function accepts {
    /usr/bin/curl "http://$HOST:$PORT/nginx_status/" 2>/dev/null| awk NR==3 | awk '{print $1}'
}
function handled {
    /usr/bin/curl "http://$HOST:$PORT/nginx_status/" 2>/dev/null| awk NR==3 | awk '{print $2}'
}
function requests {
    /usr/bin/curl "http://$HOST:$PORT/nginx_status/" 2>/dev/null| awk NR==3 | awk '{print $3}'
}
# 执行function
$1
4、在nginx服务器上验证shell脚本是否能正常获取到数据
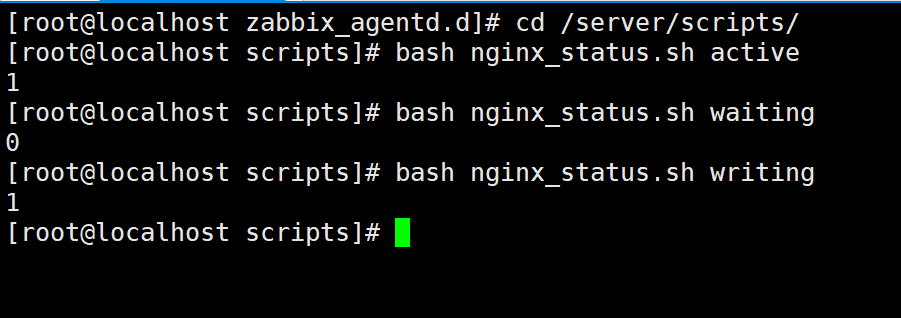
5、重启zabbix-agent(两个机器都重启)
service zabbix-agent restart
6、 zabbix服务端使用zabbix_get 测试获取数据
zabbix_get -s (nginx服务器IP) -k nginx_status[active]
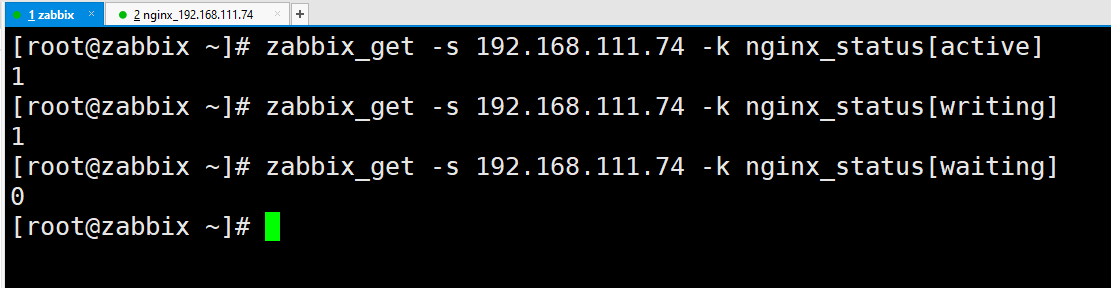
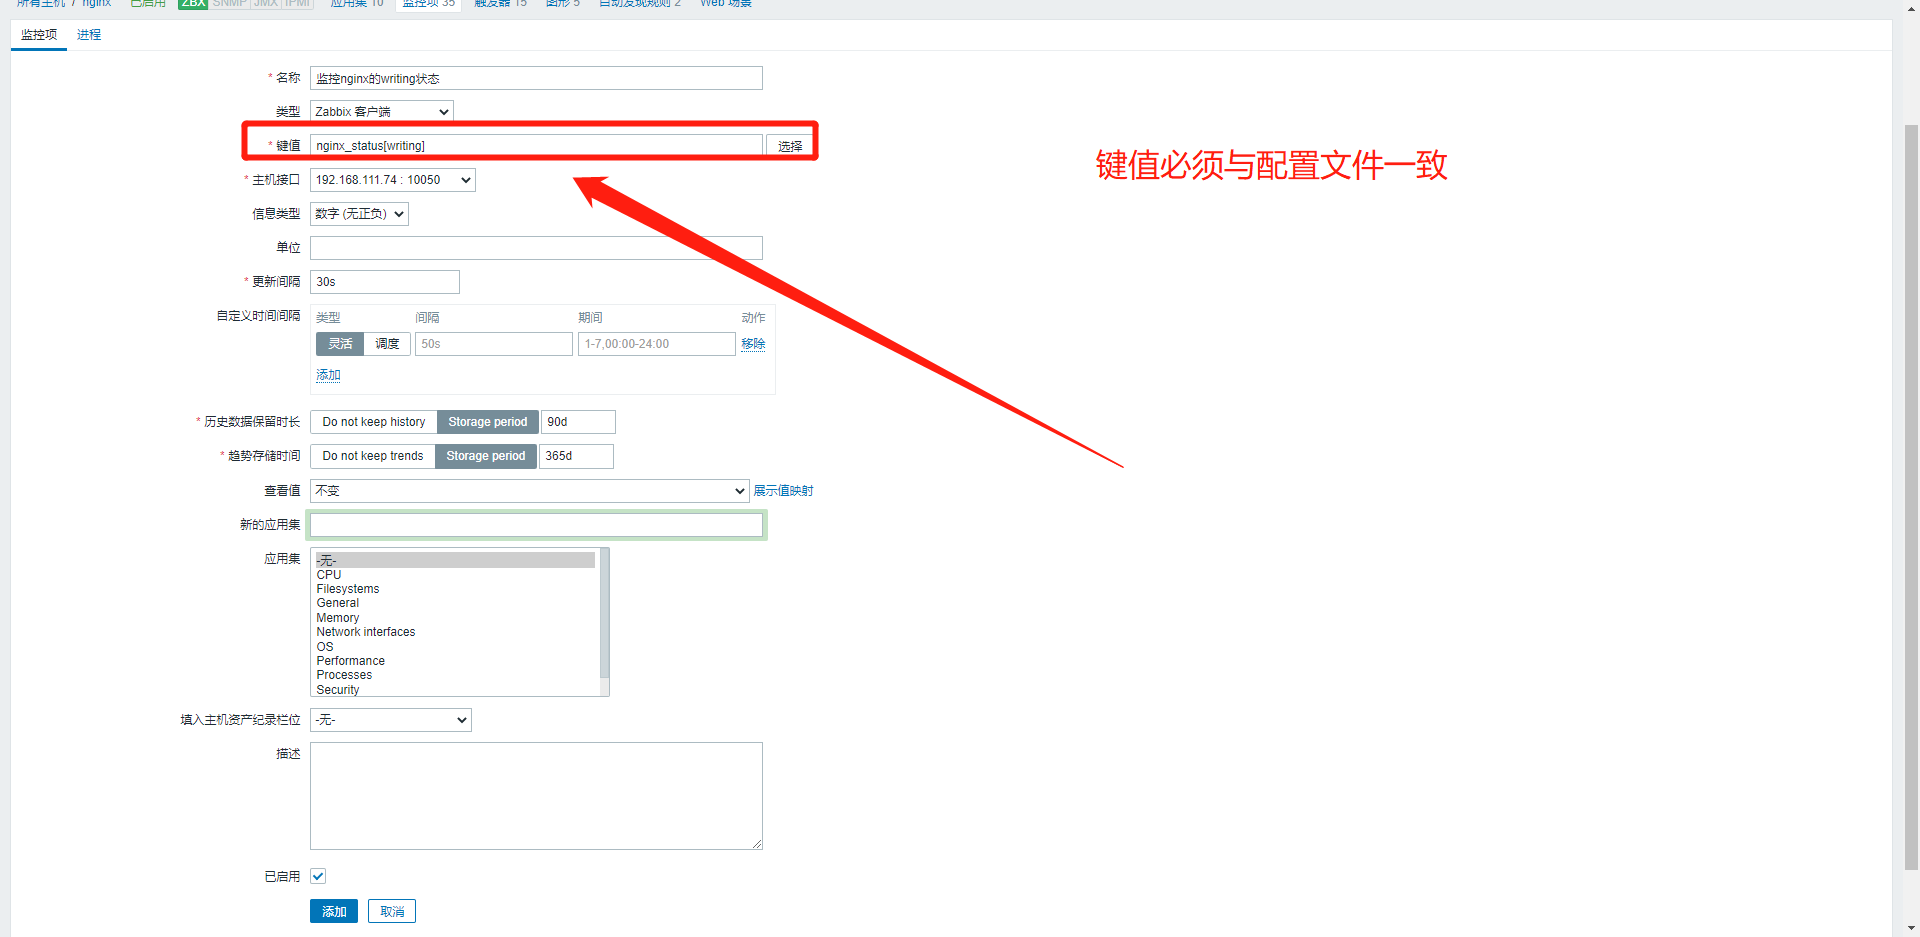
注意点:nginx_status为键值,需要与.conf文件保持一致
容易忽略的故障:
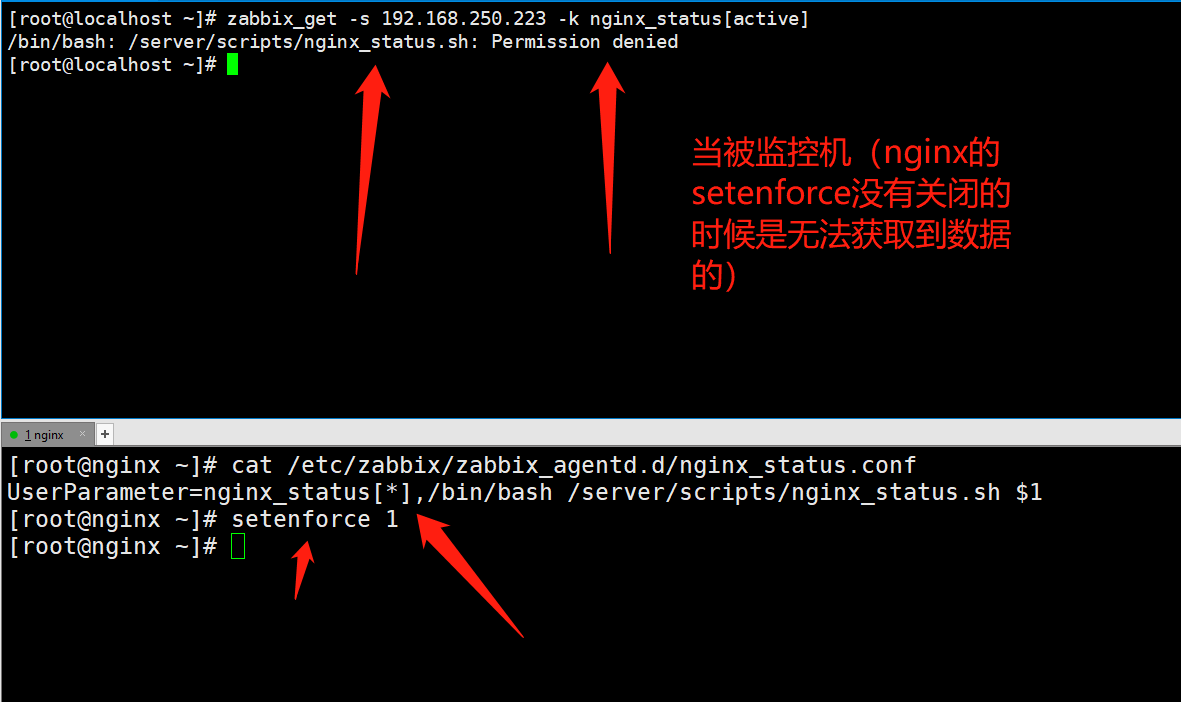
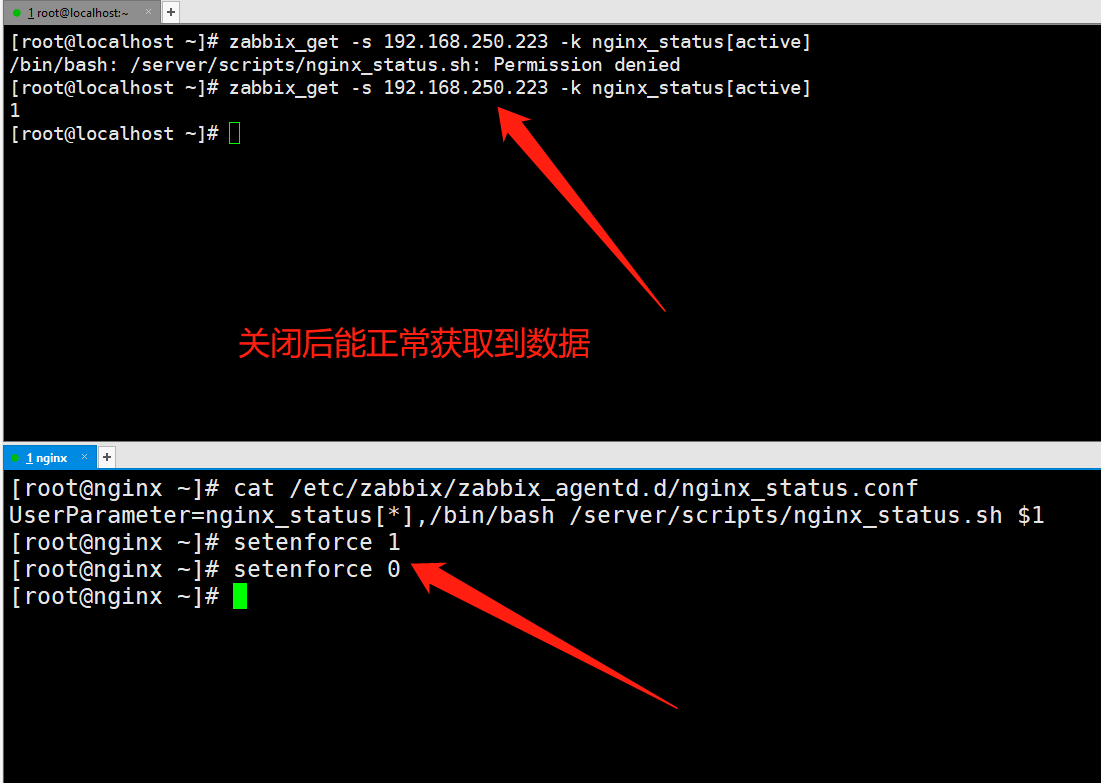
永久关闭
vim /etc/sysconfig/selinux
vim /etc/selinux/config
把SELINUX=enforcing 改为 SELINUX=disabled
临时关闭SELinux
setenforce 0
参考链接:https://www.cnblogs.com/awakenedy/articles/9134242.html
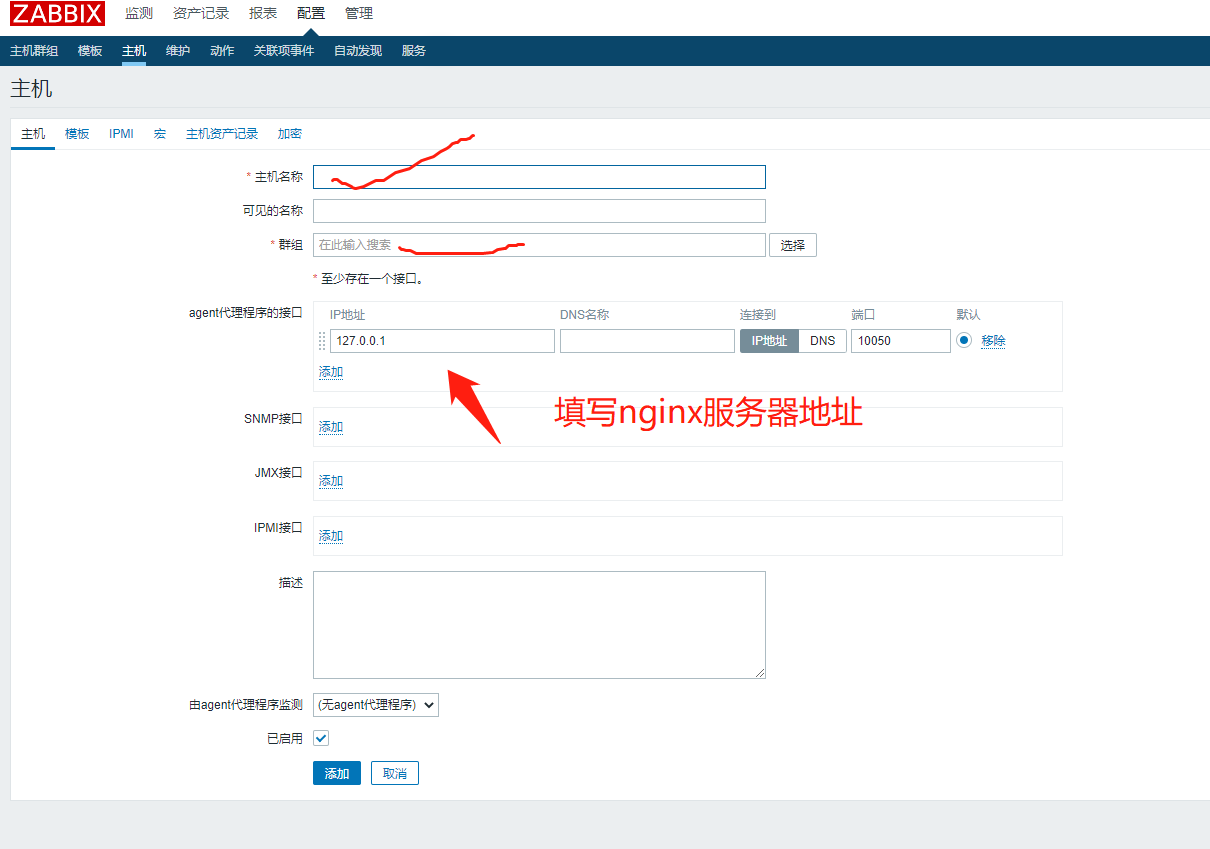
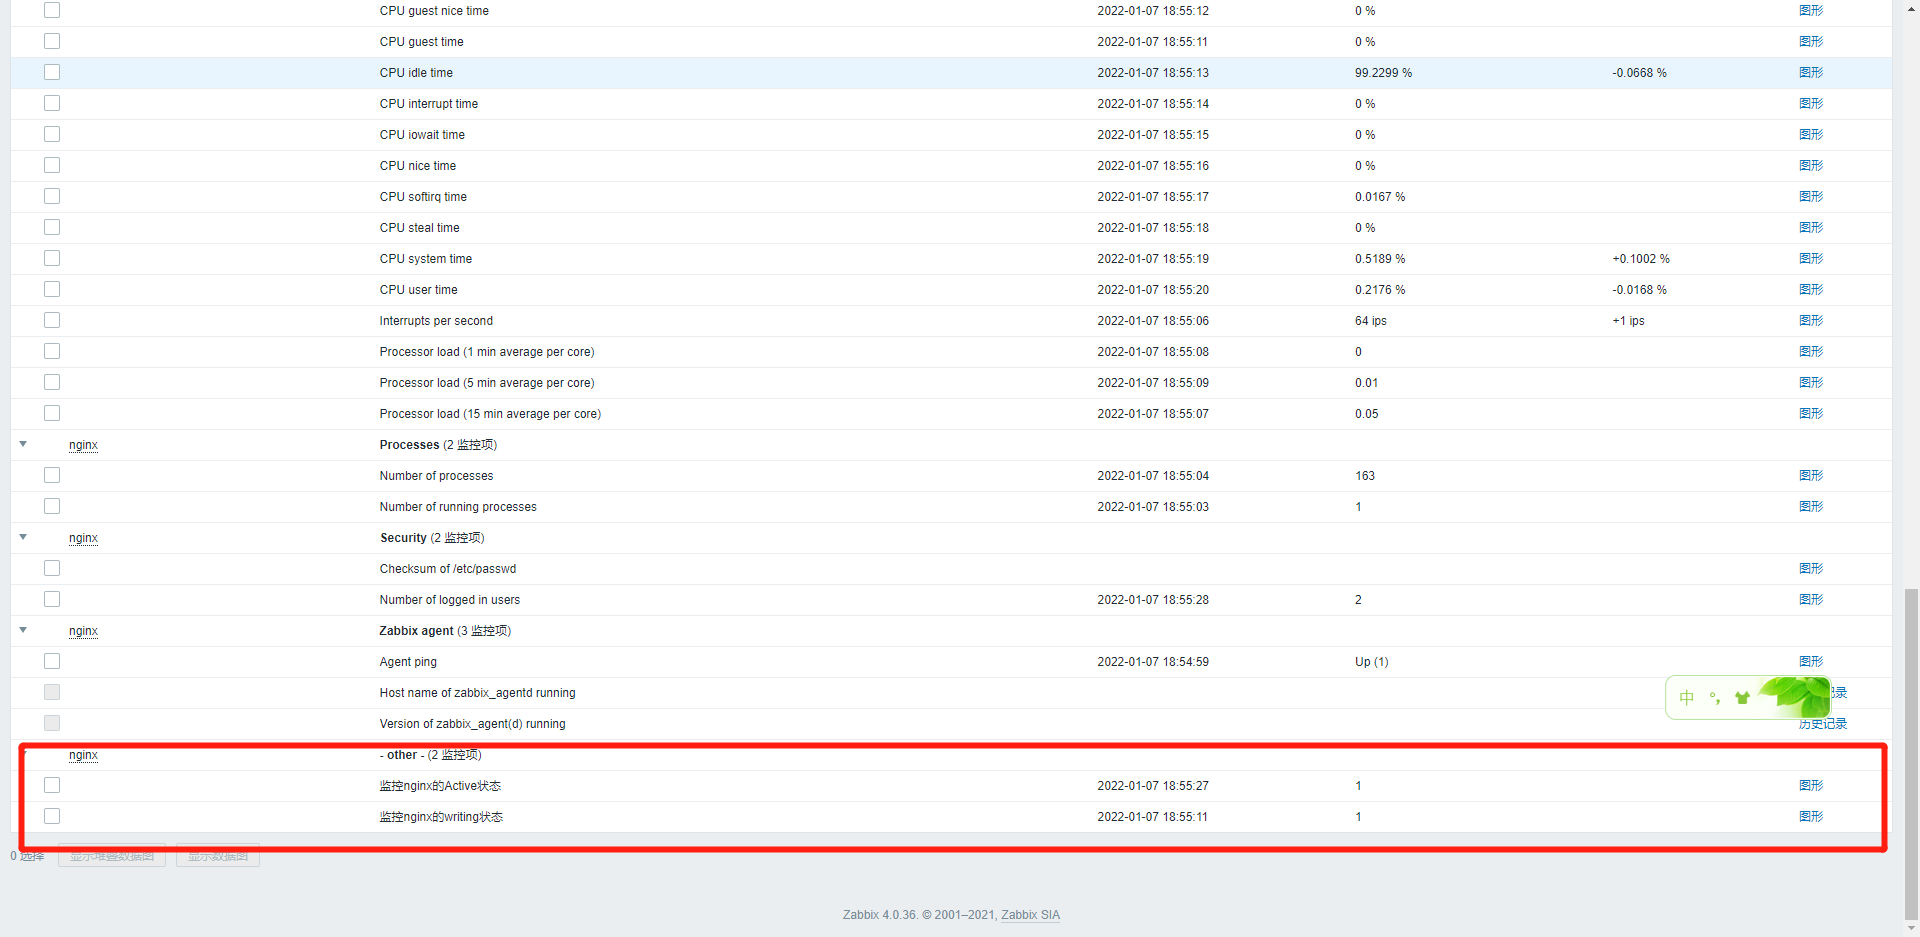
7、到zabbix的web界面上添加监控项
- 添加监控主机;配置→主机→创建主机
- 创建监控项
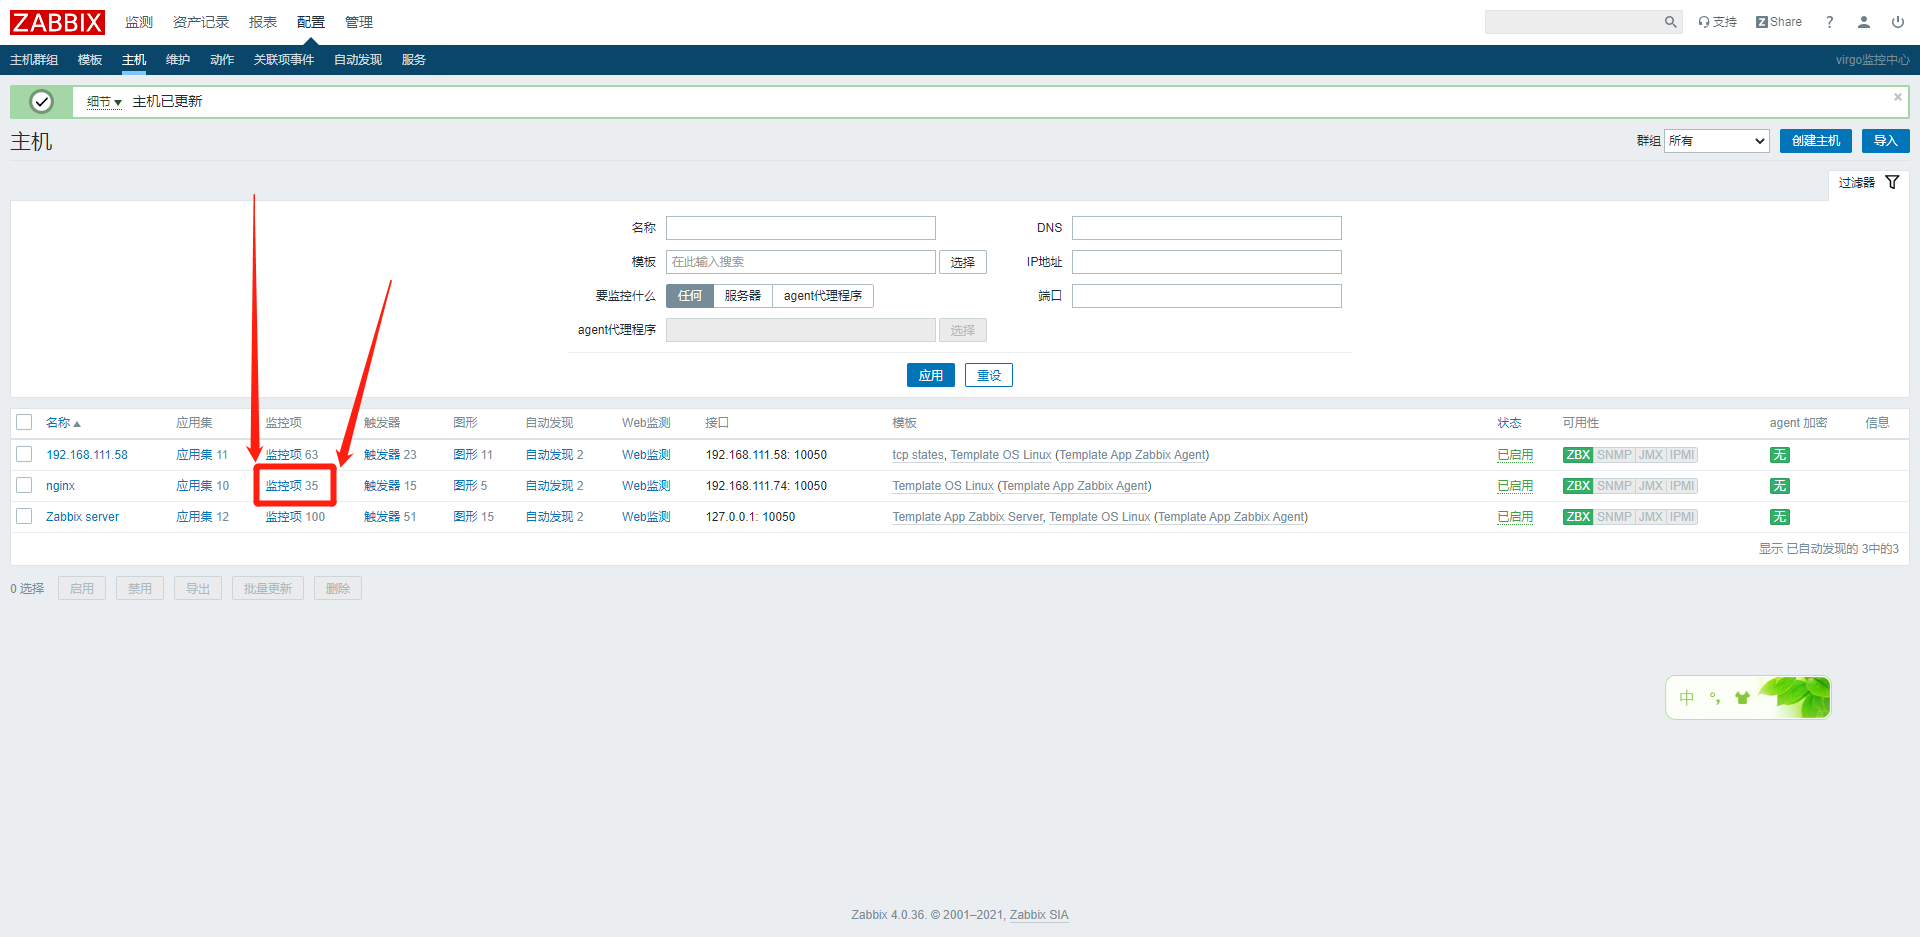
- 重启zabbix-agent,检查是否获取到监控数据。监测→最新数据
17、添加监控php-fpm服务
- 安装php-fpm环境
yum install php php-fpm php-mysql php-devel php-gd php-pecl-memcache php-pspell php-snmp php-xmlrpc php-xml php-pdo
php-pgsql php-pecl-redis php-soap
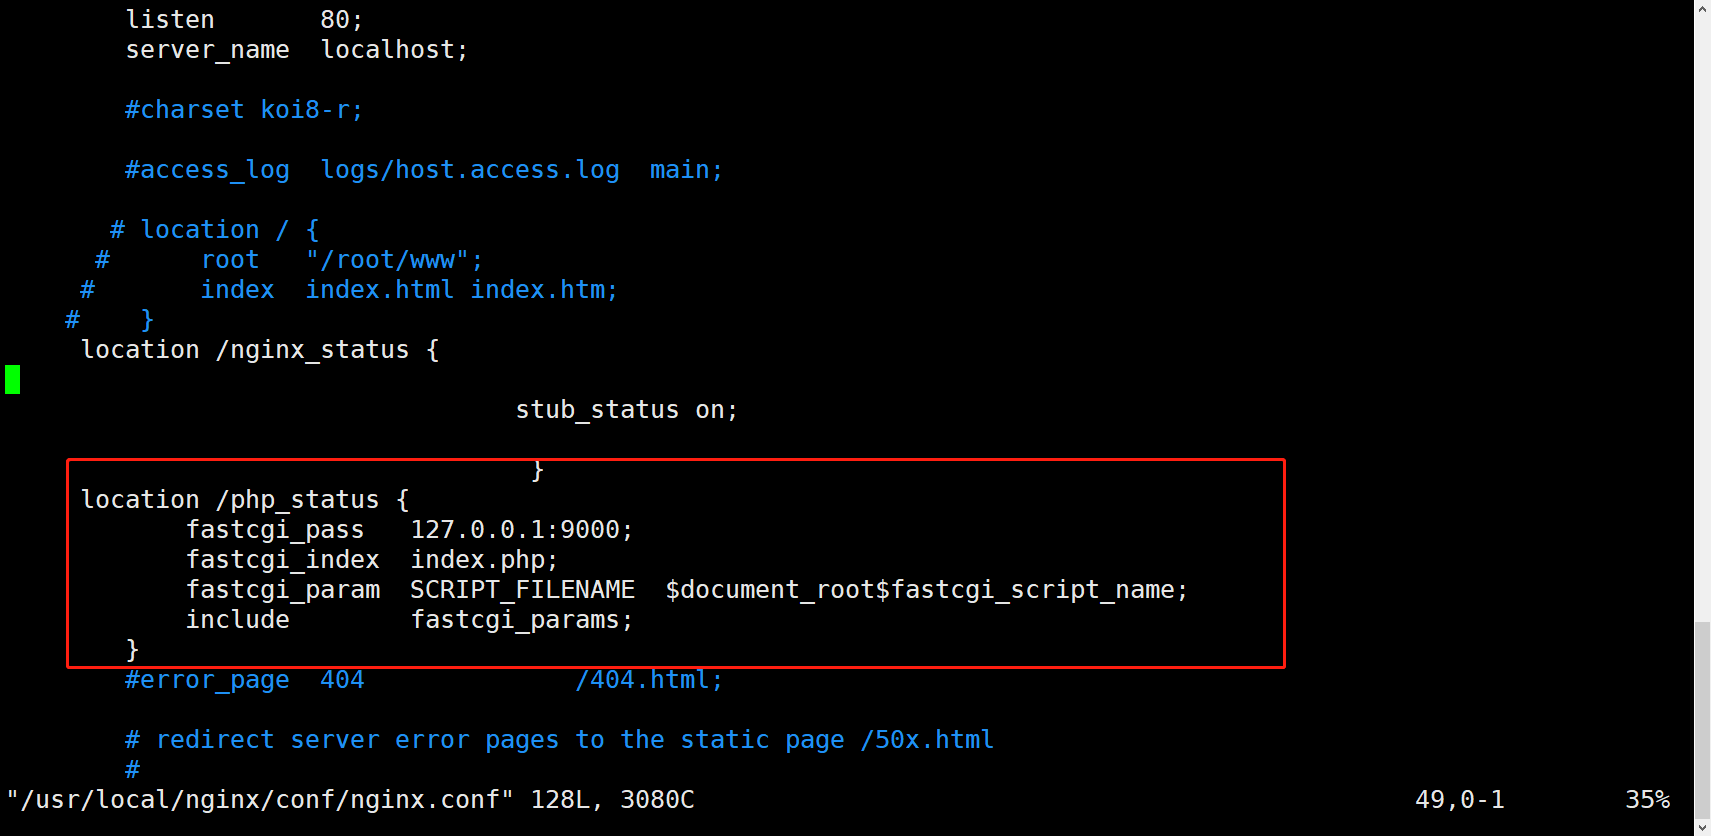
- 修改nginx配置文件(添加下面这段代码)
location /php_status {
            fastcgi_pass   127.0.0.1:9000;
            fastcgi_index  index.php;
            fastcgi_param  SCRIPT_FILENAME  $document_root$fastcgi_script_name;
            include        fastcgi_params;
        }
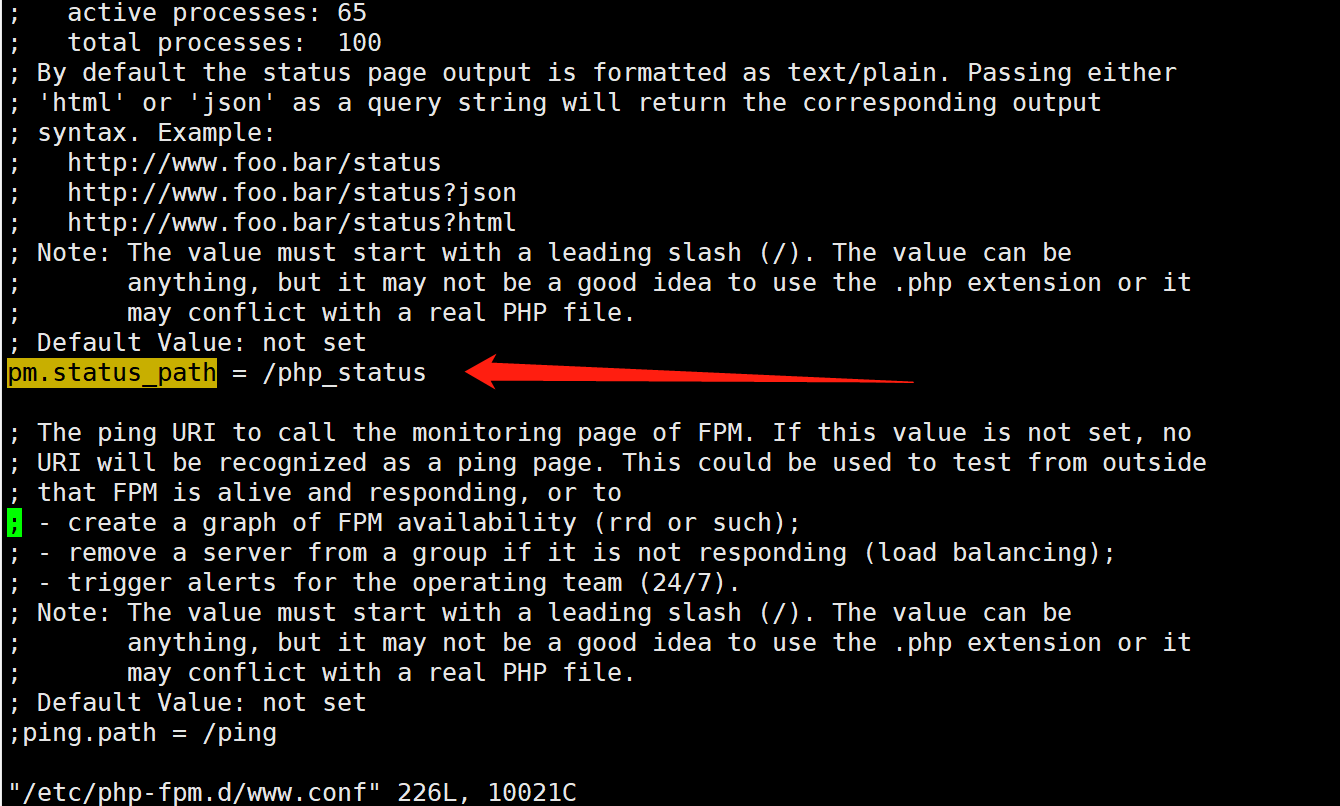
- 修改php-fpm配置文件(去掉注意,修改名字)
pm.status_path = /php_status
- 执行nginx-t
- 执行nginx -s reload
- 到浏览器验证是否能获取到数据
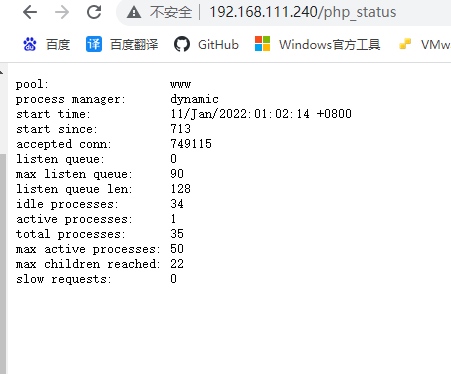
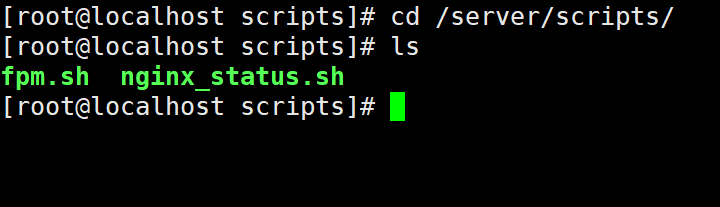
- 编写监控脚本(脚本放在/server/scripts/,该目录自定义创建)
#!/bin/sh
#php-fpm status
case $1 in
ping) #检测php-fpm进程是否存在
/sbin/pidof php-fpm | wc -l
;;
start_since) #提取status中的start since数值
/usr/bin/curl 127.0.0.1/php_status 2>/dev/null | awk 'NR==4{print $3}'
;;
conn) #提取status中的accepted conn数值
/usr/bin/curl 127.0.0.1/php_status 2>/dev/null | awk 'NR==5{print $3}'
;;
listen_queue) #提取status中的listen queue数值
/usr/bin/curl 127.0.0.1/php_status 2>/dev/null | awk 'NR==6{print $3}'
;;
max_listen_queue) #提取status中的max listen queue数值
/usr/bin/curl 127.0.0.1/php_status 2>/dev/null | awk 'NR==7{print $4}'
;;
listen_queue_len) #提取status中的listen queue len
/usr/bin/curl 127.0.0.1/php_status 2>/dev/null | awk 'NR==8{print $4}'
;;
idle_processes) #提取status中的idle processes数值
/usr/bin/curl 127.0.0.1/php_status 2>/dev/null | awk 'NR==9{print $3}'
;;
active_processes) #提取status中的active processes数值
/usr/bin/curl 127.0.0.1/php_status 2>/dev/null | awk 'NR==10{print $3}'
;;
total_processes) #提取status中的total processess数值
/usr/bin/curl 127.0.0.1/php_status 2>/dev/null | awk 'NR==11{print $3}'
;;
max_active_processes) #提取status中的max active processes数值
/usr/bin/curl 127.0.0.1/php_status 2>/dev/null | awk 'NR==12{print $4}'
;;
max_children_reached) #提取status中的max children reached数值
/usr/bin/curl 127.0.0.1/php_status 2>/dev/null | awk 'NR==13{print $4}'
;;
slow_requests) #提取status中的slow requests数值
/usr/bin/curl 127.0.0.1/php_status 2>/dev/null | awk 'NR==14{print $3}'
;;
*)
echo "Usage: $0 {conn|listen_queue|max_listen_queue|listen_queue_len|idle_processes|active_processess|total_processes|max_active_processes|max_children_reached|slow_requests}"
exit 1
;;
esac
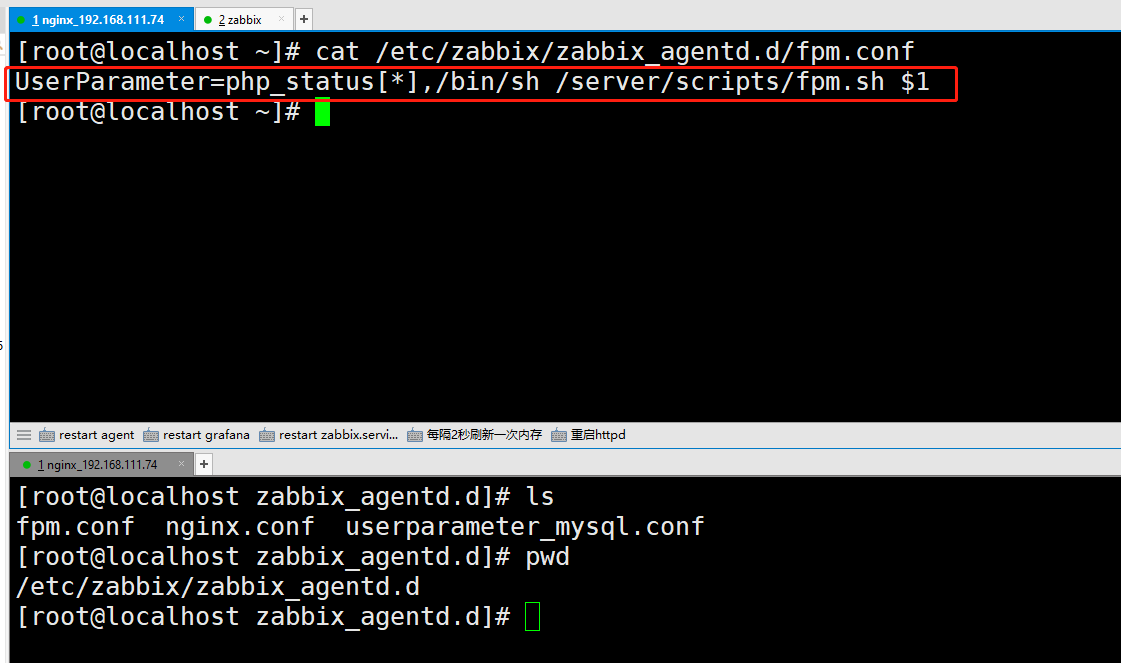
- 编写配置文件
- 重启zabbix-agent.service服务
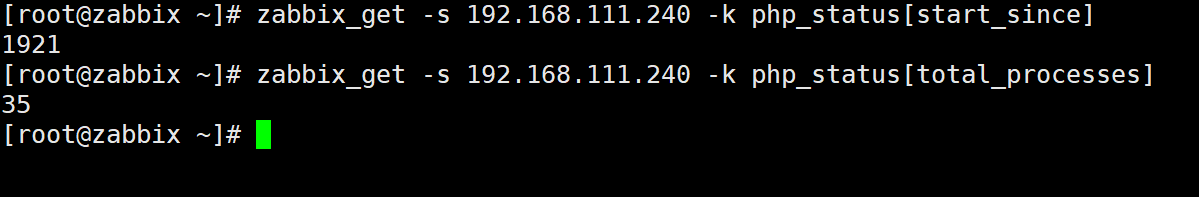
- zabbix服务端测试获取数据
- 导入模板
链接:https://pan.baidu.com/s/1bnoYn1gD7xdQTEUzFj44eA
提取码:47sv
参考链接:https://www.cnblogs.com/wzxmt/p/9824428.html
18、搭建discuz论坛使用redis加速
- 修改nginx配置文件
目录如果设置在root下面会报403错
403报错排查方法:https://www.cnblogs.com/williamjie/p/9604594.html
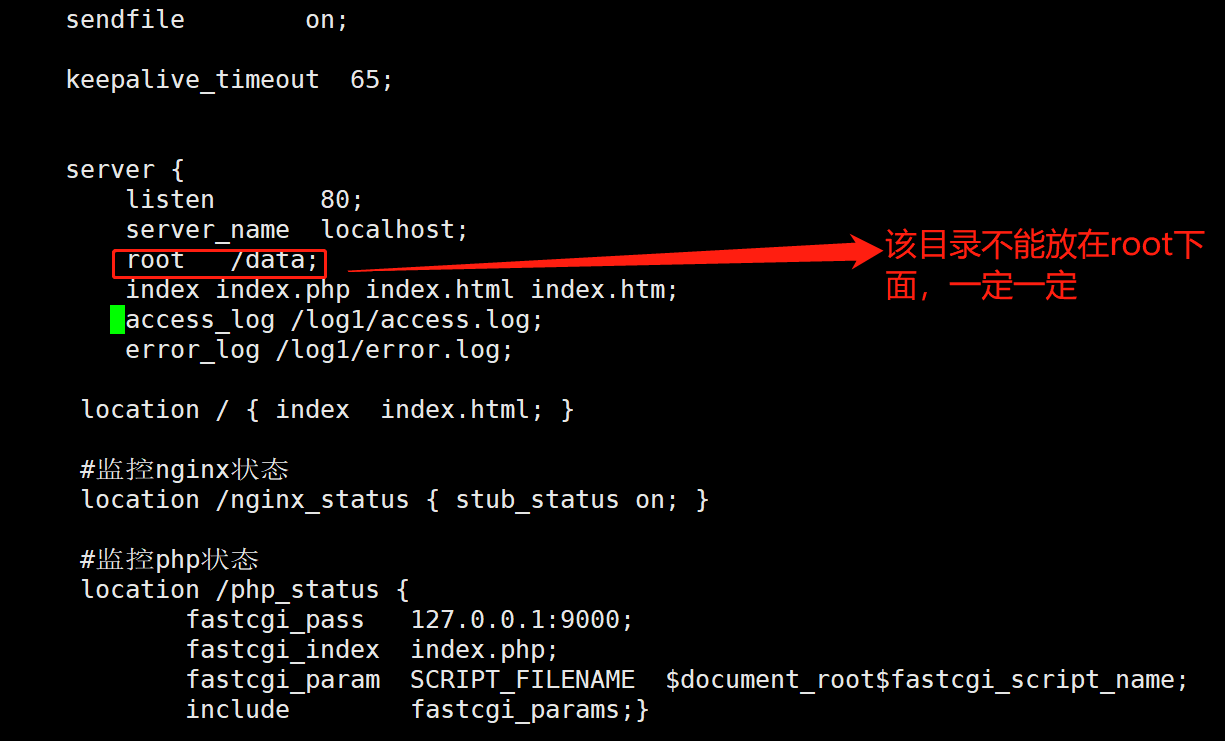
root /data;
index index.html index.htm;
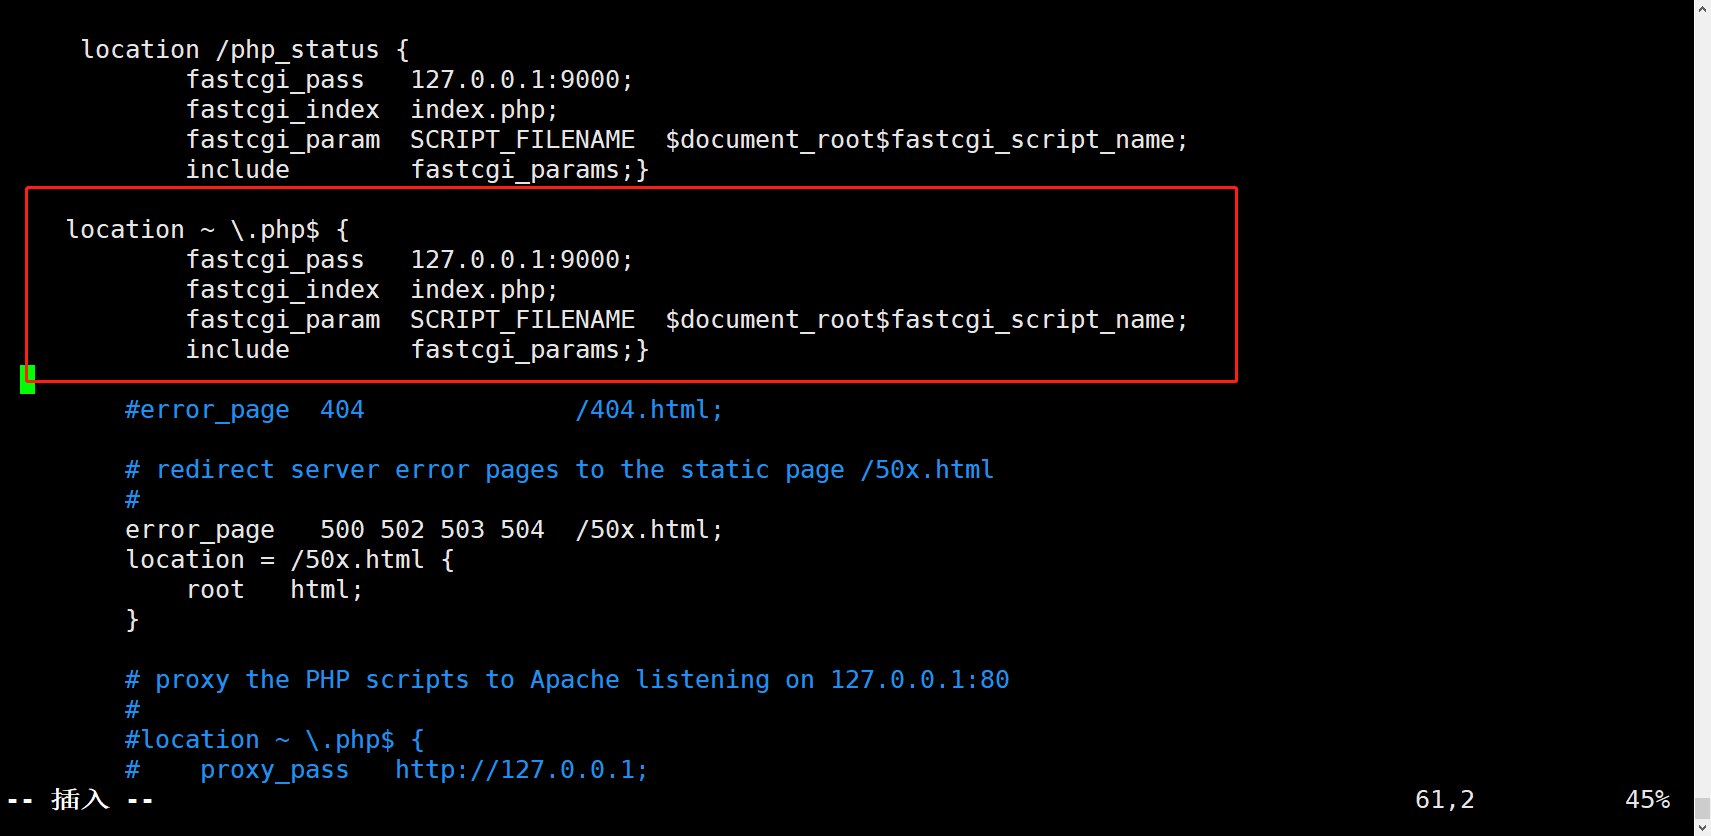
# 在配置文件中添加这两段代码
location ~ \.php$ {
fastcgi_pass 127.0.0.1:9000;
fastcgi_index index.php;
fastcgi_param SCRIPT_FILENAME $document_root$fastcgi_script_name;
include fastcgi_params;}
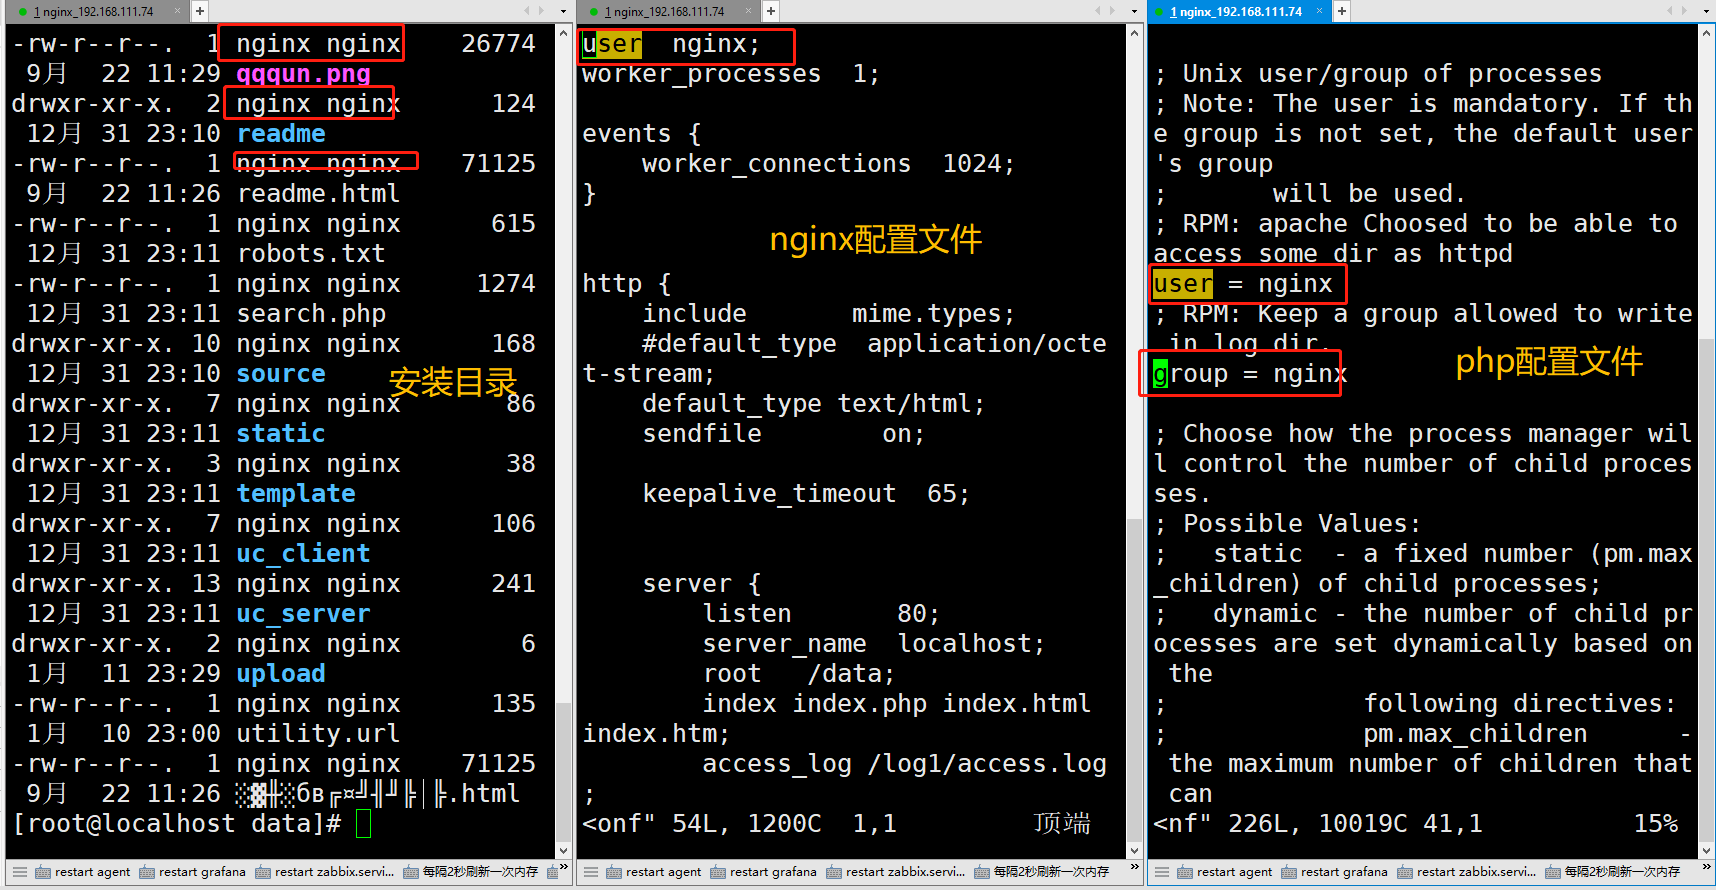
- 将discuz上传到data目录下(目录位置名称可自定义)
[root@localhost data]# ls
Discuz_X3.4_SC_UTF8_20211231.zip
unzip Discuz_X3.4_SC_UTF8_20211231.zip #解压
[root@localhost data]# mv upload/* . #将upload文件移出来
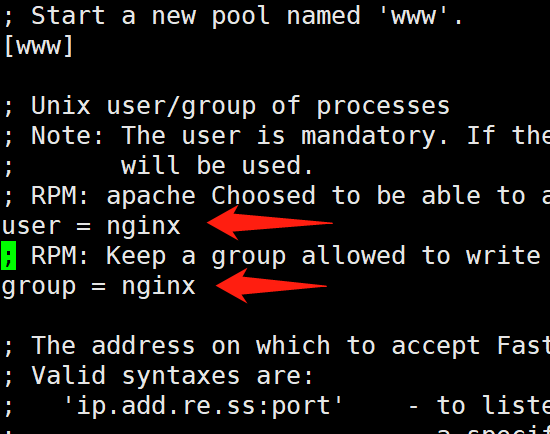
[root@localhost data]# chown -R nginx:nginx . #修改权限,该方法仅限于测试使用
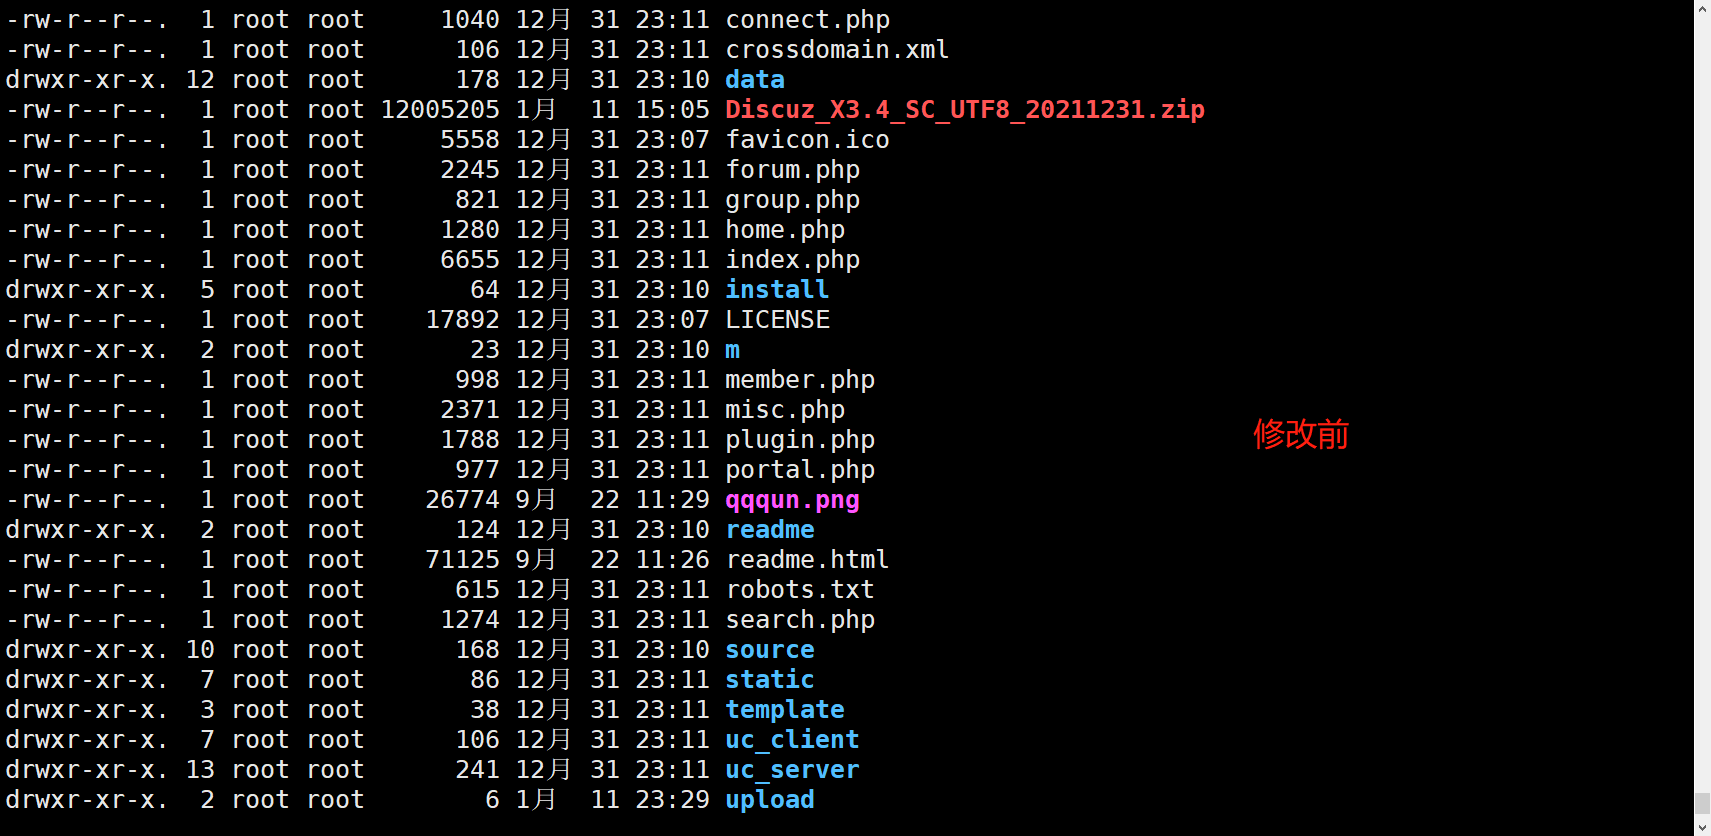
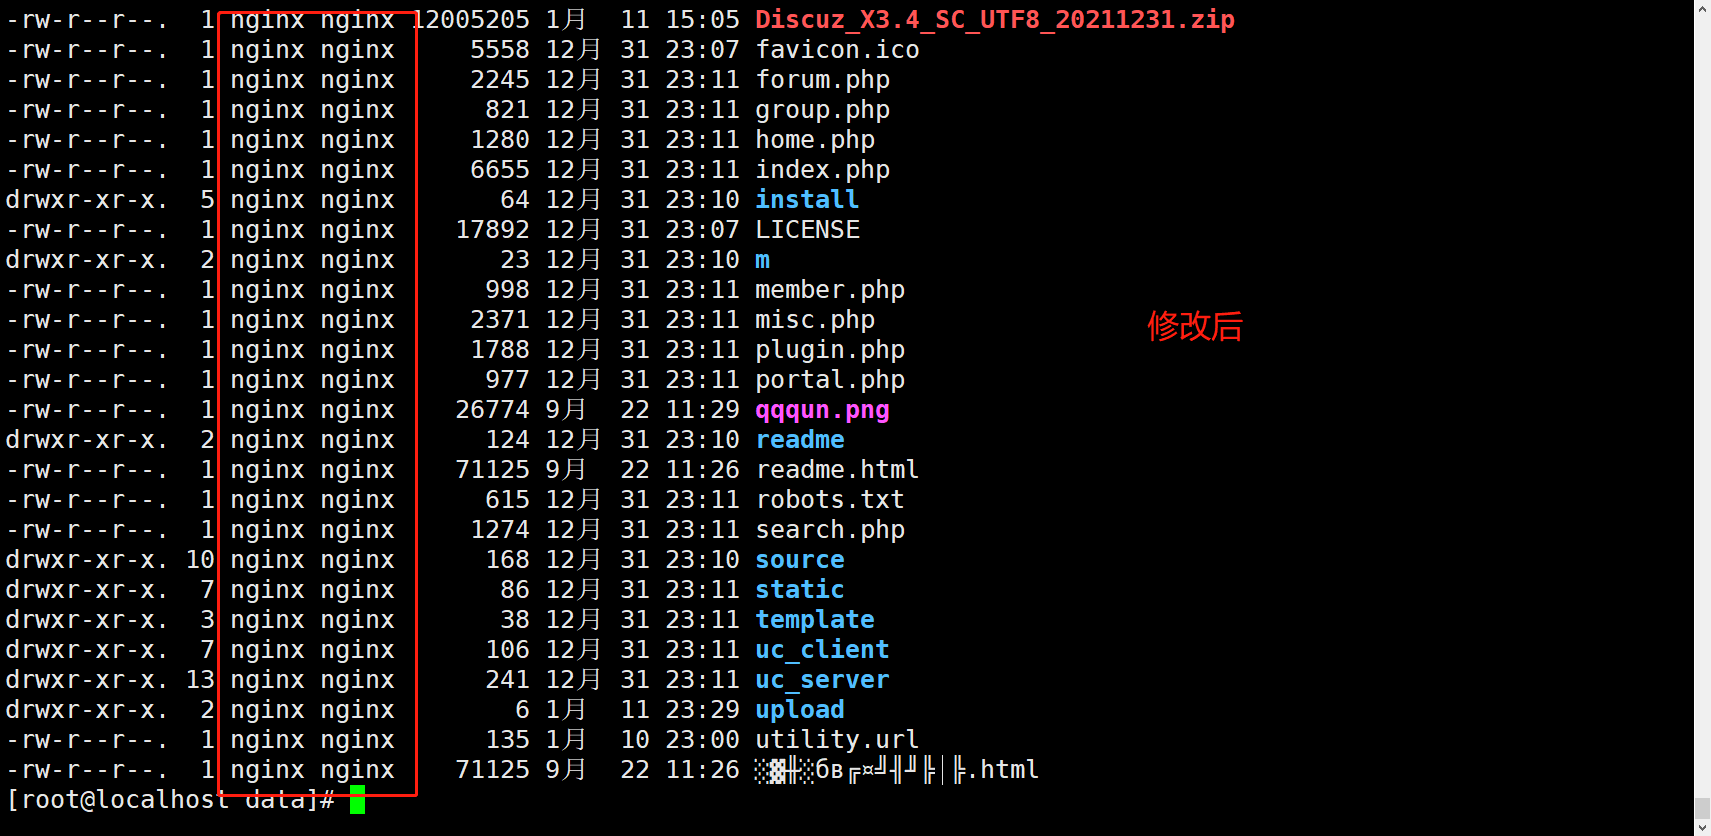
注意点:nginx配置文件中的user、php配置文件中的user group、以及安装文件的user和group需要保持一致
- 到浏览器访问安装
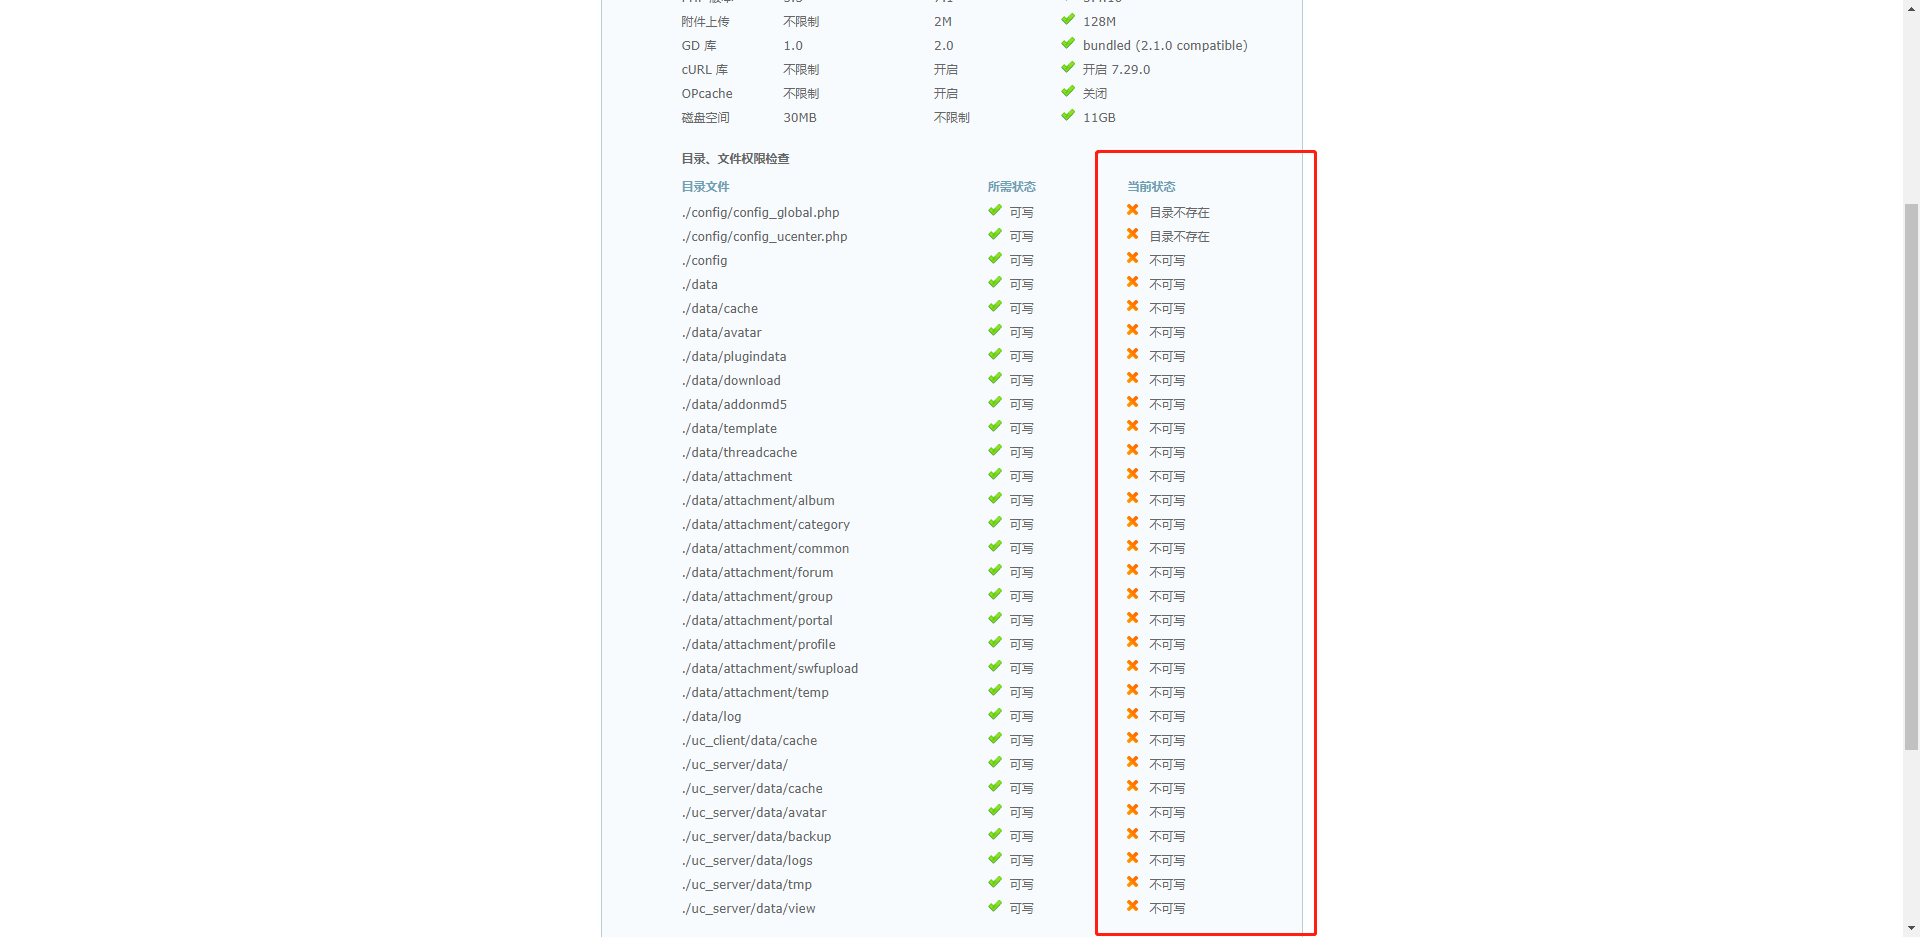
显示不可写解决方法有2个:
方法1:chmod -R 777 .  #不建议使用

方法2:修改php配置文件
user和group修改为nginx
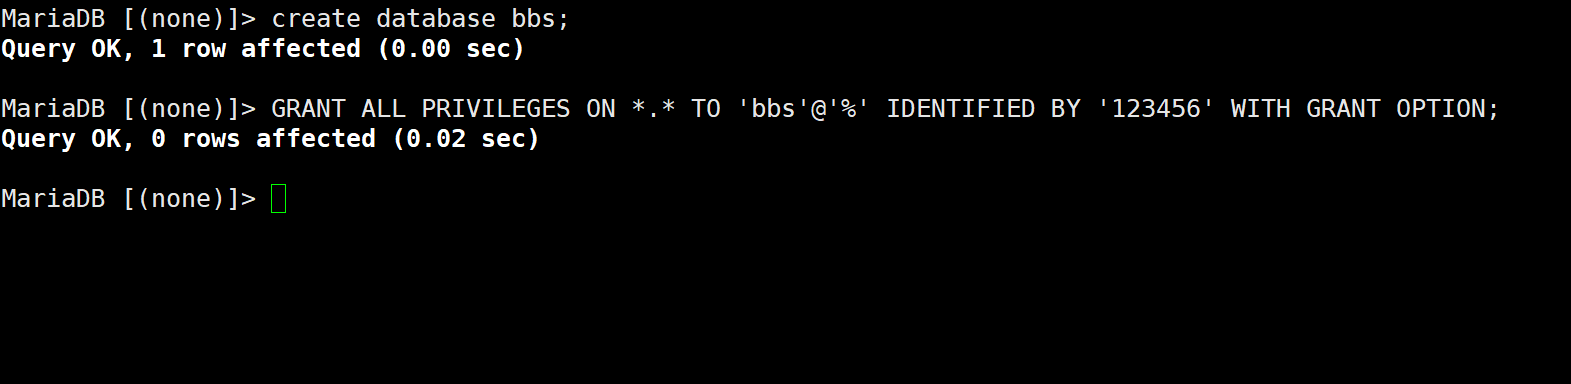
-
创建数据库


-
安装redis
yum install redis -y -
修改redis监听地址(默认是127.0.0.1)
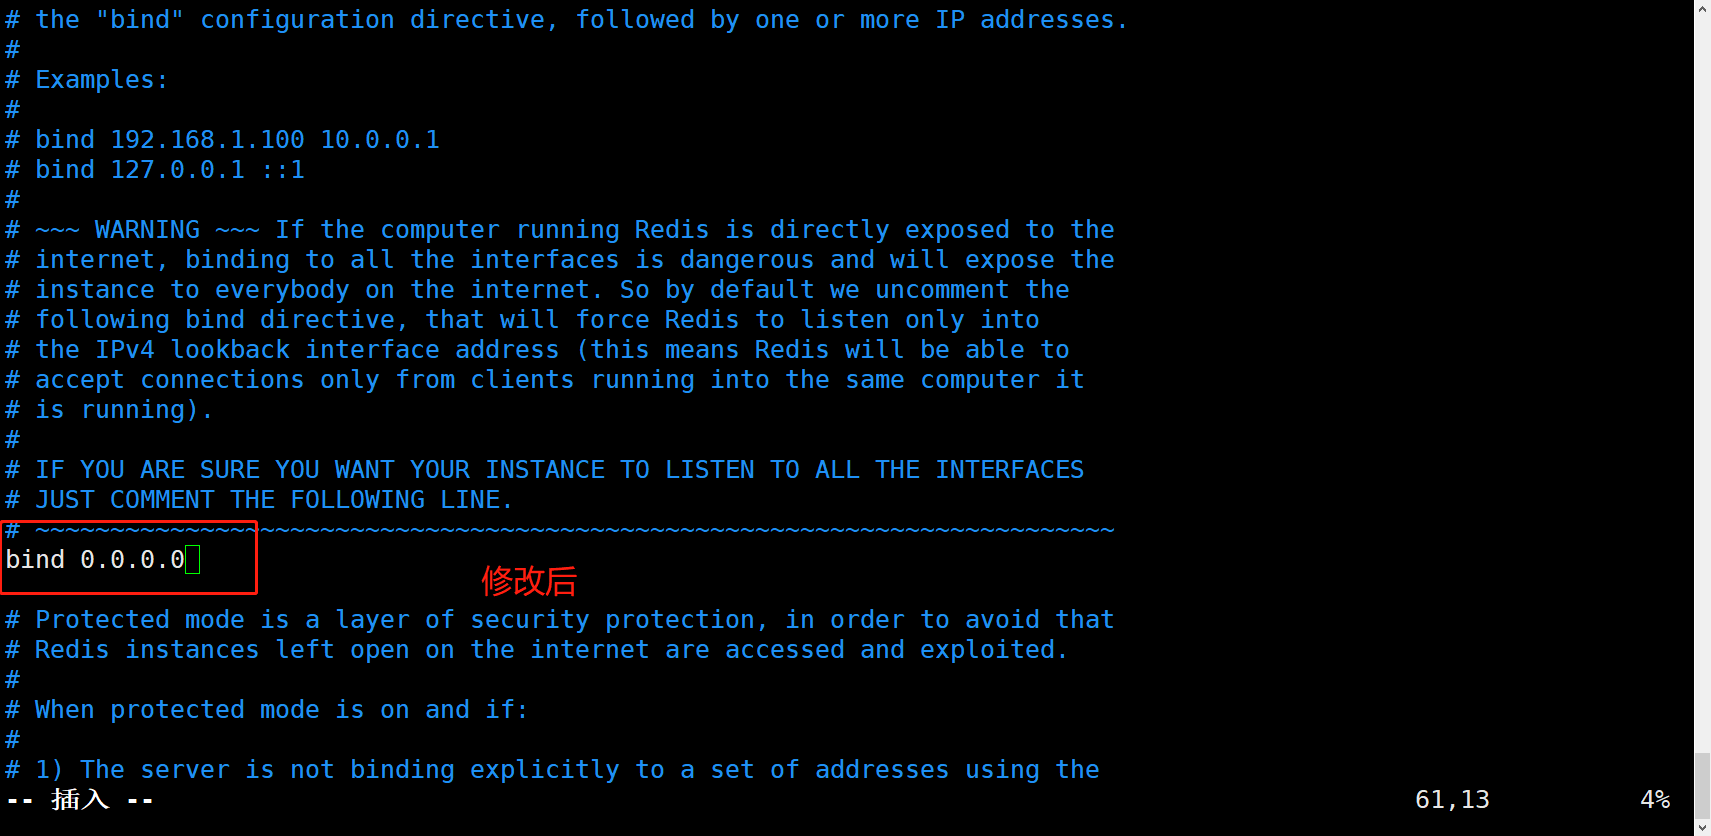
-
重启redis
systemctl restart redis -
在php服务器上安装redis客户的
[root@localhost ~]# yum list|grep php |grep redis                #搜索包名
php-nrk-Predis.noarch                    1.0.4-1.el7                   epel
php-pecl-redis.x86_64                    2.2.8-1.el7                   epel
php-phpiredis.x86_64                     1.0.0-2.el7                   epel

[root@localhost ~]# yum install  php-pecl-redis.x86_64   -y    #安装
- 重启php
systemctl restart php-fpm - 打开redis服务
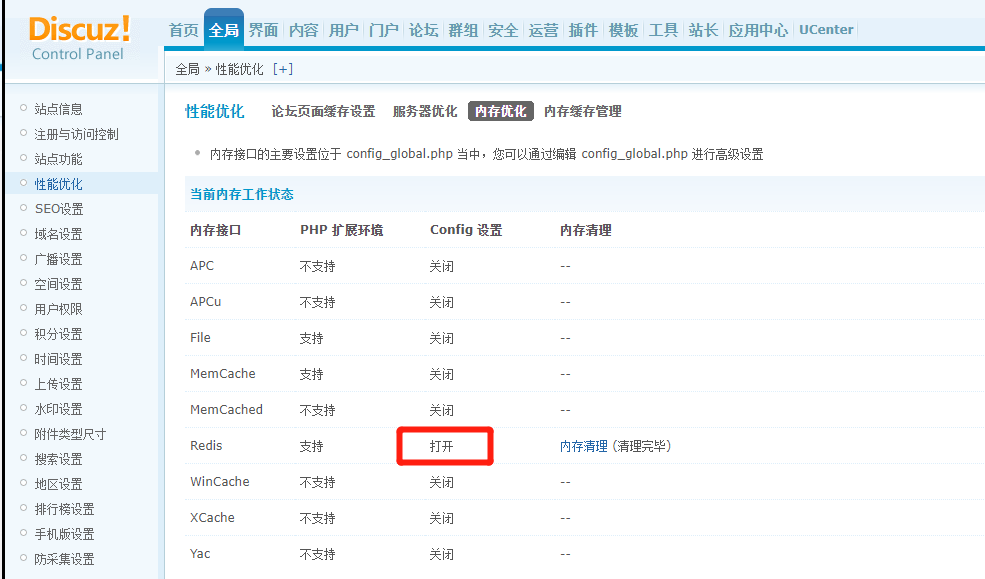

- 测试redis加速效果
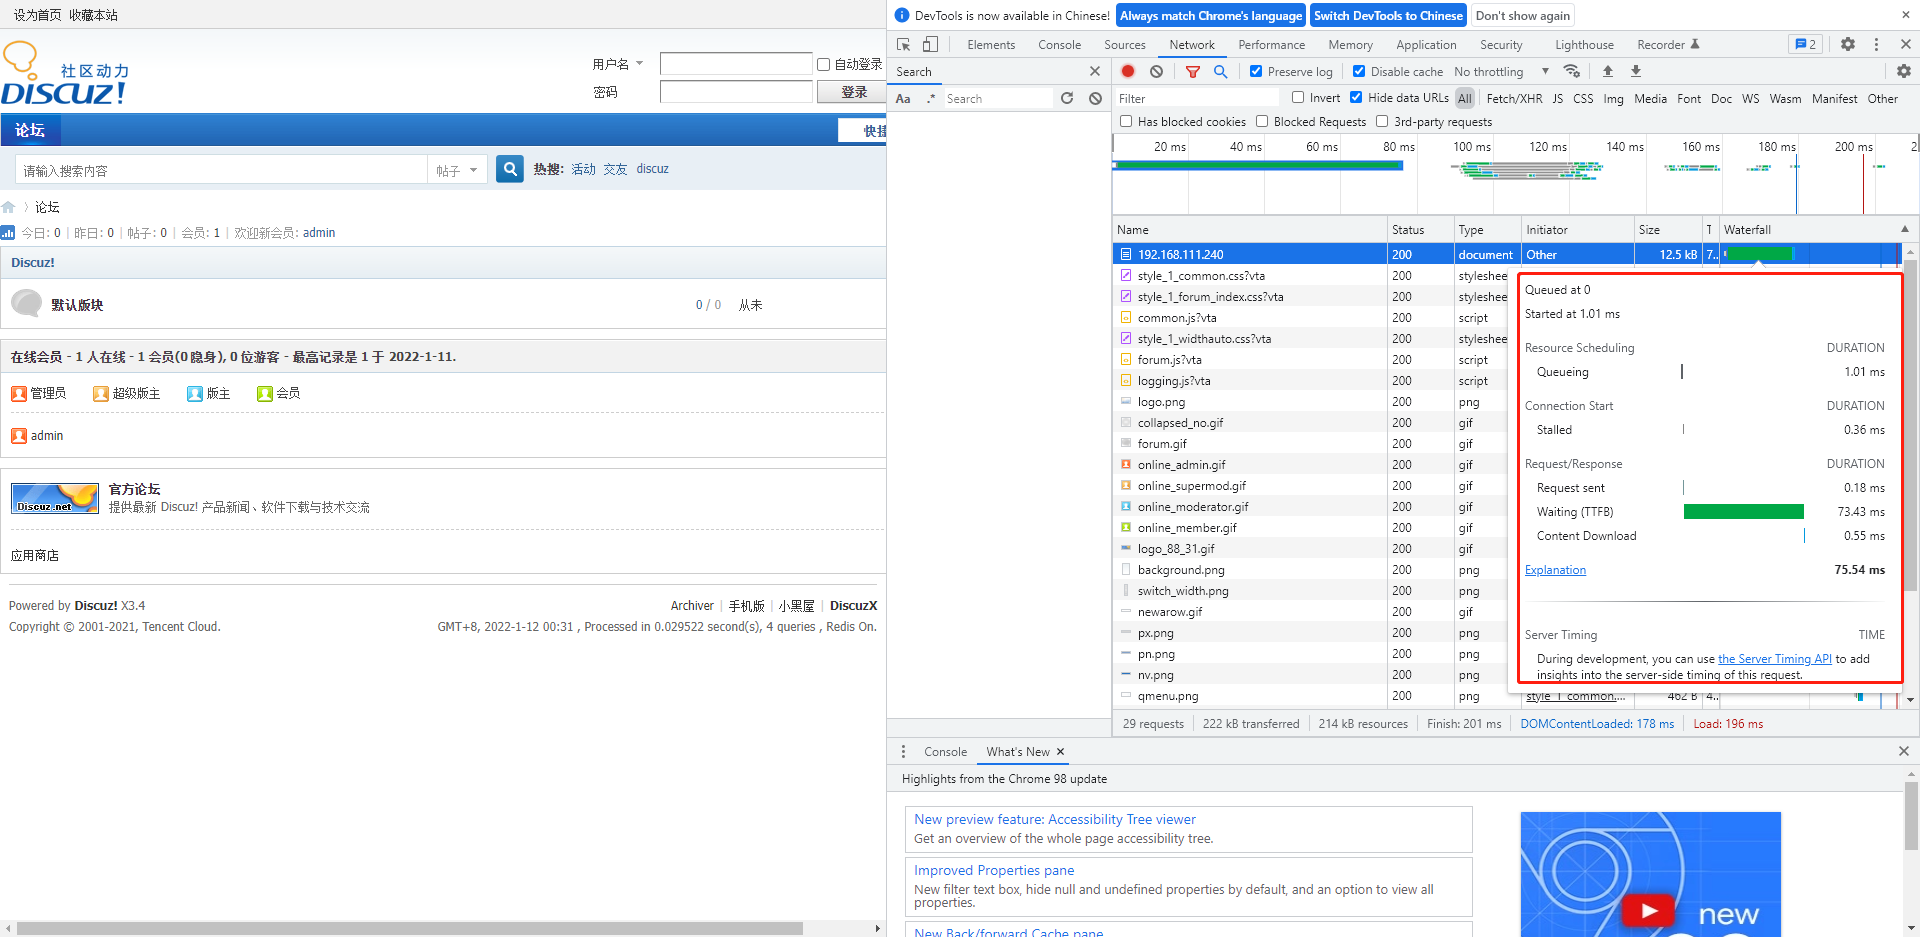
查看打开discuz主页加载的ms即可
19、添加监控redis服务
- 编写监控脚本
#!/bin/bash
REDISPATH="/usr/bin/redis-cli"
HOST="127.0.0.1"
PORT="6379"
REDIS_INFO="$REDISPATH -h $HOST -p $PORT info"
if [[ $# == 1 ]];then
case $1 in
cluster)
        result=`$REDIS_INFO|/bin/grep cluster|awk -F":" '{print $NF}'`
        echo $result
;;
uptime_in_seconds)
        result=`$REDIS_INFO|/bin/grep uptime_in_seconds|awk -F":" '{print $NF}'`
        echo $result
;;
connected_clients)
        result=`$REDIS_INFO|/bin/grep connected_clients|awk -F":" '{print $NF}'`
        echo $result
;;
client_longest_output_list)
        result=`$REDIS_INFO|/bin/grep client_longest_output_list|awk -F":" '{print $NF}'`
        echo $result
;;
client_biggest_input_buf)
        result=`$REDIS_INFO|/bin/grep client_biggest_input_buf|awk -F":" '{print $NF}'`
        echo $result
;;
blocked_clients)
        result=`$REDIS_INFO|/bin/grep blocked_clients|awk -F":" '{print $NF}'`
        echo $result
;;
#内存
used_memory)
        result=`$REDIS_INFO|/bin/grep used_memory|awk -F":" '{print $NF}'|awk 'NR==1'`
        echo $result
;;
used_memory_human)
        result=`$REDIS_INFO|/bin/grep used_memory_human|awk -F":" '{print $NF}'|awk -F'K' '{print $1}'`
        echo $result
;;
used_memory_rss)
        result=`$REDIS_INFO|/bin/grep used_memory_rss|awk -F":" '{print $NF}'`
        echo $result
;;
used_memory_peak)
        result=`$REDIS_INFO|/bin/grep used_memory_peak|awk -F":" '{print $NF}'|awk 'NR==1'`
        echo $result
;;
used_memory_peak_human)
        result=`$REDIS_INFO|/bin/grep used_memory_peak_human|awk -F":" '{print $NF}'|awk -F'K' '{print $1}'`
        echo $result
;;
used_memory_lua)
        result=`$REDIS_INFO|/bin/grep used_memory_lua|awk -F":" '{print $NF}'`
        echo $result
;;
mem_fragmentation_ratio)
        result=`$REDIS_INFO|/bin/grep mem_fragmentation_ratio|awk -F":" '{print $NF}'`
        echo $result
;;
#rdb
rdb_changes_since_last_save)
        result=`$REDIS_INFO|/bin/grep rdb_changes_since_last_save|awk -F":" '{print $NF}'`
        echo $result
;;
rdb_bgsave_in_progress)
        result=`$REDIS_INFO|/bin/grep rdb_bgsave_in_progress|awk -F":" '{print $NF}'`
        echo $result
;;
rdb_last_save_time)
        result=`$REDIS_INFO|/bin/grep rdb_last_save_time|awk -F":" '{print $NF}'`
        echo $result
;;
rdb_last_bgsave_status)
        result=`$REDIS_INFO|/bin/grep -w "rdb_last_bgsave_status" | awk -F':' '{print $2}' | /bin/grep -c ok`
        echo $result
;;
rdb_current_bgsave_time_sec)
        result=`$REDIS_INFO|/bin/grep -w "rdb_current_bgsave_time_sec" | awk -F':' '{print $2}'`
        echo $result
;;
#rdbinfo
aof_enabled)
        result=`$REDIS_INFO|/bin/grep -w "aof_enabled" | awk -F':' '{print $2}'`
        echo $result
;;
aof_rewrite_scheduled)
        result=`$REDIS_INFO|/bin/grep -w "aof_rewrite_scheduled" | awk -F':' '{print $2}'`
        echo $result
;;
aof_last_rewrite_time_sec)
        result=`$REDIS_INFO|/bin/grep -w "aof_last_rewrite_time_sec" | awk -F':' '{print $2}'`
        echo $result
            ;;
aof_current_rewrite_time_sec)
        result=`$REDIS_INFO|/bin/grep -w "aof_current_rewrite_time_sec" | awk -F':' '{print $2}'`
        echo $result
            ;;
aof_last_bgrewrite_status)
        result=`$REDIS_INFO|/bin/grep -w "aof_last_bgrewrite_status" | awk -F':' '{print $2}' | /bin/grep -c ok`
        echo $result
;;
#aofinfo
aof_current_size)
        result=`$REDIS_INFO|/bin/grep -w "aof_current_size" | awk -F':' '{print $2}'`
        echo $result
;;
aof_base_size)
        result=`$REDIS_INFO|/bin/grep -w "aof_base_size" | awk -F':' '{print $2}'`
        echo $result
;;
aof_pending_rewrite)
        result=`$REDIS_INFO|/bin/grep -w "aof_pending_rewrite" | awk -F':' '{print $2}'`
        echo $result
;;
aof_buffer_length)
        result=`$REDIS_INFO|/bin/grep -w "aof_buffer_length" | awk -F':' '{print $2}'`
        echo $result
;;
aof_rewrite_buffer_length)
        result=`$REDIS_INFO|/bin/grep -w "aof_rewrite_buffer_length" | awk -F':' '{print $2}'`
        echo $result
;;
aof_pending_bio_fsync)
        result=`$REDIS_INFO|/bin/grep -w "aof_pending_bio_fsync" | awk -F':' '{print $2}'`
        echo $result
;;
aof_delayed_fsync)
        result=`$REDIS_INFO|/bin/grep -w "aof_delayed_fsync" | awk -F':' '{print $2}'`
        echo $result
;;
#stats
total_connections_received)
        result=`$REDIS_INFO|/bin/grep -w "total_connections_received" | awk -F':' '{print $2}'`
        echo $result
;;
total_commands_processed)
        result=`$REDIS_INFO|/bin/grep -w "total_commands_processed" | awk -F':' '{print $2}'`
        echo $result
;;
instantaneous_ops_per_sec)
        result=`$REDIS_INFO|/bin/grep -w "instantaneous_ops_per_sec" | awk -F':' '{print $2}'`
        echo $result
;;
rejected_connections)
        result=`$REDIS_INFO|/bin/grep -w "rejected_connections" | awk -F':' '{print $2}'`
        echo $result
;;
expired_keys)
        result=`$REDIS_INFO|/bin/grep -w "expired_keys" | awk -F':' '{print $2}'`
        echo $result
;;
evicted_keys)
        result=`$REDIS_INFO|/bin/grep -w "evicted_keys" | awk -F':' '{print $2}'`
        echo $result
;;
keyspace_hits)
        result=`$REDIS_INFO|/bin/grep -w "keyspace_hits" | awk -F':' '{print $2}'`
        echo $result
;;
keyspace_misses)
        result=`$REDIS_INFO|/bin/grep -w "keyspace_misses" | awk -F':' '{print $2}'`
        echo $result
;;
pubsub_channels)
        result=`$REDIS_INFO|/bin/grep -w "pubsub_channels" | awk -F':' '{print $2}'`
        echo $result
;;
pubsub_channels)
        result=`$REDIS_INFO|/bin/grep -w "pubsub_channels" | awk -F':' '{print $2}'`
        echo $result
;;
pubsub_patterns)
        result=`$REDIS_INFO|/bin/grep -w "pubsub_patterns" | awk -F':' '{print $2}'`
        echo $result
;;
latest_fork_usec)
        result=`$REDIS_INFO|/bin/grep -w "latest_fork_usec" | awk -F':' '{print $2}'`
        echo $result
;;
connected_slaves)
        result=`$REDIS_INFO|/bin/grep -w "connected_slaves" | awk -F':' '{print $2}'`
        echo $result
;;
master_link_status)
        result=`$REDIS_INFO|/bin/grep -w "master_link_status"|awk -F':' '{print $2}'|/bin/grep -c up`
        echo $result
;;
master_last_io_seconds_ago)
        result=`$REDIS_INFO|/bin/grep -w "master_last_io_seconds_ago"|awk -F':' '{print $2}'`
        echo $result
;;
master_sync_in_progress)
        result=`$REDIS_INFO|/bin/grep -w "master_sync_in_progress"|awk -F':' '{print $2}'`
        echo $result
;;
slave_priority)
        result=`$REDIS_INFO|/bin/grep -w "slave_priority"|awk -F':' '{print $2}'`
        echo $result
;;
#cpu
used_cpu_sys)
        result=`$REDIS_INFO|/bin/grep -w "used_cpu_sys"|awk -F':' '{print $2}'`
        echo $result
;;
used_cpu_user)
        result=`$REDIS_INFO|/bin/grep -w "used_cpu_user"|awk -F':' '{print $2}'`
        echo $result
;;
used_cpu_sys_children)
        result=`$REDIS_INFO|/bin/grep -w "used_cpu_sys_children"|awk -F':' '{print $2}'`
        echo $result
;;
used_cpu_user_children)
        result=`$REDIS_INFO|/bin/grep -w "used_cpu_user_children"|awk -F':' '{print $2}'`
        echo $result
;;
*)
	echo "argu error"
;;
esac
#db0:key
   elif [[ $# == 2 ]];then
case $2 in
keys)
        result=`$REDIS_INFO| /bin/grep -w "db0"| /bin/grep -w "$1" | /bin/grep -w "keys" | awk -F'=|,' '{print $2}'`
        echo $result
;;
expires)
        result=`$REDIS_INFO| /bin/grep -w "db0"| /bin/grep -w "$1" | /bin/grep -w "expires" | awk -F'=|,' '{print $4}'`
        echo $result
;;
avg_ttl)
        result=`$REDIS_INFO|/bin/grep -w "db0"| /bin/grep -w "$1" | /bin/grep -w "avg_ttl" | awk -F'=|,' '{print $6}'`
        echo $result
;;
*)
     echo "argu error" ;;
esac
fi
- 编写配置文件
UserParameter=redis.status,/usr/bin/redis-cli -h 127.0.0.1 -p 6379 ping |grep -c PONG
UserParameter=redis_info[*],/server/scripts/redis.sh $1 $2
- 到web界面添加模板

20、总结
监控一个服务需要哪些步骤呢?
- 开启监控页面(如打开nginx_status、php_status)redis默认打开
- 编写监控取值脚本
- 编写配置文件(调用监控取值脚本)
- zabbix_get测试取值
- web界面导入模板并关联模板
- web界面点监测→最新数据(获取到实时数据即为成功)
21、使用matomo统计分析web网站信息
-
环境要求:
Matomo要求PHP版本高于PHP5.5(选用PHP7.2)
Matomo需要pdo和pdo_mysql或mysqli支持(选用mysqli)
Matomo要求Mysql版本高于MySQL5.5或者使用MariaDB(选用MySQL5.7)
Matomo要求Nginx或Apache或IIS做服务器 (选用Nginx) -
安装相关工具
sudo yum install -y wget curl vim zip unzip bash-completion
- 优化系统
setenforce 0
systemctl stop firewalld && systemctl disable firewalld
-
安装PHP7.2环境
 rpm  -Uvh   https://dl.fedoraproject.org/pub/epel/epel-release-latest-7.noarch.rpm
 rpm  -Uvh   https://mirror.webtatic.com/yum/el7/webtatic-release.rpm
 yum  -y  install  php72w-cli  php72w-common  php72w-devel php-mysqli php72w-fpm php72w php72w-cli php72w-fpm php72w-curl php72w-gd php72w-mysql php72w-xml php72w-mbstring
 yum  install  yum-utils –y
- 检查PHP版本
php --version
- 启动PHP
systemctl start php-fpm.service && systemctl enable php-fpm.service
- 安装Matomo(本次测试使用4.6.2版本)
cd /var/www/                 #切换到该目录下,上传matomo压缩包

wget https://builds.matomo.org/matomo.zip       #下载matomo安装包放在www目录下
- 修改PHP配置文件
vim /etc/php-fpm.d/www.conf #user和group修改为nginx,默认是(apache)
- 重启php服务
systemctl restart php-fpm.service - 安装nginx服务:(1、yum安装 )(2、源码包安装)
yum install -y nginx
-
启动nginx
systemctl enable nginx.service && systemctl start nginx.service -
修改nginx配置文件(!关键点!)
user nginx;
worker_processes auto;
error_log /var/log/nginx/error.log;
pid /run/nginx.pid;

# Load dynamic modules. See /usr/share/doc/nginx/README.dynamic.
include /usr/share/nginx/modules/*.conf;

events {
    worker_connections 1024;
}

http {
    log_format  main  '$remote_addr - $remote_user [$time_local] "$request" '
                      '$status $body_bytes_sent "$http_referer" '
                      '"$http_user_agent" "$http_x_forwarded_for"';

    access_log  /var/log/nginx/access.log  main;

    sendfile            on;
    tcp_nopush          on;
    tcp_nodelay         on;
    keepalive_timeout   65;
    types_hash_max_size 4096;

    include             /etc/nginx/mime.types;
    default_type        application/octet-stream;

    include /etc/nginx/conf.d/*.conf;

    server {
        listen       80;
        listen       [::]:80;
        server_name  _;
       # root         /usr/share/nginx/html;
         root         /var/www;
        include /etc/nginx/default.d/*.conf;

  location /{ try_files $uri /index.php$is_args$args;}

  location ~ \.php$ {
            try_files $uri  =404;
            fastcgi_pass   127.0.0.1:9000;
            fastcgi_index  index.php;
            fastcgi_param  SCRIPT_FILENAME  $document_root$fastcgi_script_name;
	    fastcgi_param  SCRIPT_NAME        $fastcgi_script_name;
	    include        fastcgi_params;
	}

    }

}
配置文件注意点:
1、user nginx;
2、root /var/www;
3、/var/www 目录要授权给nginx用户chown -R nginx:nginx /var/www
遇到的报错:
1、403
2、404
3、File not found.
以上三个报错需要检查php、nginx配置文件信息、项目根目录用户是否有权限(请勿在root目录下设置根目录)
- 设置matomo;到浏览器访问服务器地址即可
本章节参考:https://www.cnblogs.com/vmsky/p/13772708.html
22、web网站的可用性监测
- 配置→主机→web监测
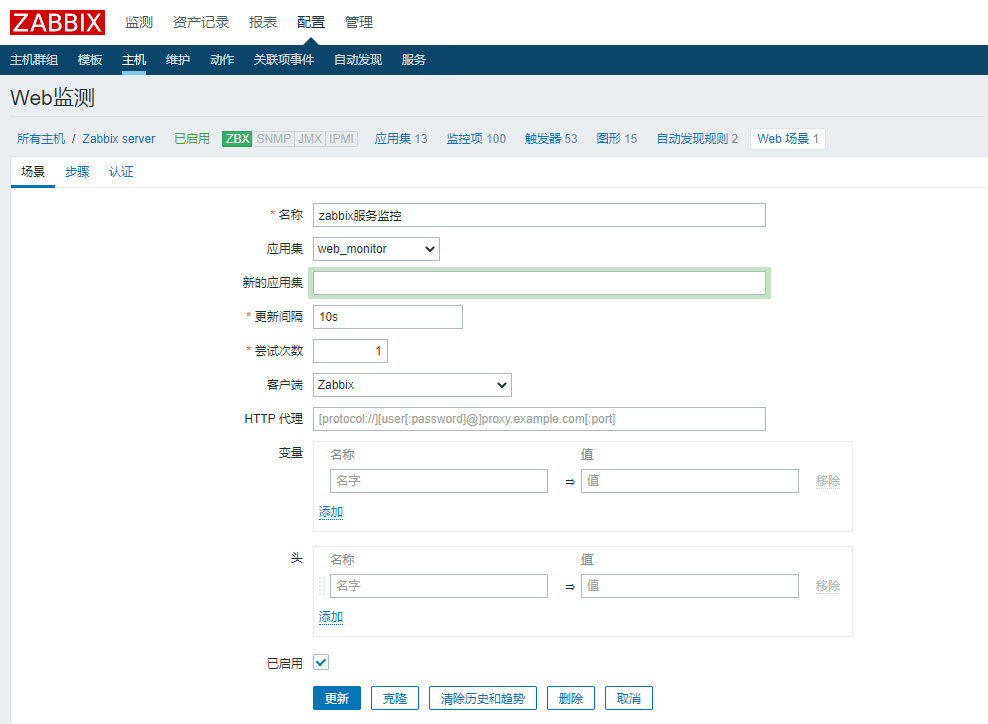
- 步骤(需要监测哪些页面)


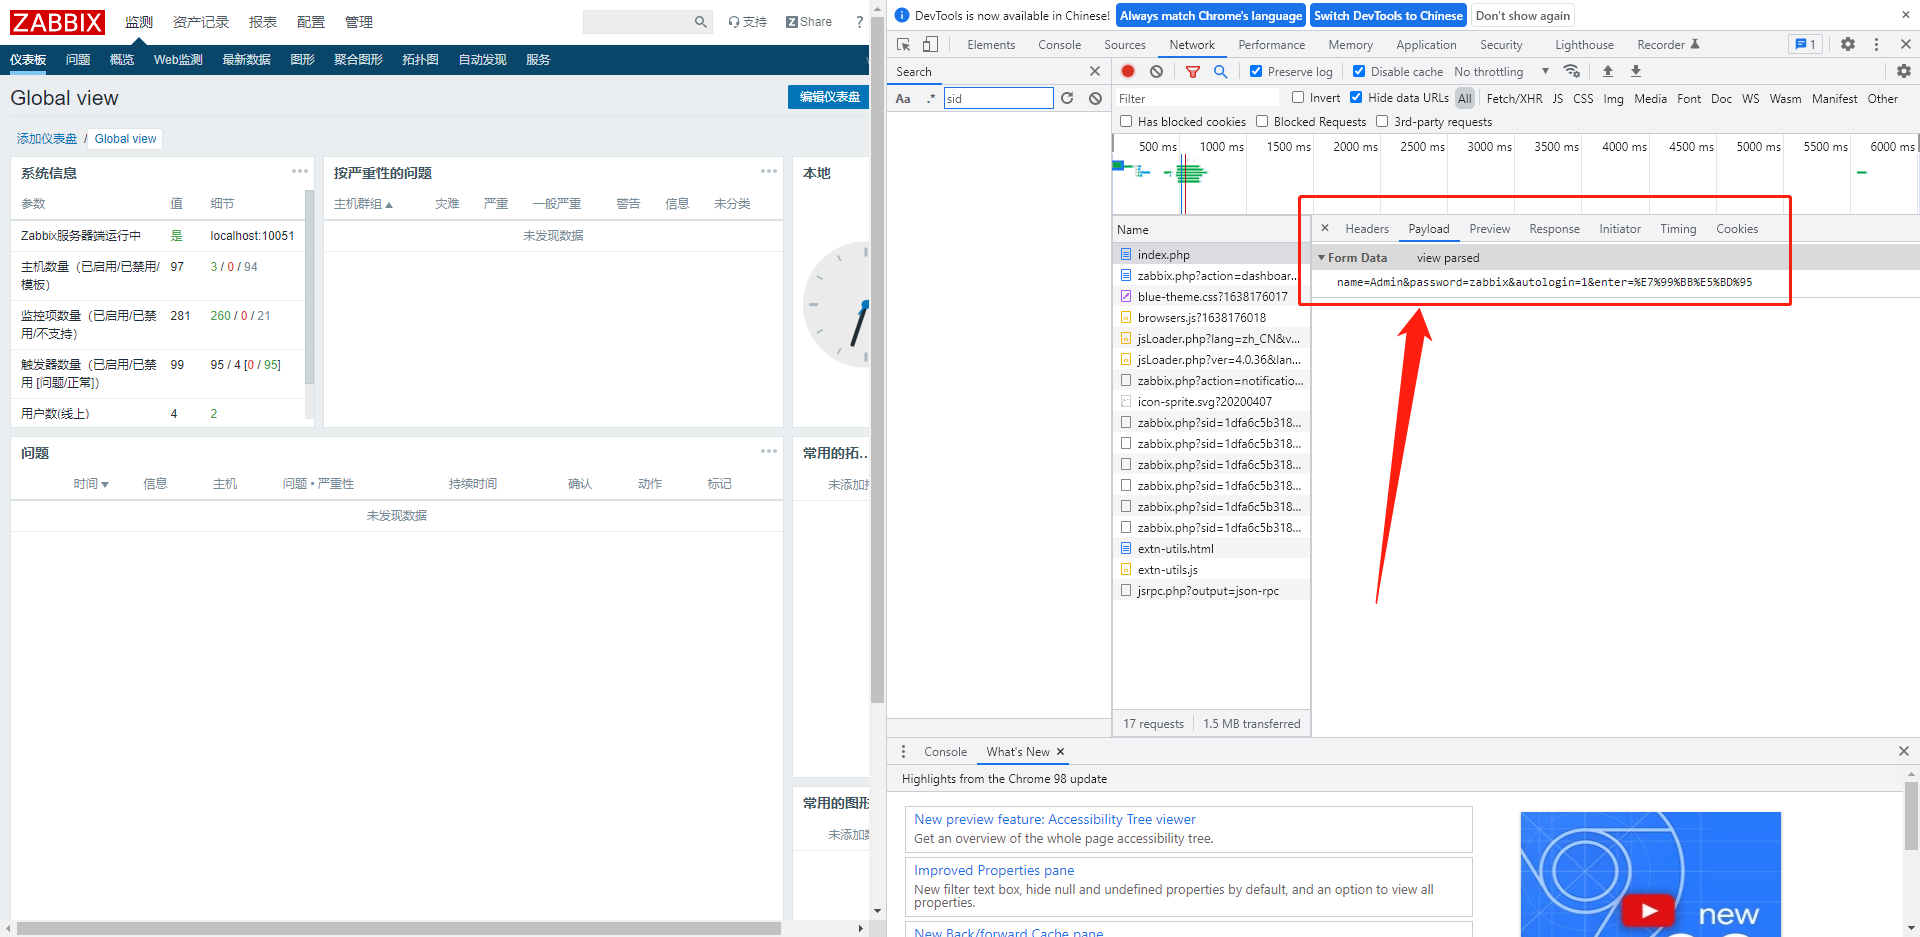
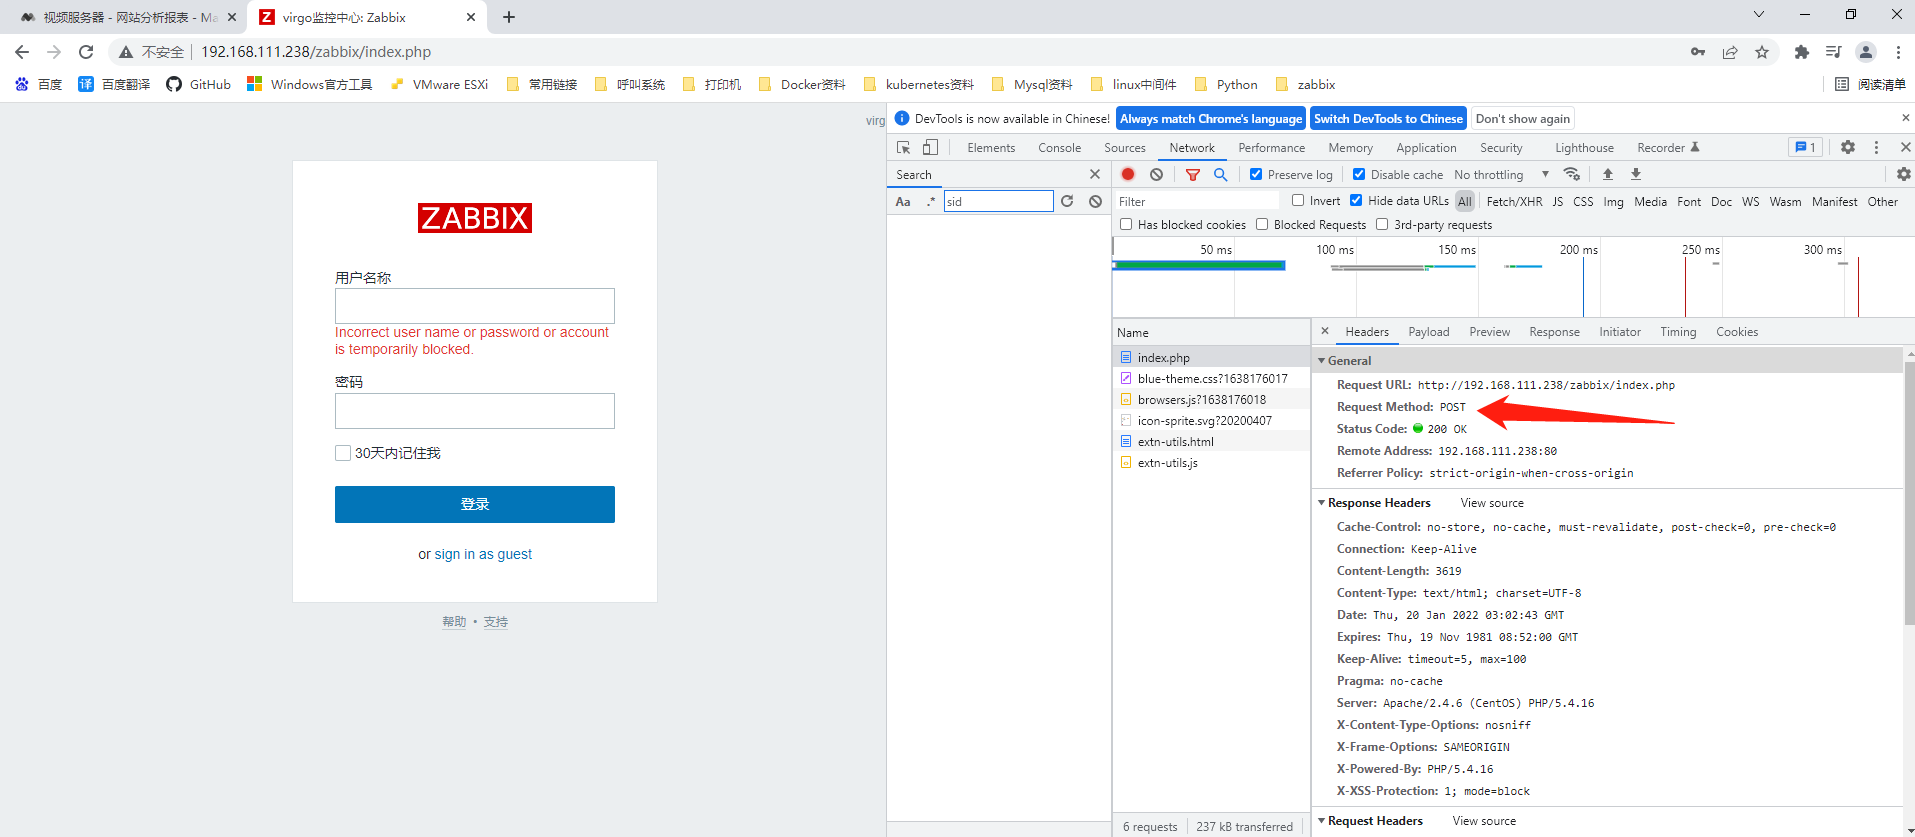
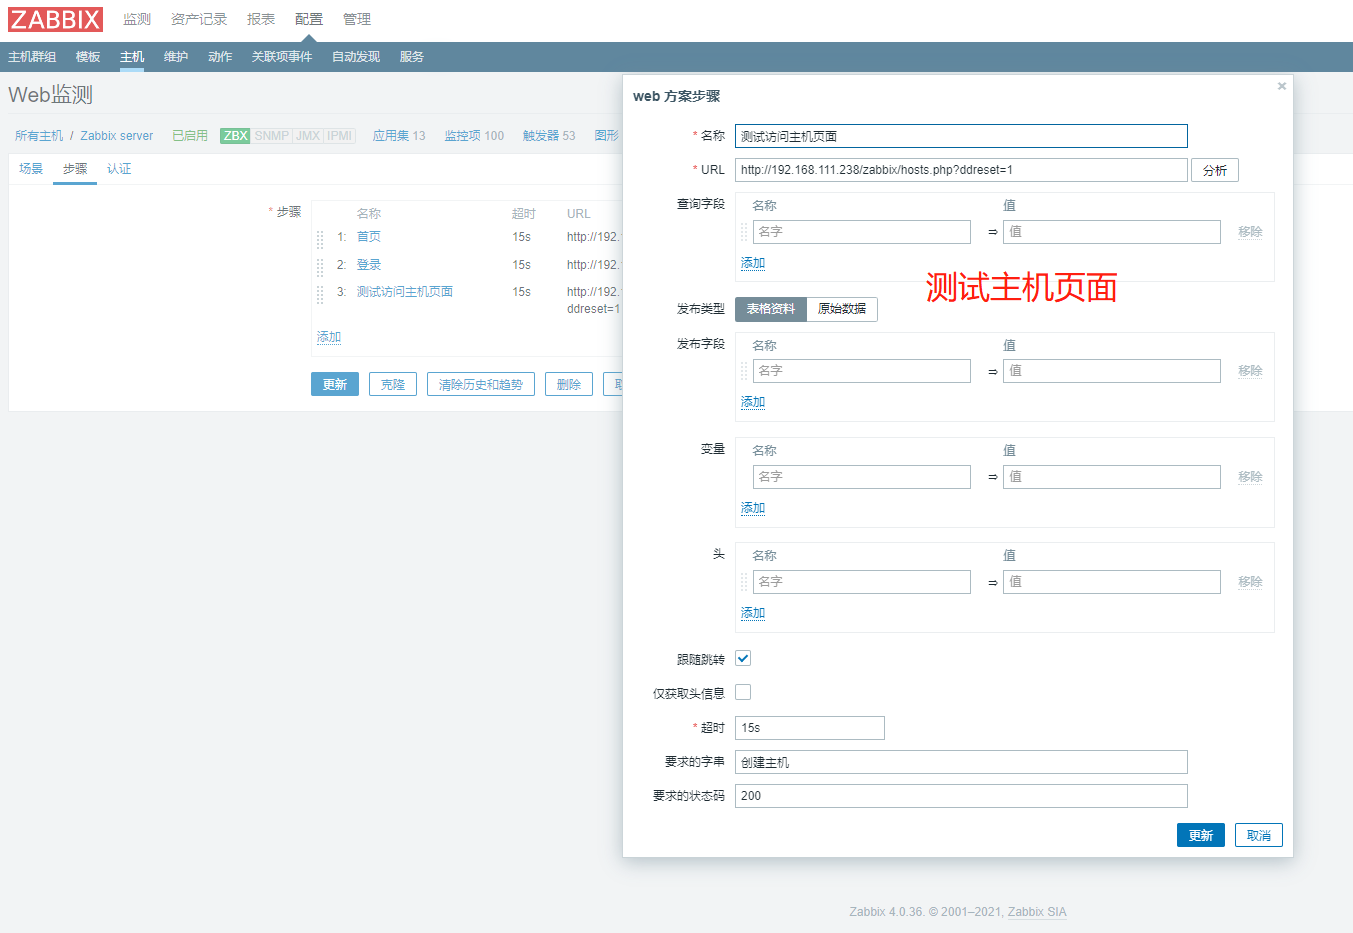
- 创建触发器
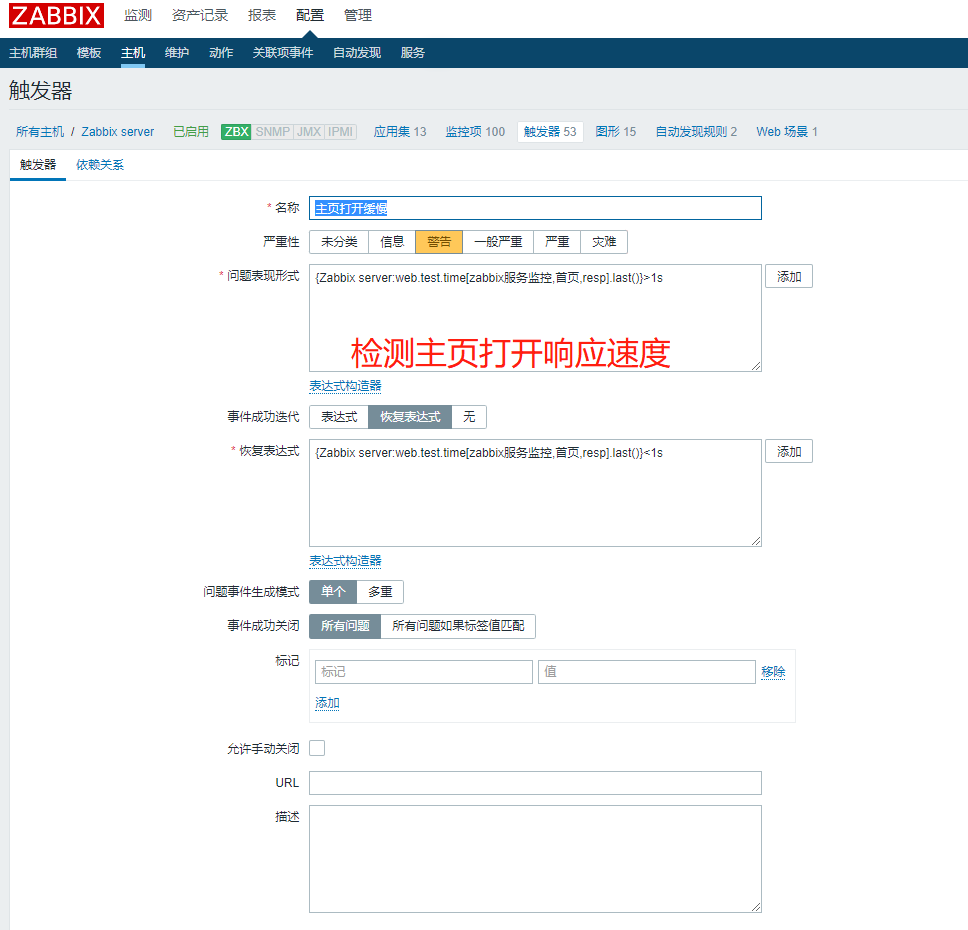
压测命令(可让页面打开缓慢)
ab -n 1000000 -c 20 http://192.168.111.238/zabbix/index.php
修改hosts.php文件即可测试
chmod 400 hosts.php            #该命令可触发报警
chmod 644 hosts.php            #恢复
23、使用percona插件监控mysql数据库
wget https://downloads.percona.com/downloads/percona-monitoring-plugins/percona-monitoring-plugins-1.1.8/binary/redhat/7/x86_64/percona-zabbix-templates-1.1.8-1.noarch.rpm
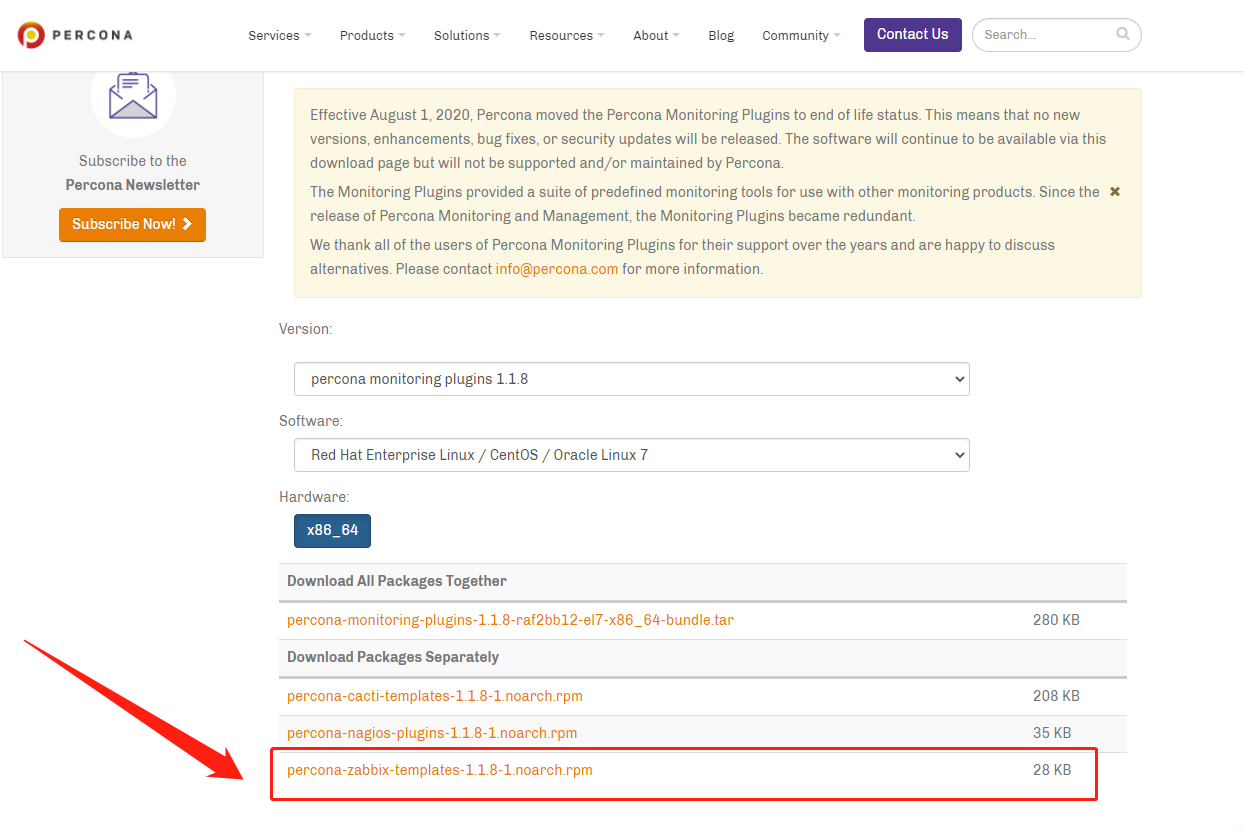
- 安装插件
rpm -ivh percona-zabbix-templates-1.1.8-1.noarch.rpm

------------------------------------------------------------------------------------
[root@zabbix software]# ls
grafana-8.3.3-1.x86_64.rpm    memtester-4.3.0.tar.gz                       zabbix-release-4.0-1.el7.noarch.rpm
jenkins-2.326-1.1.noarch.rpm  percona-zabbix-templates-1.1.8-1.noarch.rpm
[root@zabbix software]# rpm -ivh percona-zabbix-templates-1.1.8-1.noarch.rpm
警告:percona-zabbix-templates-1.1.8-1.noarch.rpm: 头V4 DSA/SHA1 Signature, 密钥 ID cd2efd2a: NOKEY
准备中...                          ################################# [100%]
正在升级/安装...
   1:percona-zabbix-templates-1.1.8-1 ################################# [100%]

Scripts are installed to /var/lib/zabbix/percona/scripts          #脚本路径
Templates are installed to /var/lib/zabbix/percona/templates      #模板路径
[root@zabbix software]#
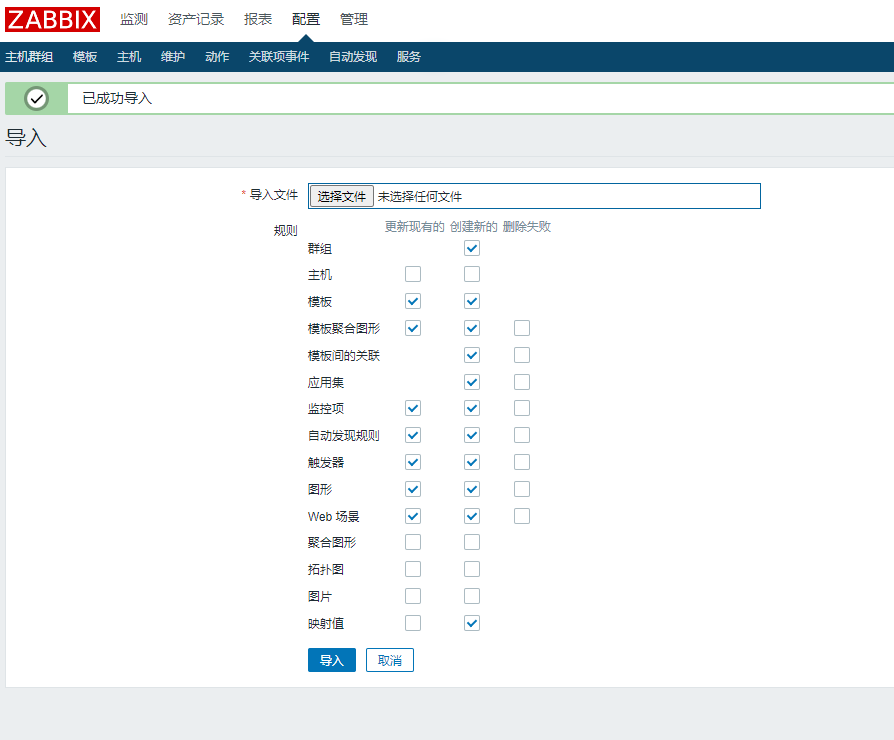
- 导入模板
cd /var/lib/zabbix/percona/templates

[root@zabbix templates]# ls
userparameter_percona_mysql.conf  zabbix_agent_template_percona_mysql_server_ht_2.0.9-sver1.1.8.xml

将xml文件下载出来并导入模板
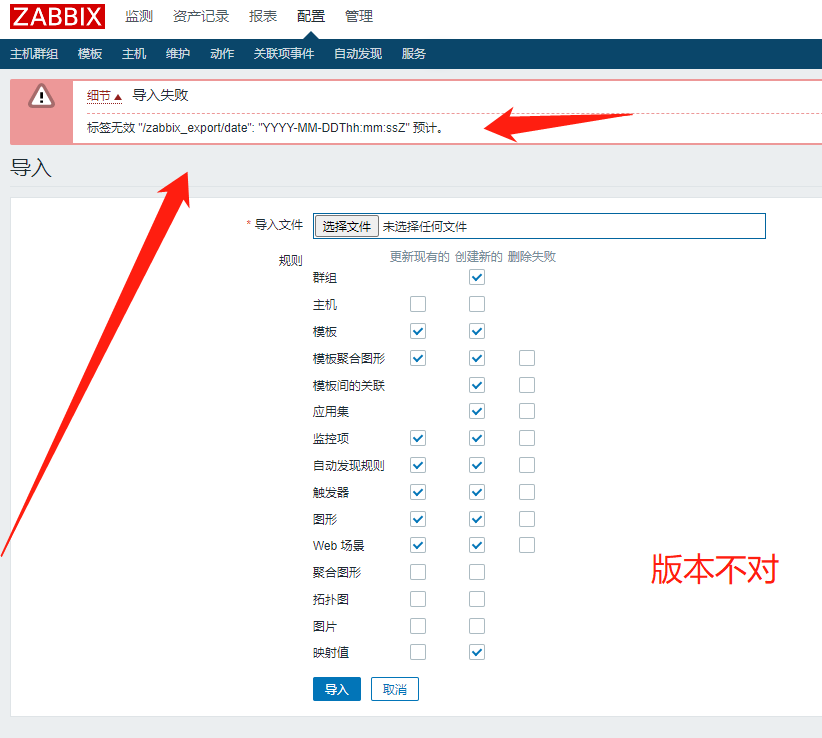
解决方法:参考文档
模板下载地址:http://pan.baidu.com/s/1pL1wDYj
- 将配置文件移动到zabbix_agentd.d目录下
[root@zabbix templates]# ls
userparameter_percona_mysql.conf  zabbix_agent_template_percona_mysql_server_ht_2.0.9-sver1.1.8.xml
[root@zabbix templates]# mv userparameter_percona_mysql.conf  /etc/zabbix/zabbix_agentd.d/
[root@zabbix templates]#

[root@zabbix zabbix_agentd.d]# ls
user_def.conf  userparameter_mysql.conf  userparameter_percona_mysql.conf
- 重启agent服务
systemctl restart zabbix-agent.service - 测试取值
[root@zabbix scripts]# zabbix_get -s 127.0.0.1 -k MySQL.Open-files

#空值  报错  排查!
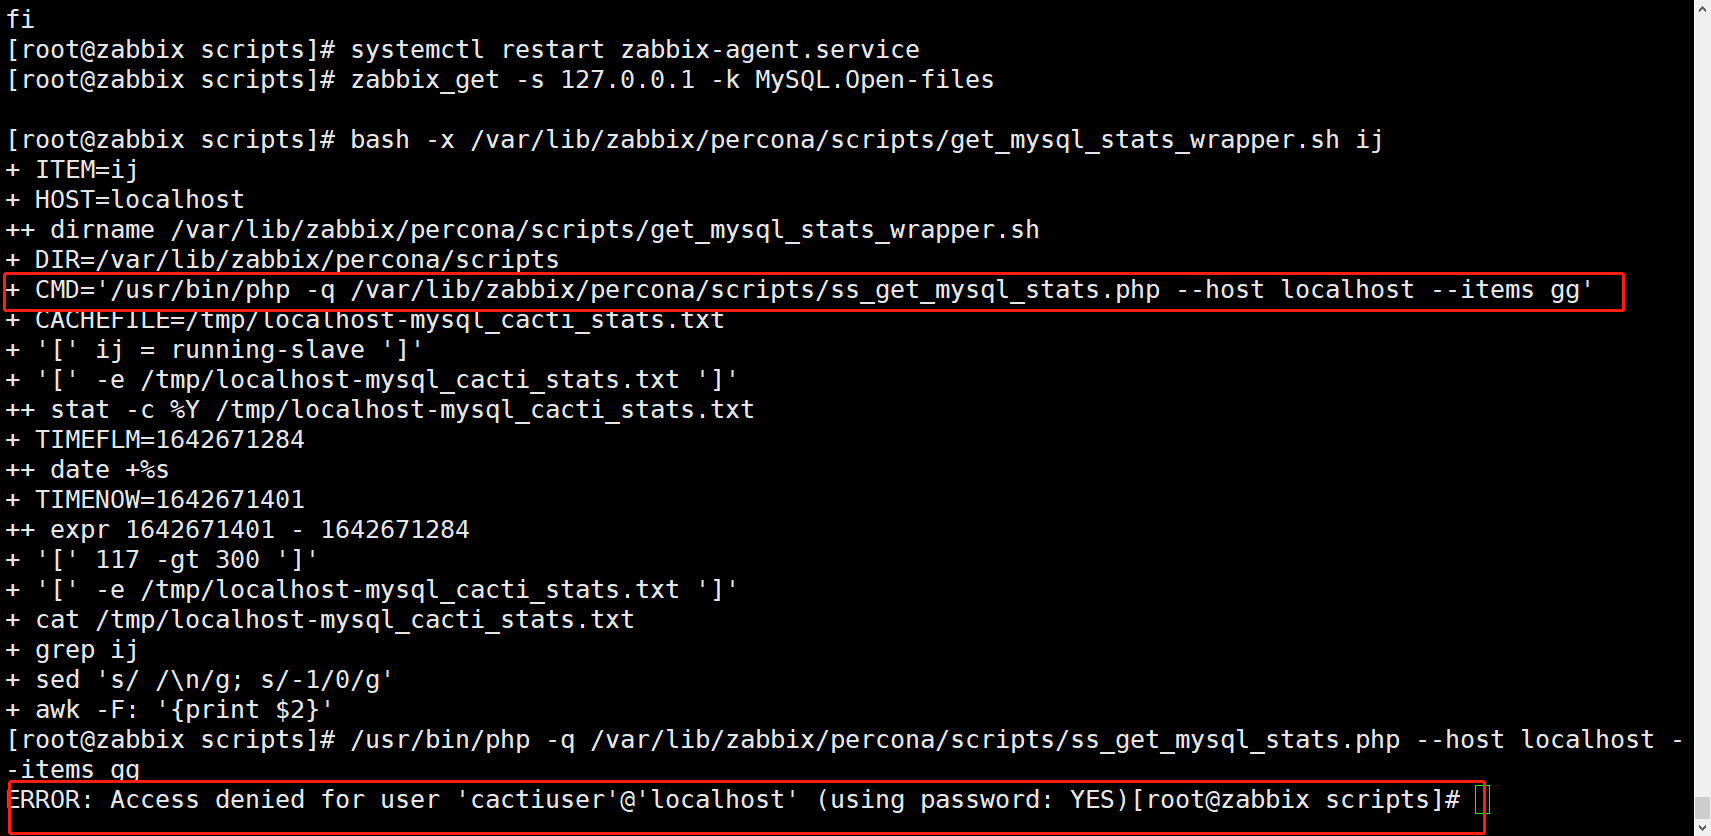
报错点:脚本默认使用了cactiuser用户连接数据库,将它修改成zabbix即可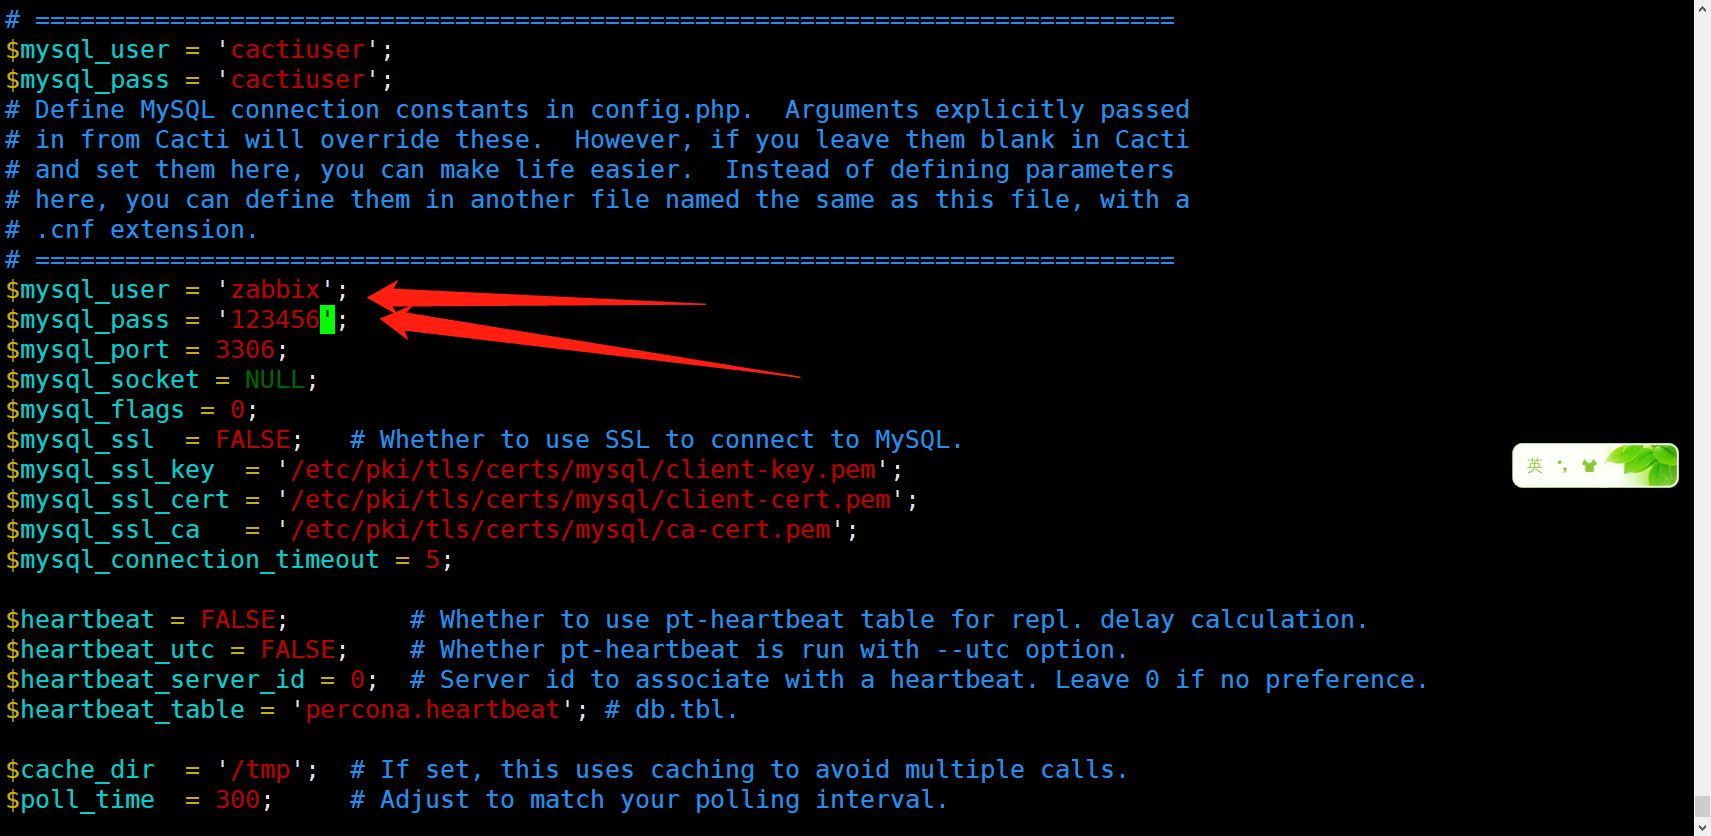
- 修改完成后重启agent服务再测试取值
[root@zabbix scripts]# systemctl restart zabbix-agent.service
[root@zabbix scripts]# zabbix_get -s 127.0.0.1 -k MySQL.Open-files
363
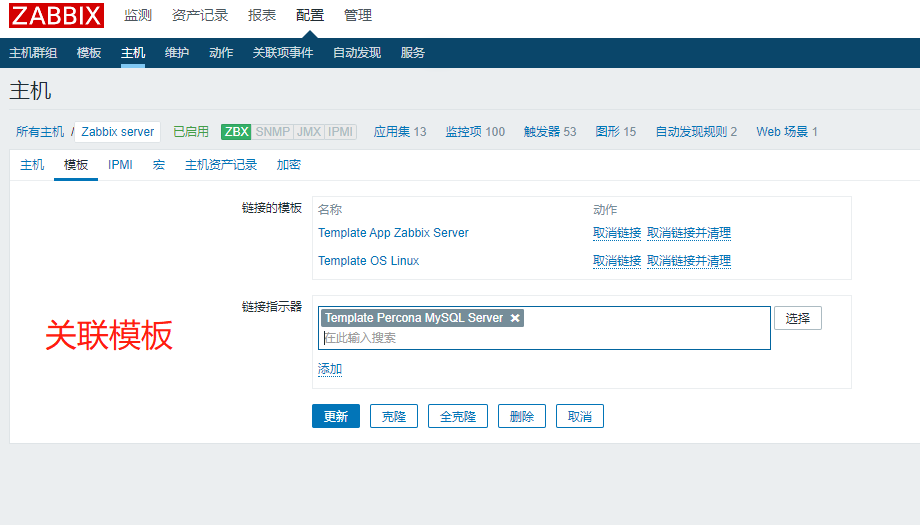
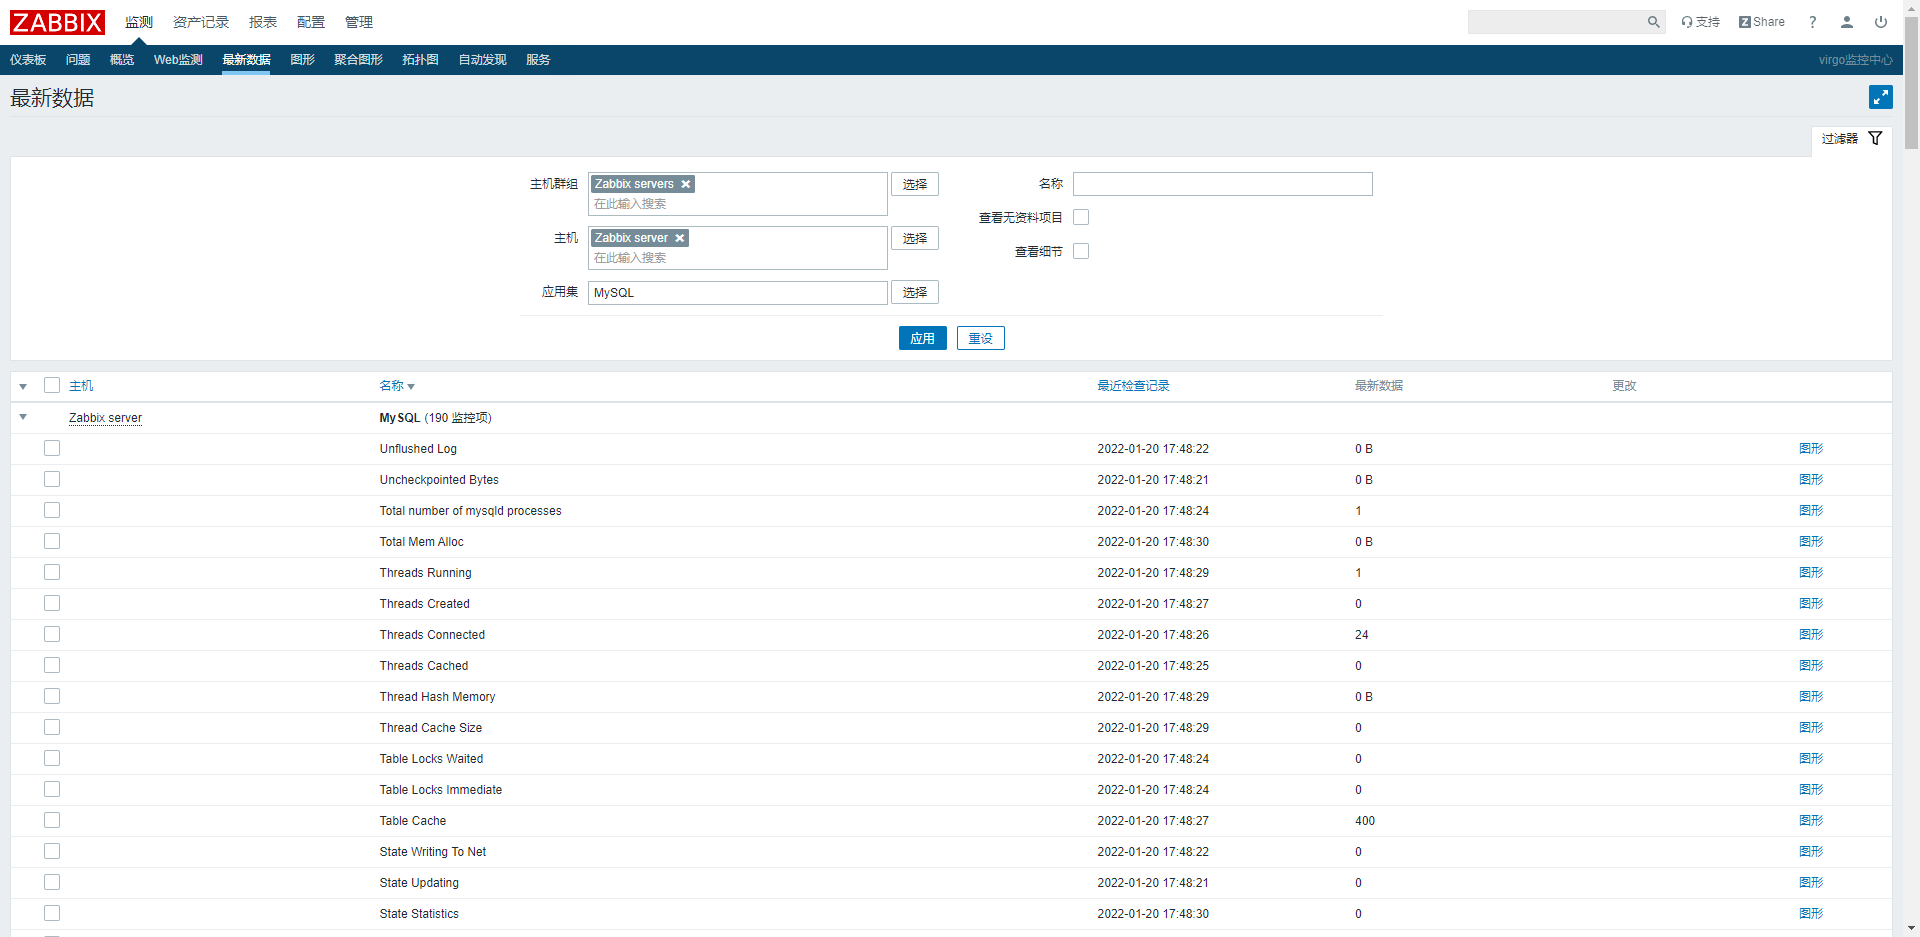
- weg界面查看是否能取到值
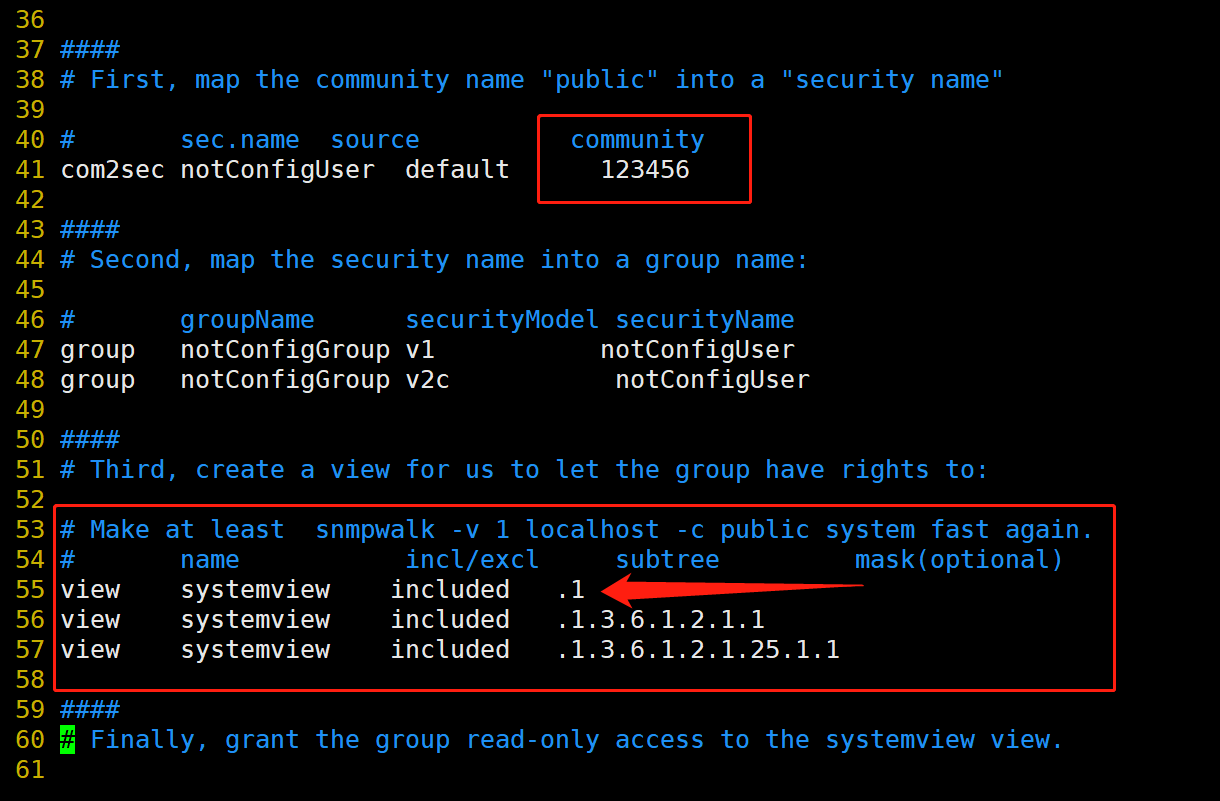
23、snmp监控Linux

snmp:简单网络管理协议(SNMP) 是专门设计用于在 IP 网络管理网络节点(服务器、工作站、路由器、交换机及HUBS等)的一种标准协议,它是一种应用层协议。
-
环境准备:
1、zabbix服务器 IP地址:192.168.111.238
2、linux系统主机 IP地址:192.168.111.68 -
安装服务端(192.168.111.68)
yum install net-snmp -y

vim /etc/snmp/snmpd.conf     #修改配置文件
-
启动服务
systemctl start snmpd && systemctl enable snmpd -
安装客户端(192.168.111.238)
yum install net-snmp-utils.x86_64 -y
- 测试取值
snmpwalk -v 2c -c 123456 (comunity密码) 服务器IP地址 .1.3.6.1.4.1.2021.11.11.0
[root@zabbix ~]# snmpwalk -v 2c -c 123456 192.168.111.68 .1.3.6.1.4.1.2021.11.11.0
UCD-SNMP-MIB::ssCpuIdle.0 = INTEGER: 99

[root@zabbix ~]# snmpwalk -v 2c -c 123456 192.168.111.68 .1.3.6.1.2.1.2.2.1.4
IF-MIB::ifMtu.1 = INTEGER: 65536
IF-MIB::ifMtu.2 = INTEGER: 1500
常用OID值:
https://blog.csdn.net/buster2014/article/details/46925633
https://www.cnblogs.com/aspx-net/p/3554044.html(备用)
24、自动发现添加监控主机
- web界面启用自动发现(配置→自动发现)
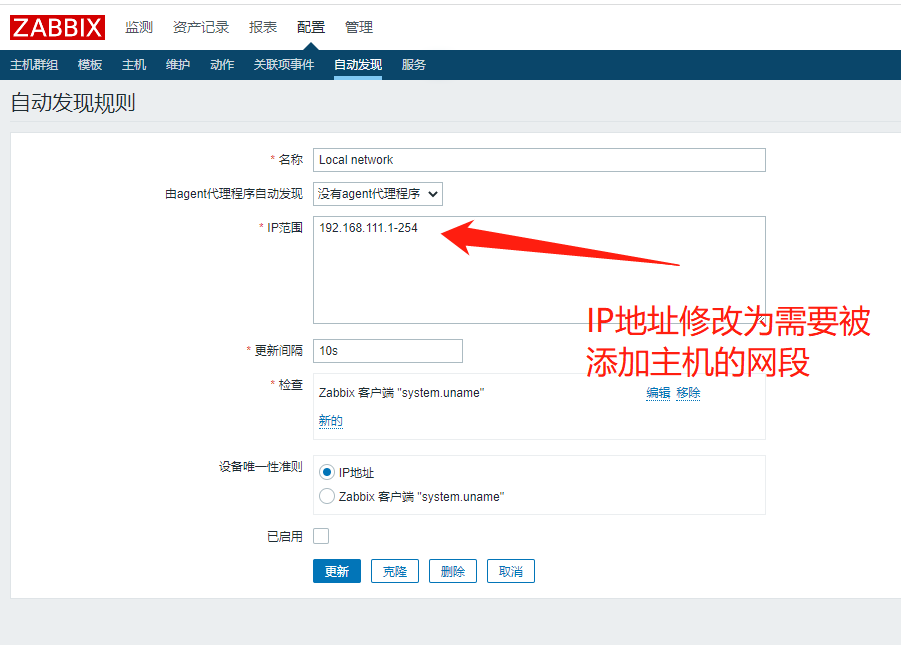
- 配置动作
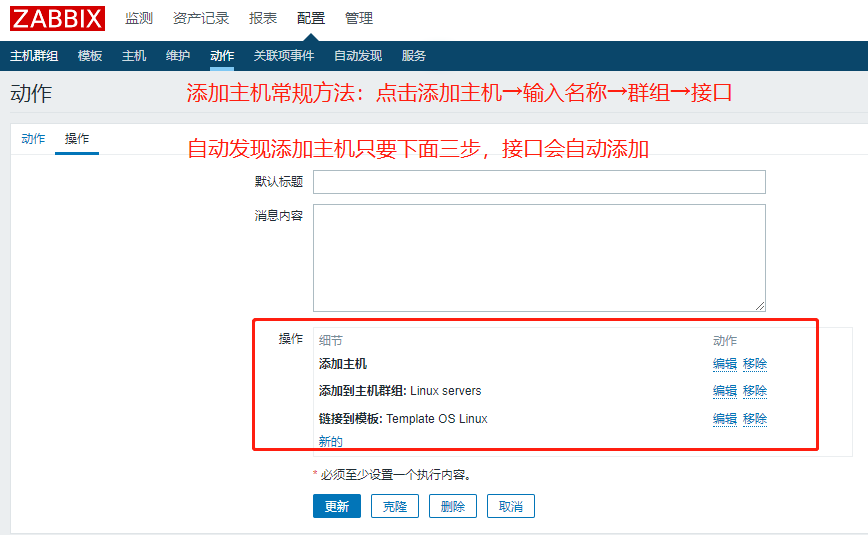
配置完成必须重装Zabbix Server
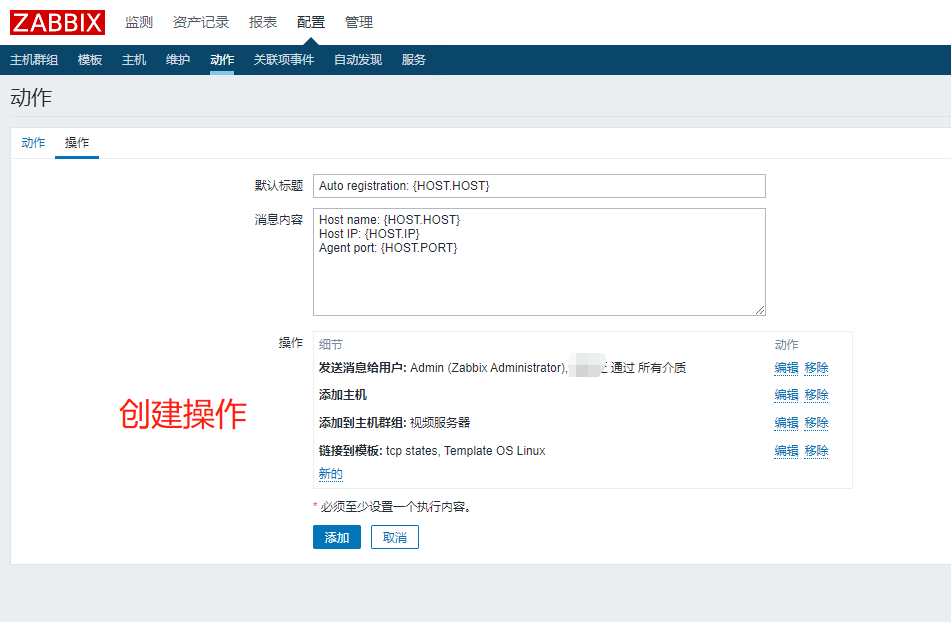
25、自动注册添加监控主机
- 配置web界面
配置→动作→事件源→自动注册→创建动作


- 修改需要被注册的主机配置文件
[root@localhost ~]# grep -Ev '^$|#' /etc/zabbix/zabbix_agentd.conf
PidFile=/var/run/zabbix/zabbix_agentd.pid
LogFile=/var/log/zabbix/zabbix_agentd.log
LogFileSize=0
Server=192.168.111.238                 #zabbix服务器地址
ServerActive=192.168.111.238           #zabbix服务器地址
Hostname=192.168.111.58                #主机名;需要唯一!所以用IP不会冲突
HostMetadata=web                       #作为筛选条件,需要与上面web界面的一致(名字自定义)
host metadata是zabbix2.2新增加的功能,该功能在zabbix-agent端可以自定义条件,在选择自动注册的时候,zabbix-server端可以根据host metadata来选择条件,从而实现更多的条件筛选。
通俗理解:如果是web那么我们就知道给它套上nginx、php的模板,如果是db我们就知道给它套上数据库的模板,用它来作为筛选标识。
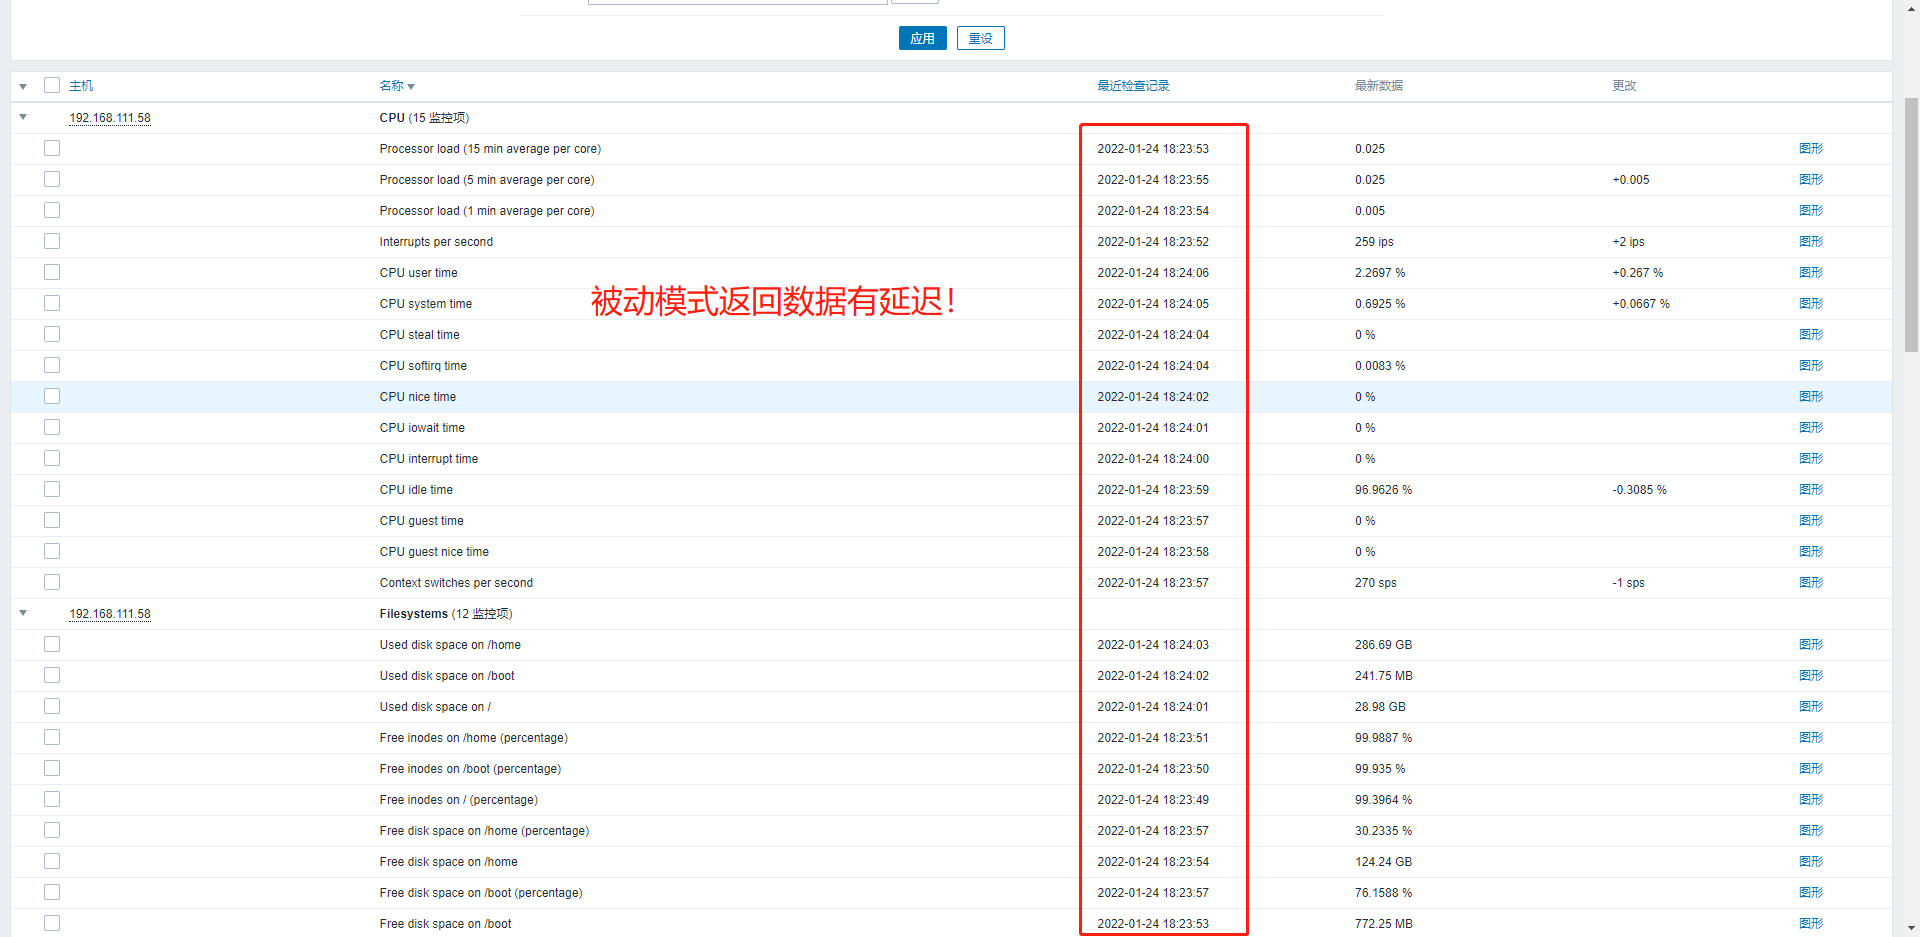
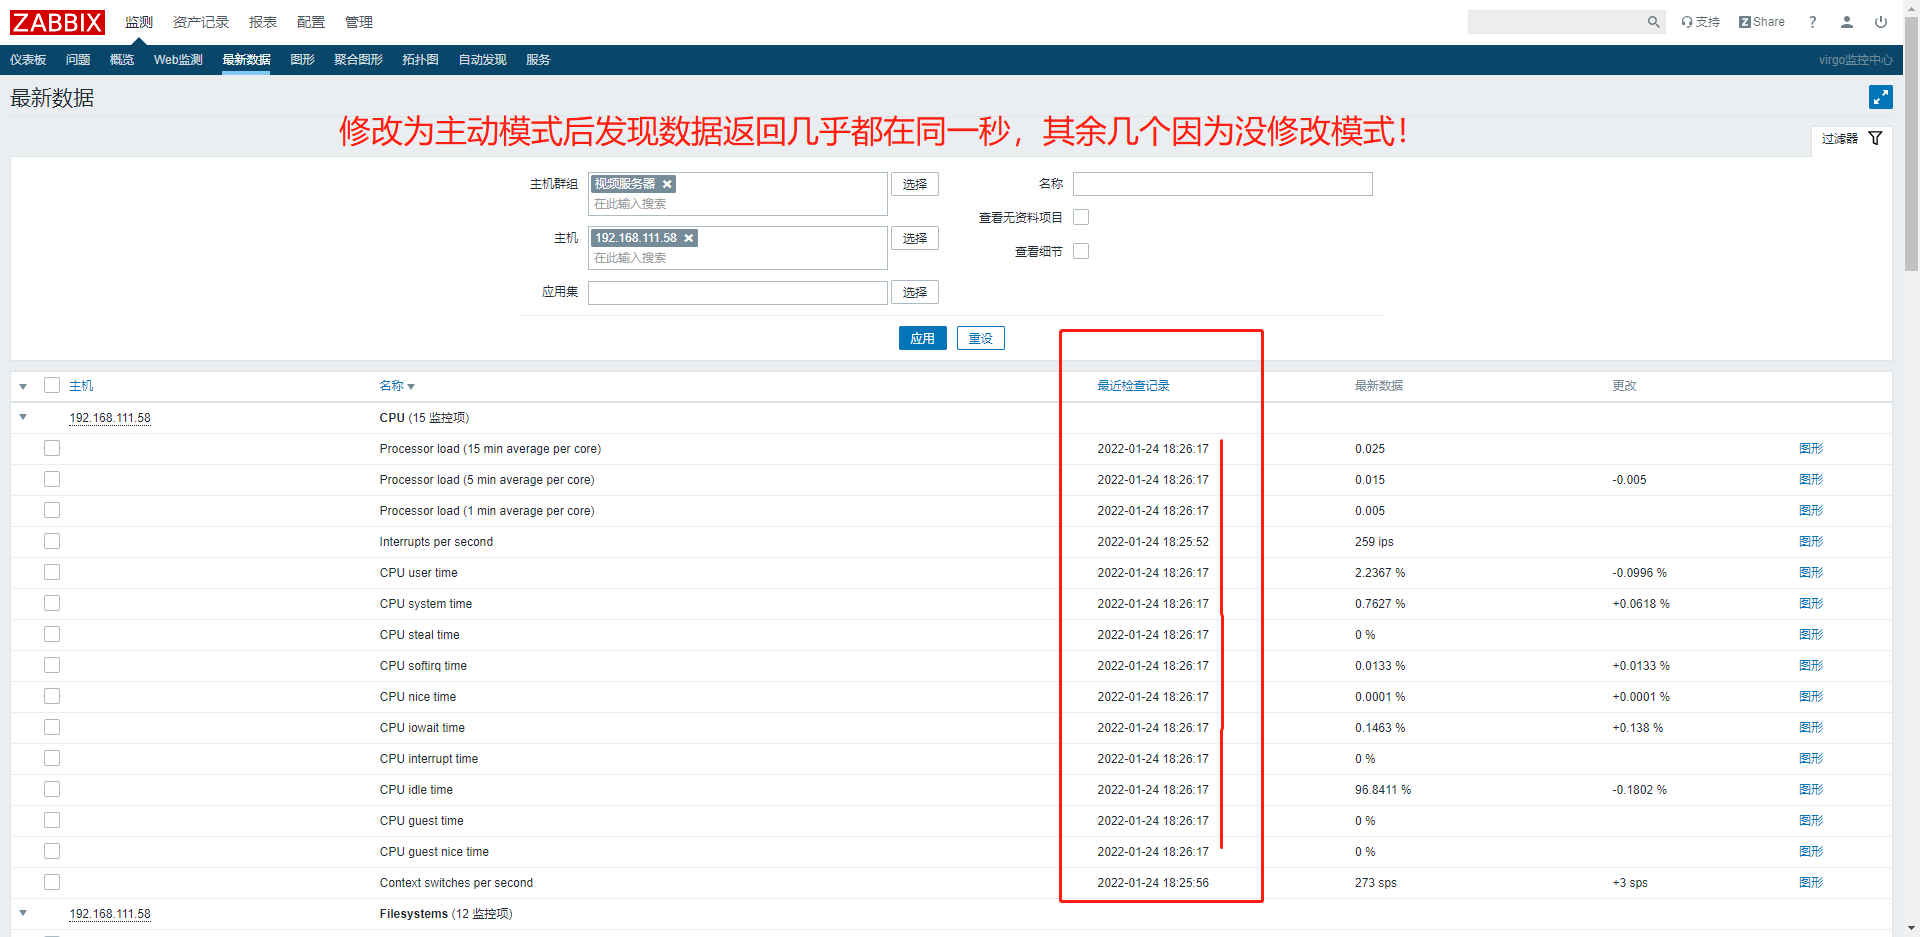
26、zabbix-agent主动模式和被动模式
- 创建主动模式模板
配置→模板→点击需要克隆的模板
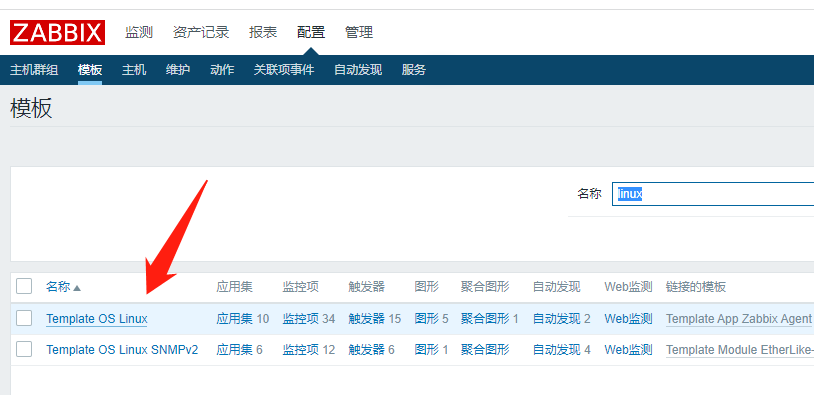
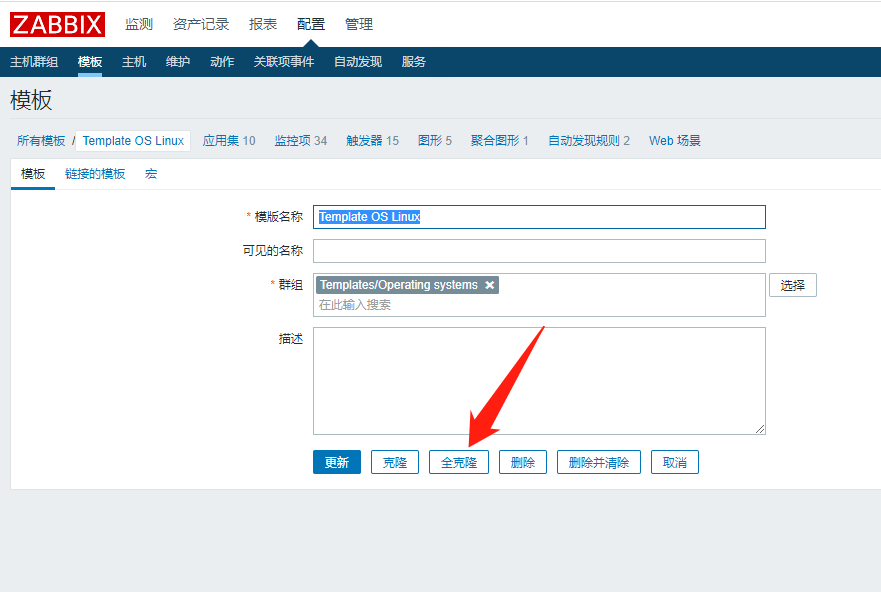
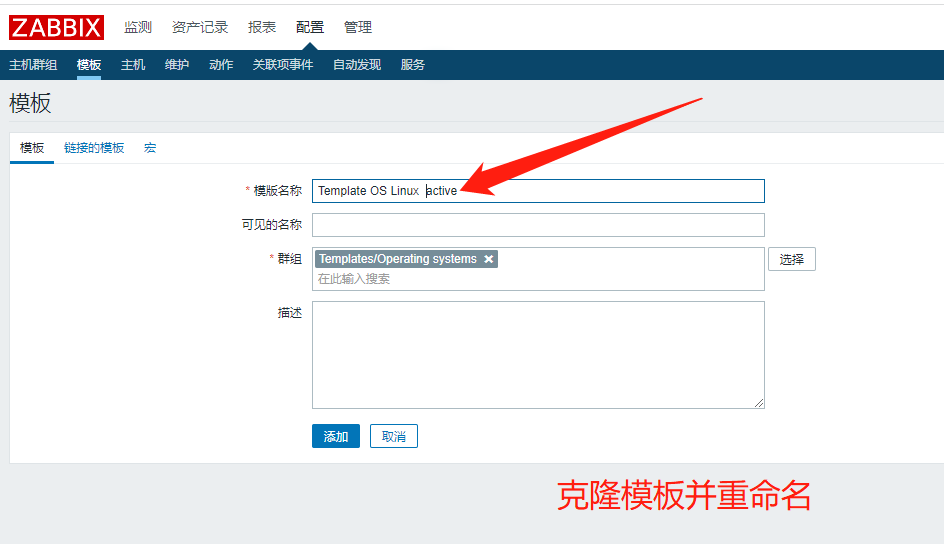
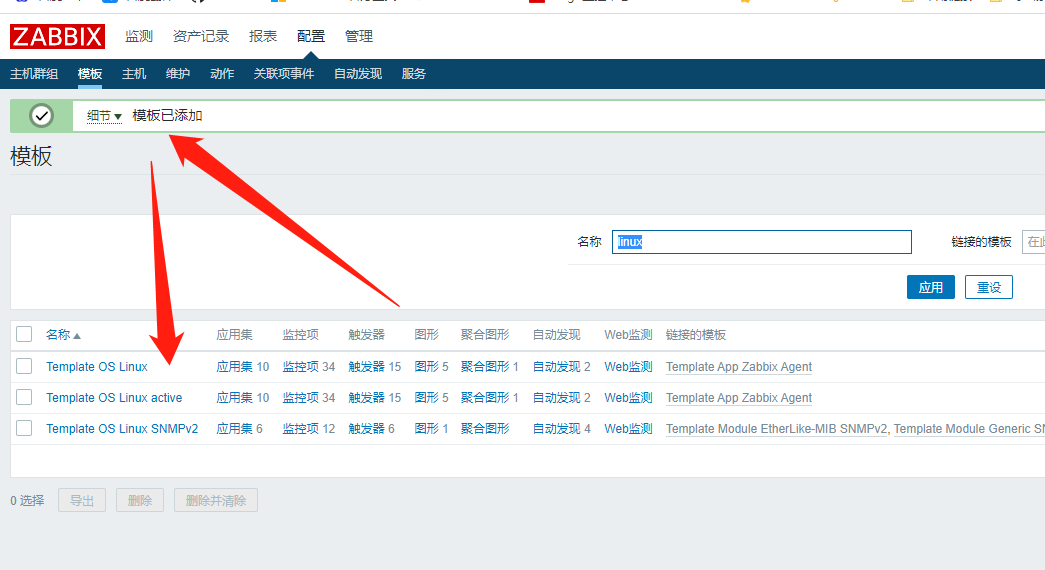
点击监控项→全选并批量修改为主动模式
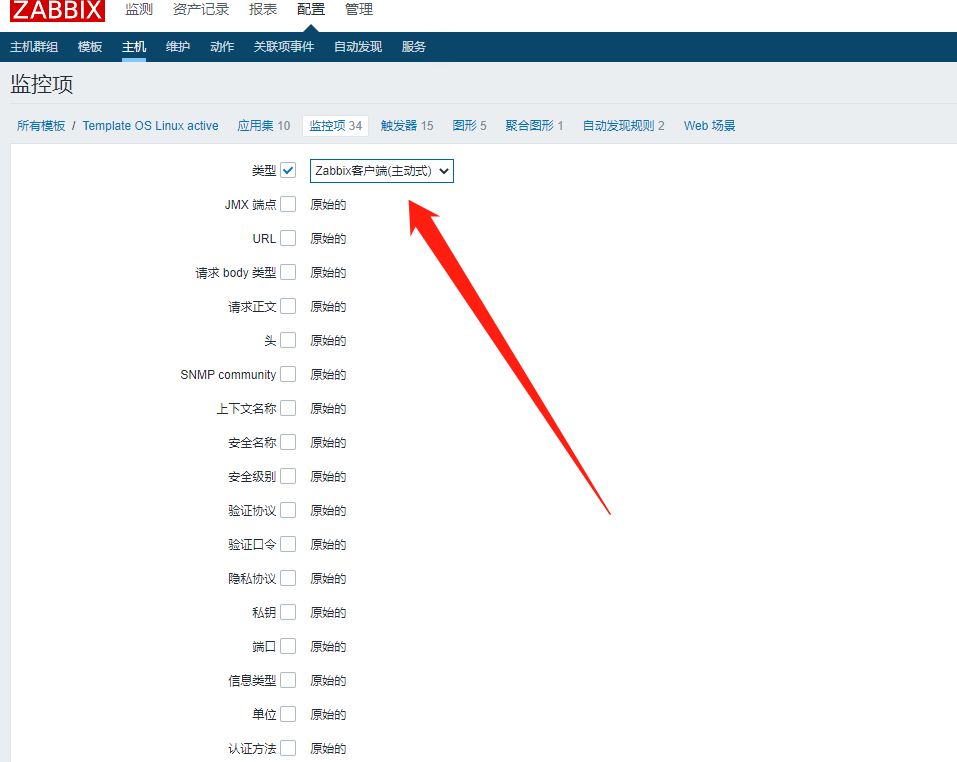
修改后发现有几个监控项并没更改,建议留下这几个;否则在主机界面查看图标是不会变绿,但是能正常取值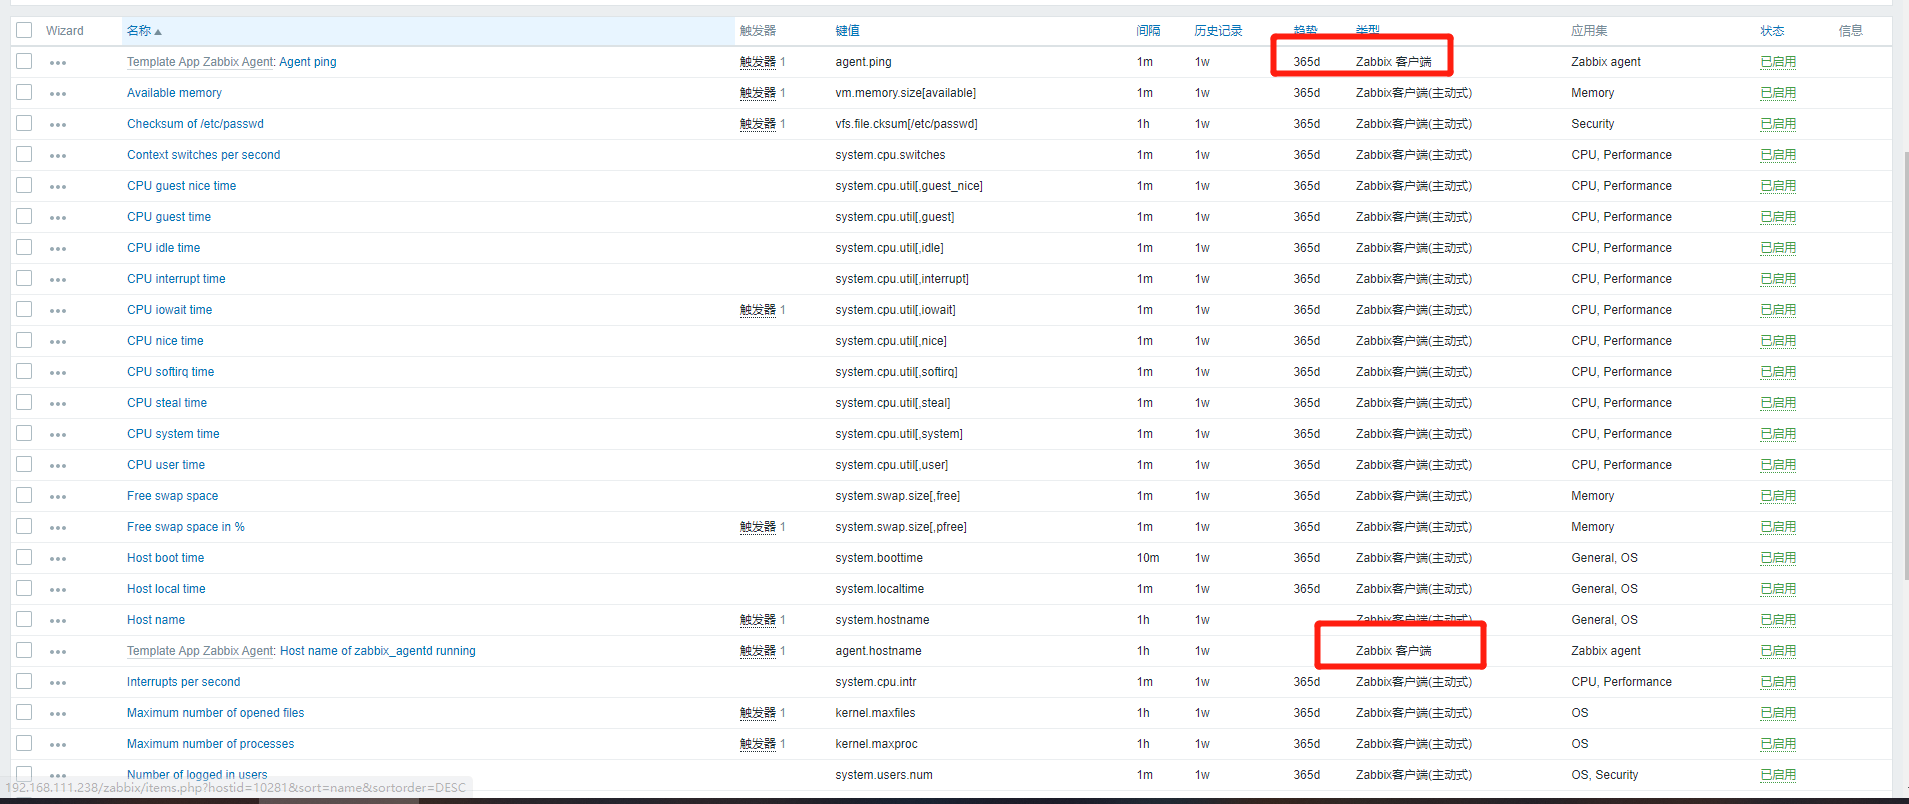
27、升级zabbix版本
测试环境:使用zabbix2.2
rpm -ivh https://mirrors.tuna.tsinghua.edu.cn/zabbix/zabbix/2.2/rhel/7/x86_64/zabbix-release-2.2-1.el7.noarch.rpm
修改zabbix的源
[zabbix]
name=Zabbix Official Repository - $basearch
baseurl=https://mirrors.tuna.tsinghua.edu.cn/zabbix//zabbix/2.2/rhel/7/$basearch/
enabled=1
gpgcheck=1
gpgkey=file:///etc/pki/rpm-gpg/RPM-GPG-KEY-ZABBIX

[zabbix-non-supported]
name=Zabbix Official Repository non-supported - $basearch
baseurl=https://mirrors.tuna.tsinghua.edu.cn/zabbix//non-supported/rhel/7/$basearch/
enabled=1
gpgkey=file:///etc/pki/rpm-gpg/RPM-GPG-KEY-ZABBIX
gpgcheck=1
安装依赖
yum install zabbix-server-mysql zabbix-web-mysql -y
安装数据库 (不加server装的是客户端)
yum install mariadb-server.x86_64 -y
启动数据库
systemctl start mariadb.service && systemctl enable mariadb.service
初始化数据库
mysql_secure_installation

第一个回车
第二个n
后面全部y
配置数据库
MariaDB [(none)]> create database zabbix default charset utf8;
Query OK, 1 row affected (0.00 sec)

MariaDB [(none)]> grant all on zabbix.* to zabbix@localhost identified by '123456';
Query OK, 0 rows affected (0.00 sec)

MariaDB [(none)]>
查看mysql数据
[root@localhost ~]# rpm -ql zabbix-server-mysql
/usr/sbin/zabbix_server_mysql
/usr/share/doc/zabbix-server-mysql-2.2.23
/usr/share/doc/zabbix-server-mysql-2.2.23/create       #数据存放在该目录下
/usr/share/doc/zabbix-server-mysql-2.2.23/create/data.sql
/usr/share/doc/zabbix-server-mysql-2.2.23/create/images.sql
/usr/share/doc/zabbix-server-mysql-2.2.23/create/schema.sql
/usr/share/doc/zabbix-server-mysql-2.2.23/upgrades
/usr/share/doc/zabbix-server-mysql-2.2.23/upgrades/dbpatches
/usr/share/doc/zabbix-server-mysql-2.2.23/upgrades/dbpatches/1.6
/usr/share/doc/zabbix-server-mysql-2.2.23/upgrades/dbpatches/1.6/mysql
/usr/share/doc/zabbix-server-mysql-2.2.23/upgrades/dbpatches/1.6/mysql/patch.sql
/usr/share/doc/zabbix-server-mysql-2.2.23/upgrades/dbpatches/1.8
/usr/share/doc/zabbix-server-mysql-2.2.23/upgrades/dbpatches/1.8/mysql
/usr/share/doc/zabbix-server-mysql-2.2.23/upgrades/dbpatches/1.8/mysql/patch.sql
/usr/share/doc/zabbix-server-mysql-2.2.23/upgrades/dbpatches/1.8/mysql/upgrade
/usr/share/doc/zabbix-server-mysql-2.2.23/upgrades/dbpatches/2.0
/usr/share/doc/zabbix-server-mysql-2.2.23/upgrades/dbpatches/2.0/mysql
/usr/share/doc/zabbix-server-mysql-2.2.23/upgrades/dbpatches/2.0/mysql/patch.sql
/usr/share/doc/zabbix-server-mysql-2.2.23/upgrades/dbpatches/2.0/mysql/rc4_rc5.sql
/usr/share/doc/zabbix-server-mysql-2.2.23/upgrades/dbpatches/2.0/mysql/upgrade
导入数据
[root@localhost ~]# cd /usr/share/doc/zabbix-server-mysql-2.2.23/create
[root@localhost create]# ls
data.sql  images.sql  schema.sql
[root@localhost create]# mysql -uzabbix -p123456 zabbix <schema.sql
[root@localhost create]# mysql -uzabbix -p123456 zabbix <images.sql
[root@localhost create]# mysql -uzabbix -p123456 zabbix <data.sql
修改配置文件
vim /etc/zabbix/zabbix_server.conf

DBUser=zabbix
DBName=zabbix
DBPassword=123456                   #重点修改这三项
启动zabbix服务
systemctl start zabbix-server.service
检查10051端口是否启动
[root@localhost ~]# netstat -lntup
Active Internet connections (only servers)
Proto Recv-Q Send-Q Local Address           Foreign Address         State       PID/Program name
tcp        0      0 0.0.0.0:10051           0.0.0.0:*               LISTEN      32063/zabbix_server
tcp        0      0 0.0.0.0:3306            0.0.0.0:*               LISTEN      20254/mysqld
tcp        0      0 0.0.0.0:22              0.0.0.0:*               LISTEN      1224/sshd
tcp6       0      0 :::10051                :::*                    LISTEN      32063/zabbix_server
tcp6       0      0 :::22                   :::*                    LISTEN      1224/sshd
udp        0      0 0.0.0.0:68              0.0.0.0:*                           30494/dhclient
udp        0      0 127.0.0.1:323           0.0.0.0:*                           813/chronyd
udp6       0      0 ::1:323                 :::*                                813/chronyd
修改时区vim /etc/httpd/conf.d/zabbix.conf
重启服务systemctl restart httpd.service
安装服务:浏览器访问IP/zabbix
报错:zabbix server is not running:the information displayed may not be current
解决:setenforce 0(临时使用)
升级版本
rpm -e zabbix-release       #卸载旧包

wget http://repo.zabbix.com/zabbix/4.0/rhel/7/x86_64/zabbix-release-4.0-1.el7.noarch.rpm  #下载新包

rpm -ivh zabbix-release-4.0-1.el7.noarch.rpm     #安装

yum install zabbix-server-mysql zabbix-web-mysql -y   #安装服务
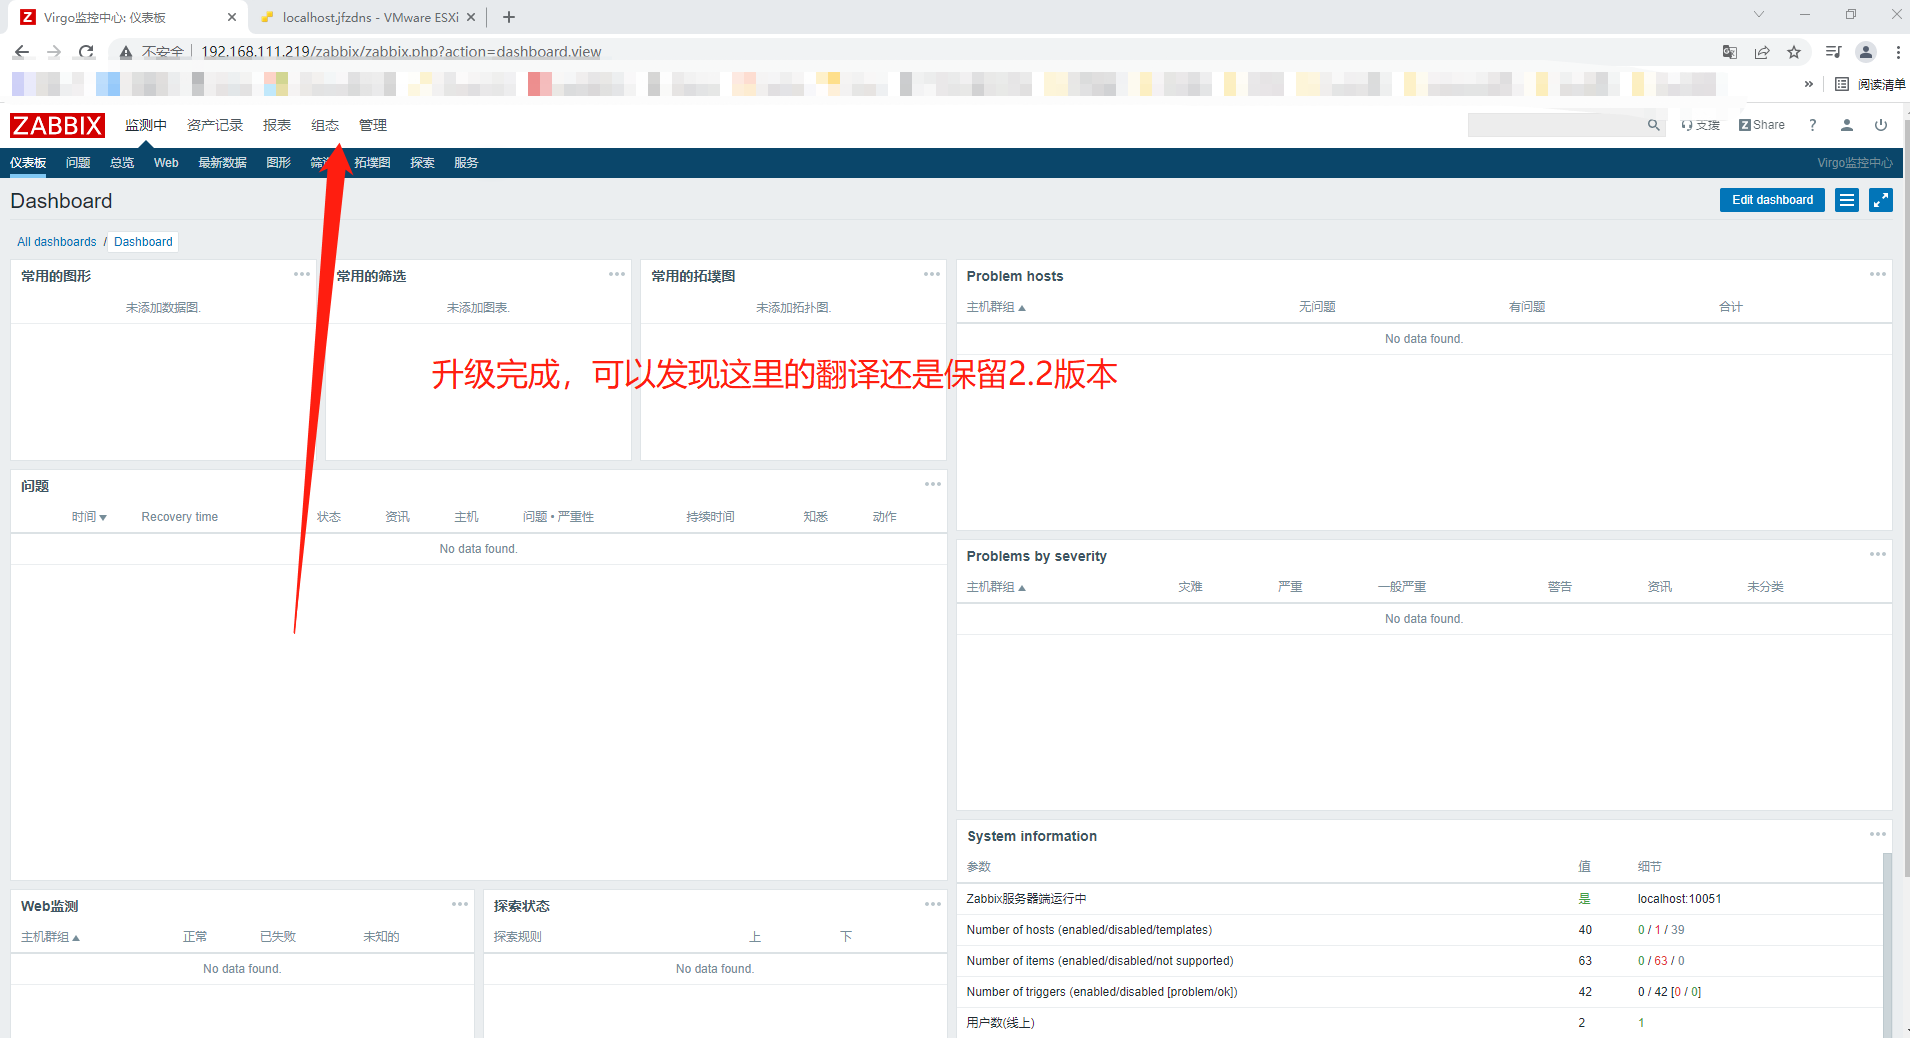
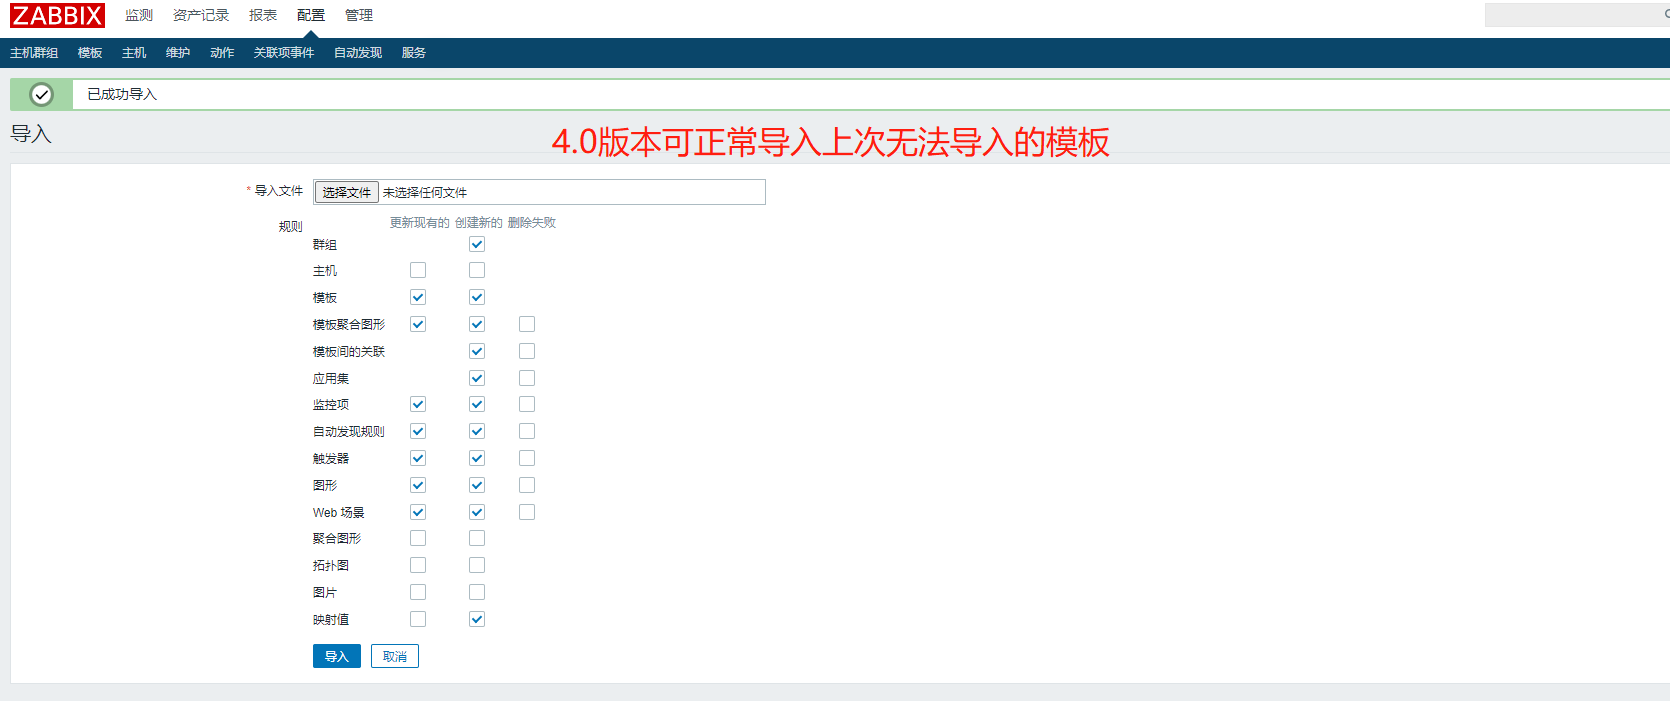
解决上面遗留的问题:模板不兼容,安装一个低版本的zabbix将模板导入然后再将zabbix升级,升级后再导出模板即可
28、安装zabbix-proxy服务

环境:需要准备三台服务器,1个zabbix-server,1个zabbix-proxy,1个zabbix-agent
安装zabbix-proxy服务
https://mirrors.tuna.tsinghua.edu.cn/zabbix/zabbix/4.0/rhel/7/x86_64/zabbix-release-4.0-1.el7.noarch.rpm
修改zabbix的源
vim /etc/yum.repos.d/zabbix.repo

:%s#http://repo.zabbix.com/#https://mirrors.tuna.tsinghua.edu.cn/zabbix/#g
安装数据库
yum install zabbix-proxy-mysql -y

yum install mariadb-server.x86_64 -y
启动数据库
systemctl start mariadb.service && systemctl enable mariadb.service
初始化数据库
mysql_secure_installation

第一个回车
第二个n
后面全部y
配置数据库
MariaDB [(none)]> create database zabbix_proxy default charset utf8;
Query OK, 1 row affected (0.00 sec)

MariaDB [(none)]> grant all on zabbix_proxy.* to zabbix@localhost identified by '123456';
Query OK, 0 rows affected (0.00 sec)
导入数据
[root@gz-proxy ~]# zcat /usr/share/doc/zabbix-proxy-mysql-4.0.37/schema.sql.gz |mysql -uzabbix -p123456 zabbix_proxy
[root@gz-proxy ~]# echo $?
0
修改zabbix-proxy配置文件
vim /etc/zabbix/zabbix_proxy.conf
DBPassword=123456 #数据库密码
Server=192.168.111.238 #指向zabbix-server服务器地址
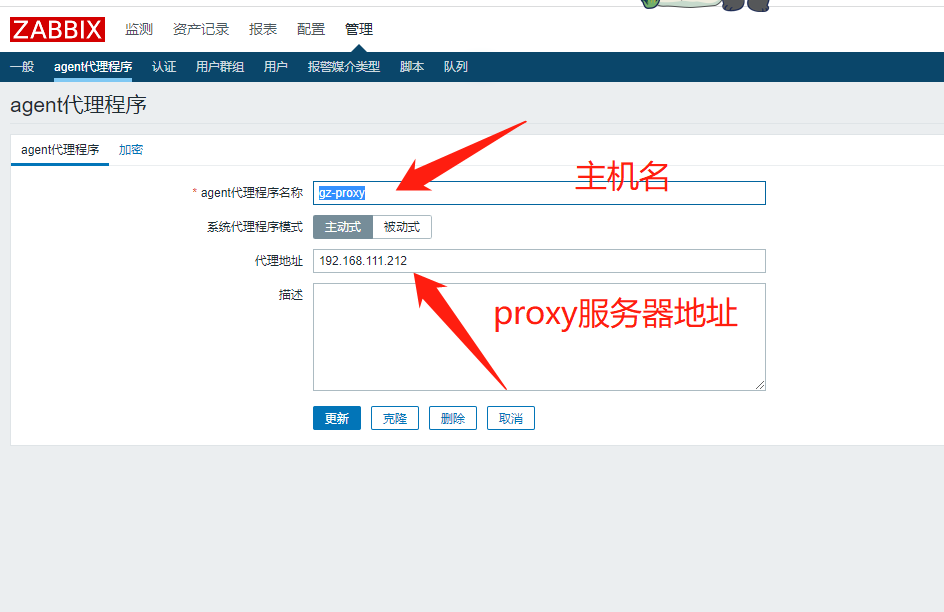
Hostname=gz-proxy #属地的proxy名字,用于辨识该服务器属于哪里
启动服务
systemctl start zabbix-proxy.service && systemctl enable zabbix-proxy.service
到web界面添加zabbix-proxy
管理→agent代理程序→创建代理
如果发现报错可查看日志
tail -f /var/log/zabbix/zabbix_server.log
tail -f /var/log/zabbix/zabbix_proxy.log
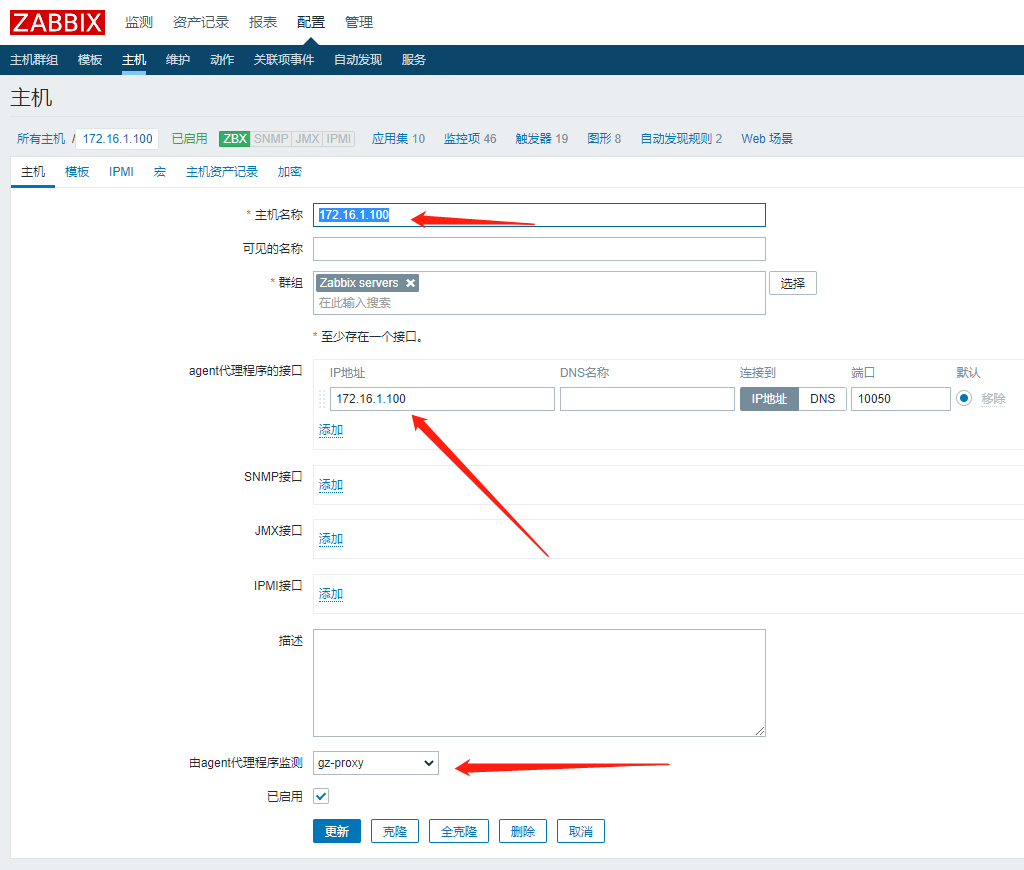
29、使用zabbix-proxy添加一台主机
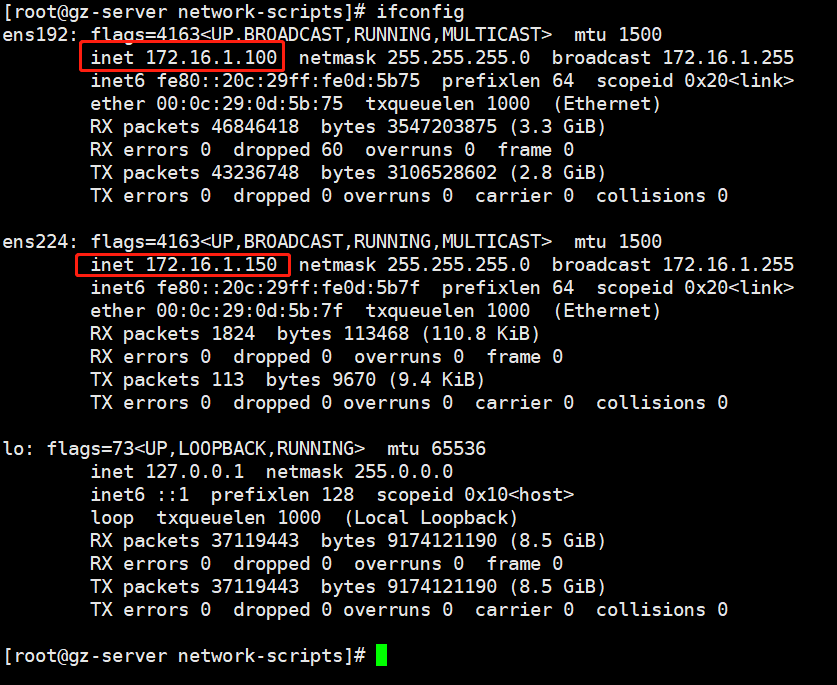
准备环境:一台安装有zabbix_agent的服务器,并且网卡地址需要改为与proxy内网一致
修改IP
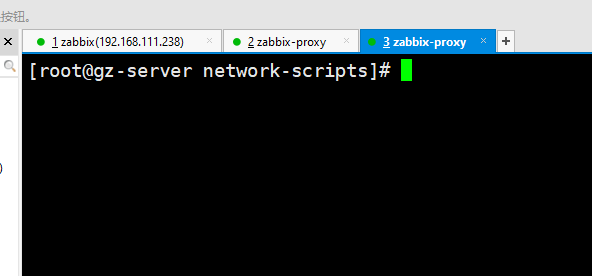
[root@gz-server ~]# cd /etc/sysconfig/network-scripts/
[root@gz-server network-scripts]# ls
ifcfg-ens192  ifdown-eth   ifdown-post    ifdown-Team      ifup-aliases  ifup-ipv6   ifup-post    ifup-Team      init.ipv6-global
ifcfg-lo      ifdown-ippp  ifdown-ppp     ifdown-TeamPort  ifup-bnep     ifup-isdn   ifup-ppp     ifup-TeamPort  network-functions
ifdown        ifdown-ipv6  ifdown-routes  ifdown-tunnel    ifup-eth      ifup-plip   ifup-routes  ifup-tunnel    network-functions-ipv6
ifdown-bnep   ifdown-isdn  ifdown-sit     ifup             ifup-ippp     ifup-plusb  ifup-sit     ifup-wireless

[root@gz-server network-scripts]# cat ifcfg-ens192
TYPE=Ethernet
BOOTPROTO=none
NAME=ens192
DEVICE=ens192
ONBOOT=yes
IPADDR=172.16.1.100                 #agent内网IP
NETMASK=255.255.255.0
proxy服务器新增一块网卡
[root@gz-proxy network-scripts]# ls
ifcfg-ens192  ifdown-bnep  ifdown-isdn    ifdown-sit       ifup          ifup-ippp  ifup-plusb   ifup-sit       ifup-wireless
ifcfg-ens224  ifdown-eth   ifdown-post    ifdown-Team      ifup-aliases  ifup-ipv6  ifup-post    ifup-Team      init.ipv6-global
ifcfg-lo      ifdown-ippp  ifdown-ppp     ifdown-TeamPort  ifup-bnep     ifup-isdn  ifup-ppp     ifup-TeamPort  network-functions
ifdown        ifdown-ipv6  ifdown-routes  ifdown-tunnel    ifup-eth      ifup-plip  ifup-routes  ifup-tunnel    network-functions-ipv6

[root@gz-proxy network-scripts]# cat ifcfg-ens224
TYPE=Ethernet
BOOTPROTO=none
NAME=ens224
DEVICE=ens224
ONBOOT=yes
IPADDR=172.16.1.101                 #proxy内网IP
NETMASK=255.255.255.0
测试proxy服务器与agent是否能ping通
[root@gz-server network-scripts]# ping 172.16.1.100
PING 172.16.1.100 (172.16.1.100) 56(84) bytes of data.
64 bytes from 172.16.1.100: icmp_seq=1 ttl=64 time=0.023 ms
64 bytes from 172.16.1.100: icmp_seq=2 ttl=64 time=0.032 ms
64 bytes from 172.16.1.100: icmp_seq=3 ttl=64 time=0.032 ms
64 bytes from 172.16.1.100: icmp_seq=4 ttl=64 time=0.031 ms
64 bytes from 172.16.1.100: icmp_seq=5 ttl=64 time=0.036 ms
64 bytes from 172.16.1.100: icmp_seq=6 ttl=64 time=0.038 ms
64 bytes from 172.16.1.100: icmp_seq=7 ttl=64 time=0.030 ms
64 bytes from 172.16.1.100: icmp_seq=8 ttl=64 time=0.034 ms
64 bytes from 172.16.1.100: icmp_seq=9 ttl=64 time=0.045 ms
^C
--- 172.16.1.100 ping statistics ---
9 packets transmitted, 9 received, 0% packet loss, time 7999ms
rtt min/avg/max/mdev = 0.023/0.033/0.045/0.007 ms
注:agent由于只有一块网卡,将IP改为内网后xshell会掉线,可以通过proxy服务器跳转过去
[root@gz-proxy network-scripts]# ssh root@172.16.1.100          #从proxy服务器跳转
The authenticity of host '172.16.1.100 (172.16.1.100)' can't be established.
ECDSA key fingerprint is SHA256:1rQLICUjwhlKEtpou/gE5B7GXPbM1vjl8Alm83O5prM.
ECDSA key fingerprint is MD5:6a:f4:7d:a2:d8:34:64:a3:4d:6d:bb:8c:d5:98:a2:c2.
Are you sure you want to continue connecting (yes/no)? yes
Warning: Permanently added '172.16.1.100' (ECDSA) to the list of known hosts.
root@172.16.1.100's password:
Last login: Wed Jan 26 10:38:46 2022 from 192.168.111.55

[root@gz-server ~]#               #发现用户名变为gz-server成功跳转过来
[root@gz-server ~]# ls
修改agent配置文件
vim /etc/zabbix/zabbix_agentd.conf

Server=172.16.1.101            #改为proxy内网IP
ServerActive=172.16.1.101     #改为proxy内网IP

Hostname=172.16.1.100         #主机名可用自身IP或其他字符,必须唯一!
保存后重启systemctl restart zabbix-agent.service
web界面添加主机
检查最新数据是否能获取
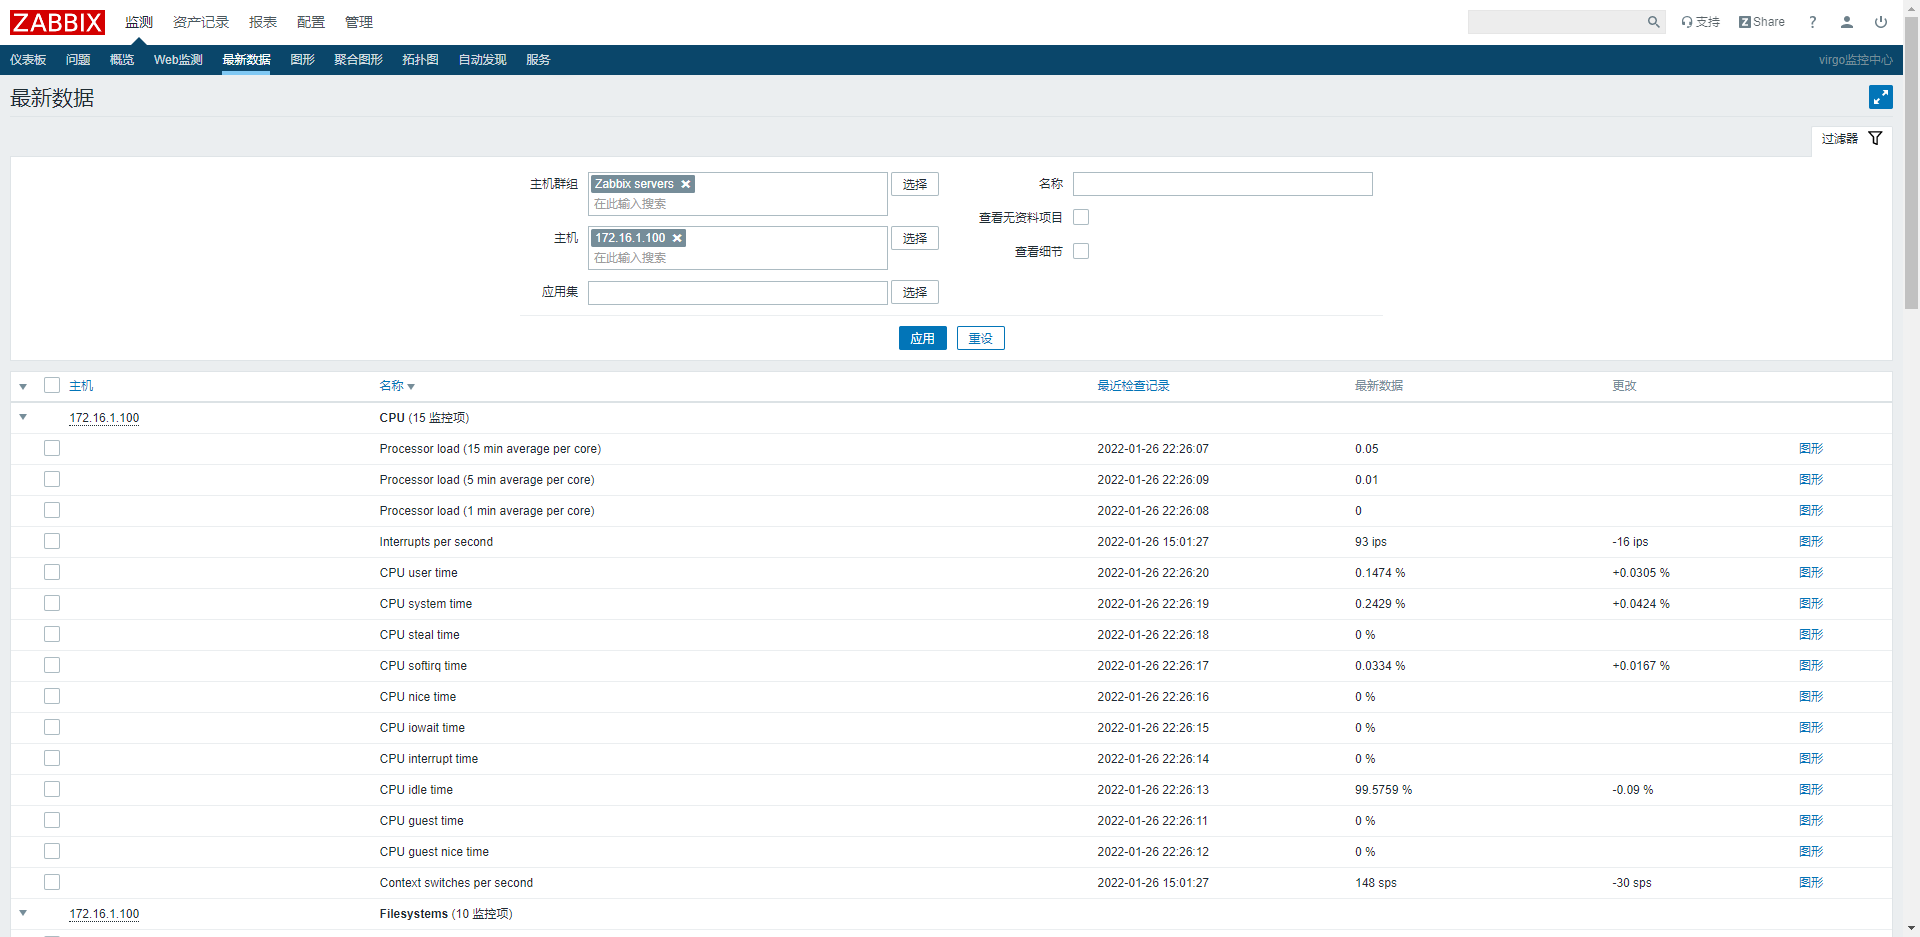
遇到的问题:最新数据时间不同步
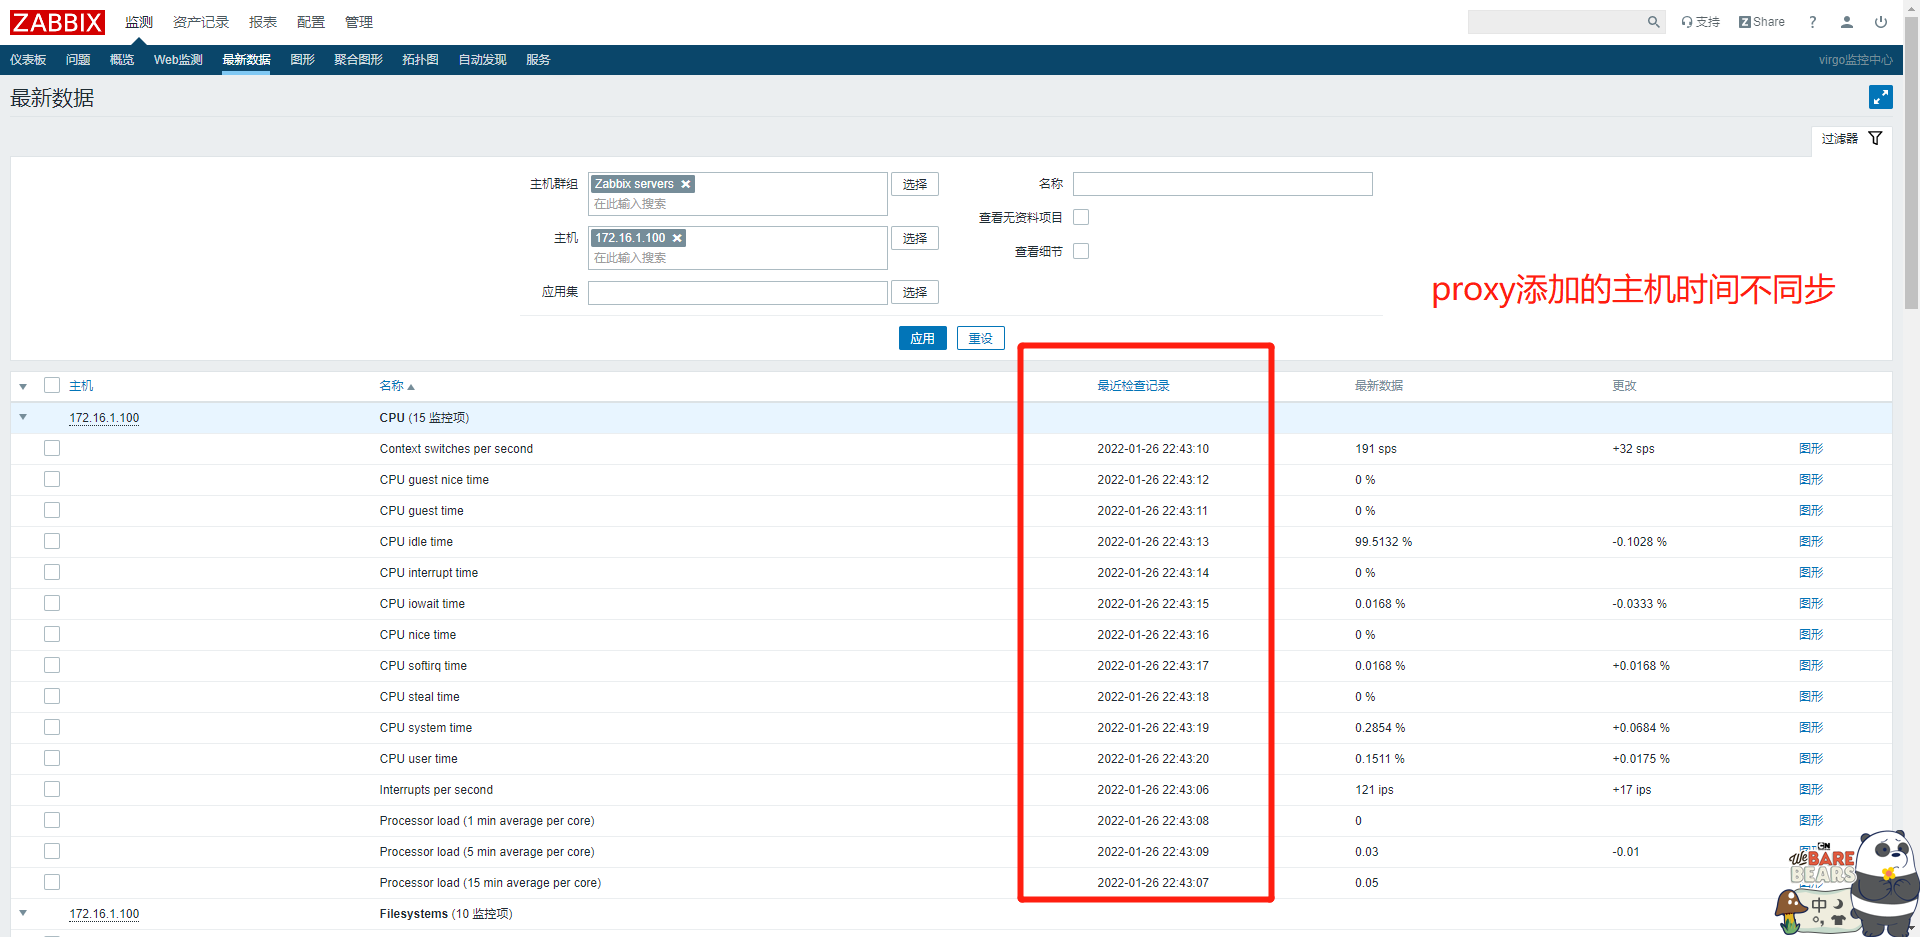
解决方法:
sudo yum install ntp ntpdate
sudo systemctl start ntpd && sudo systemctl enable ntpd
timedatectl

#同步一下server、proxy、agent这三台机器的时间,再到web界面删除主机重新添加,重启服务
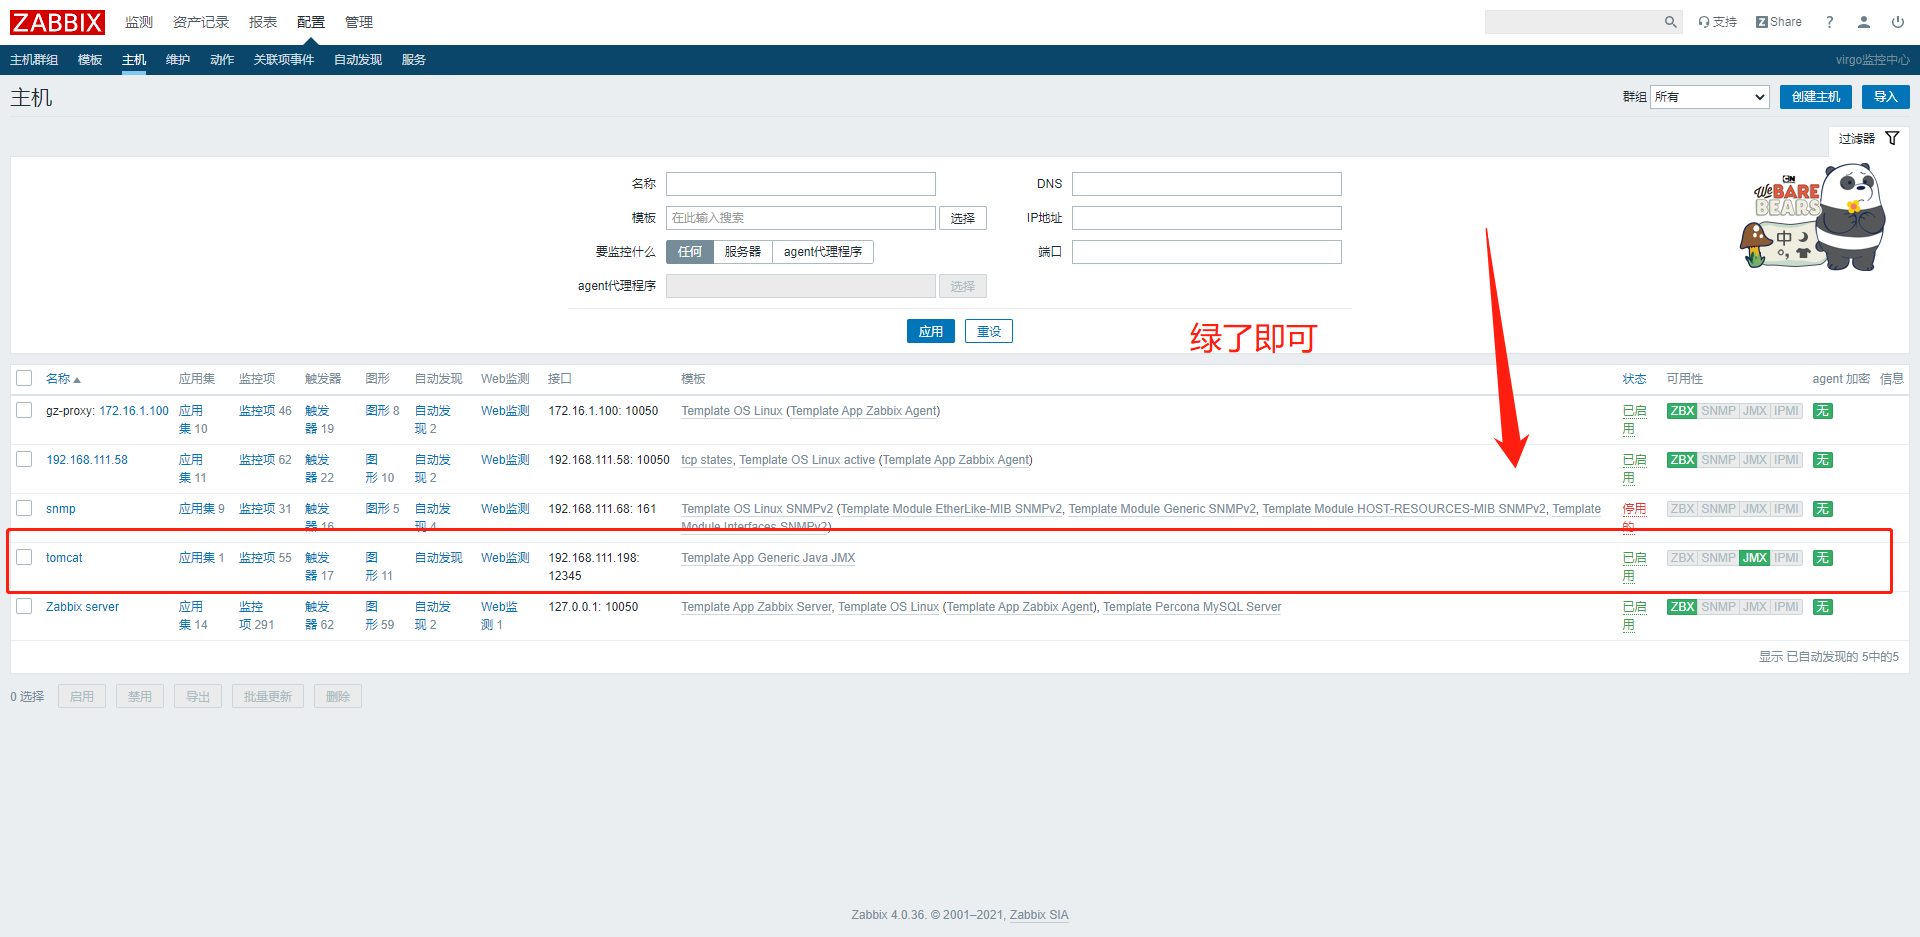
30、安装tomcat并开启jmx远程监控
环境:centos7、IP地址:192.168.111.198
安装jdk环境
mkdri /usr/java      #在usr下创建一个java目录

[root@localhost java]# ls
apache-tomcat-8.5.75.tar.gz  jdk1.8.0_181  jdk-8u181-linux-x64.tar.gz   #将两个压缩包文件上传到java下

tar -zxvf jdk-8u181-linux-x64.tar.gz     #解压jdk安装包
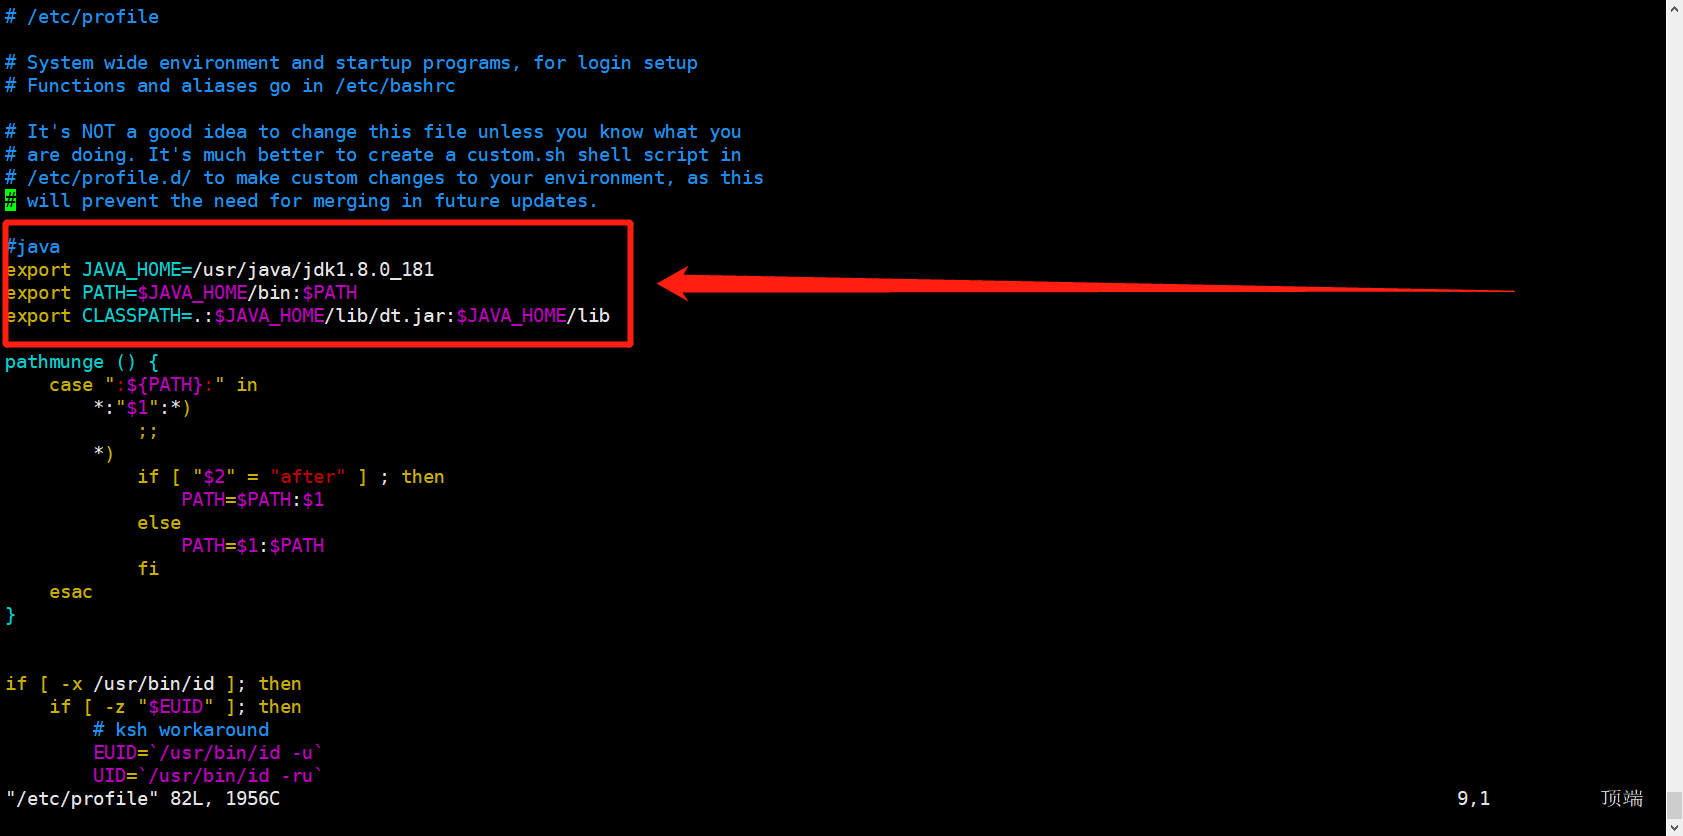
配置环境变量
vim /etc/profile

插入下面代码
#java
export JAVA_HOME=/usr/java/jdk1.8.0_181
export PATH=$JAVA_HOME/bin:$PATH
export CLASSPATH=.:$JAVA_HOME/lib/dt.jar:$JAVA_HOME/lib
#复制黏贴的时候注意换行符!复制黏贴的时候注意换行符!复制黏贴的时候注意换行符!
加载一下配置文件source /etc/profile
执行java-version检验是否安装成功
[root@localhost ~]# java -version
java version "1.8.0_181"
Java(TM) SE Runtime Environment (build 1.8.0_181-b13)
Java HotSpot(TM) 64-Bit Server VM (build 25.181-b13, mixed mode)

出现版本信息即为安装成功
centos下安装jdk的三种方法:点击这里查看
安装tomcat
tar zxf apache-tomcat-8.5.75.tar.gz -C /usr/local/ #将安装包解压到该目录下
[root@localhost bin]# ls
bootstrap.jar catalina-tasks.xml commons-daemon-native.tar.gz digest.bat shutdown.bat tomcat-juli.jar version.bat
${catalina.base} ciphers.bat configtest.bat digest.sh shutdown.sh tomcat-native.tar.gz version.sh
catalina.bat ciphers.sh configtest.sh setclasspath.bat startup.bat tool-wrapper.bat
catalina.sh commons-daemon.jar daemon.sh setclasspath.sh startup.sh tool-wrapper.sh
[root@localhost bin]# ./startup.sh #执行启动脚本
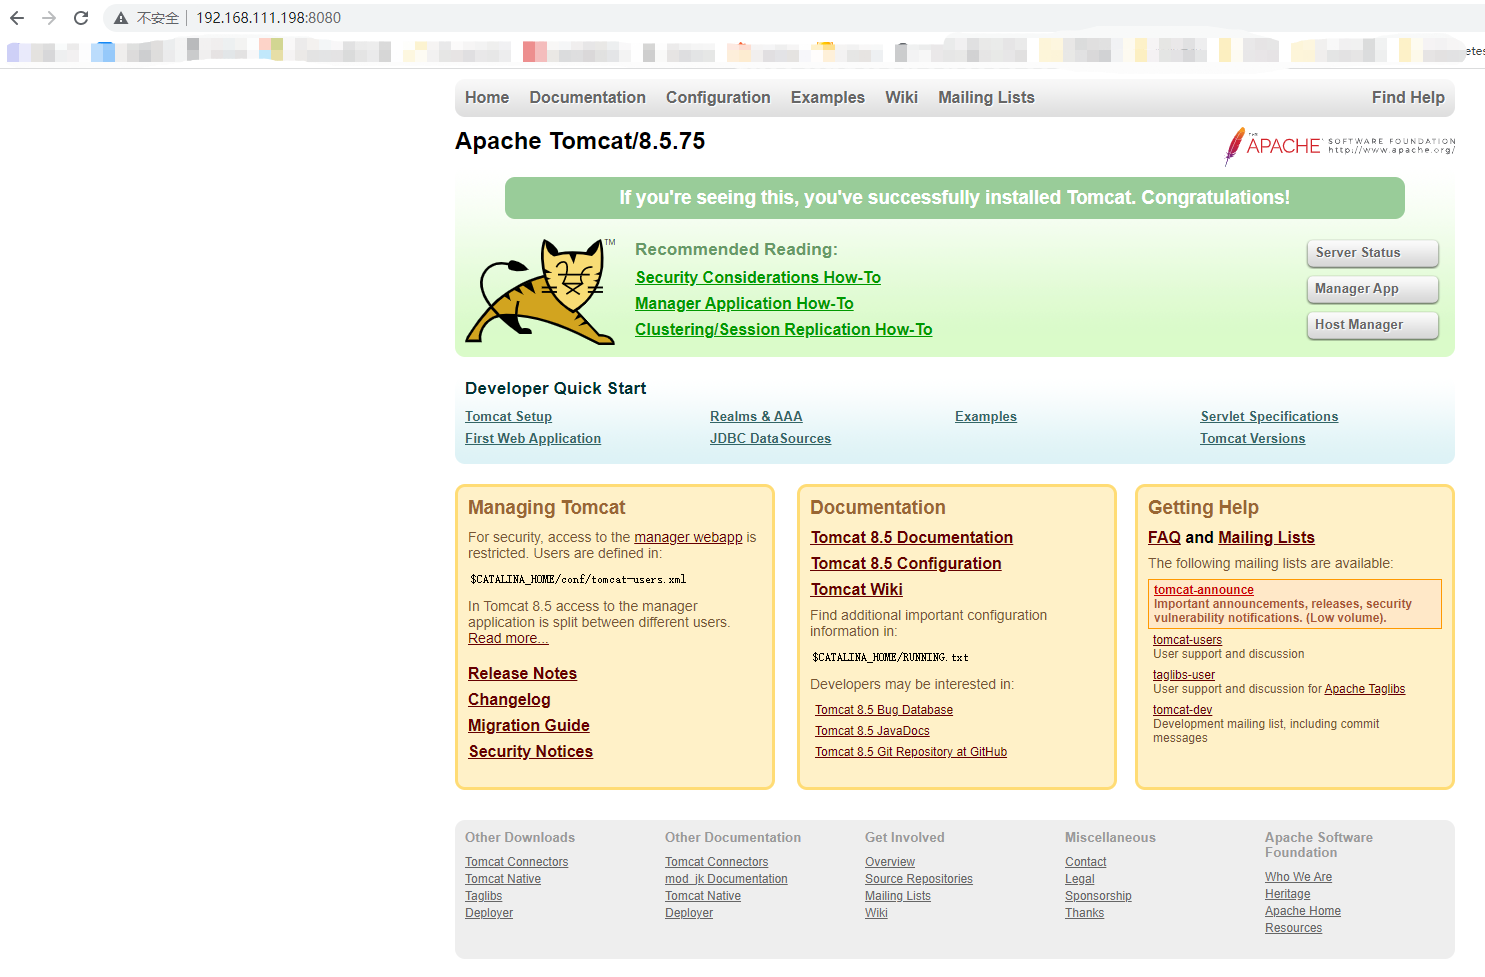
执行netstat -lntup检验8080端口是否启用 #tomcat默认使用8080端口
浏览器测试访问
开启jmx服务
[root@localhost bin]# ls
bootstrap.jar catalina-tasks.xml commons-daemon-native.tar.gz digest.bat shutdown.bat tomcat-juli.jar version.bat
${catalina.base} ciphers.bat configtest.bat digest.sh shutdown.sh tomcat-native.tar.gz version.sh
catalina.bat ciphers.sh configtest.sh setclasspath.bat startup.bat tool-wrapper.bat
catalina.sh commons-daemon.jar daemon.sh setclasspath.sh startup.sh tool-wrapper.sh
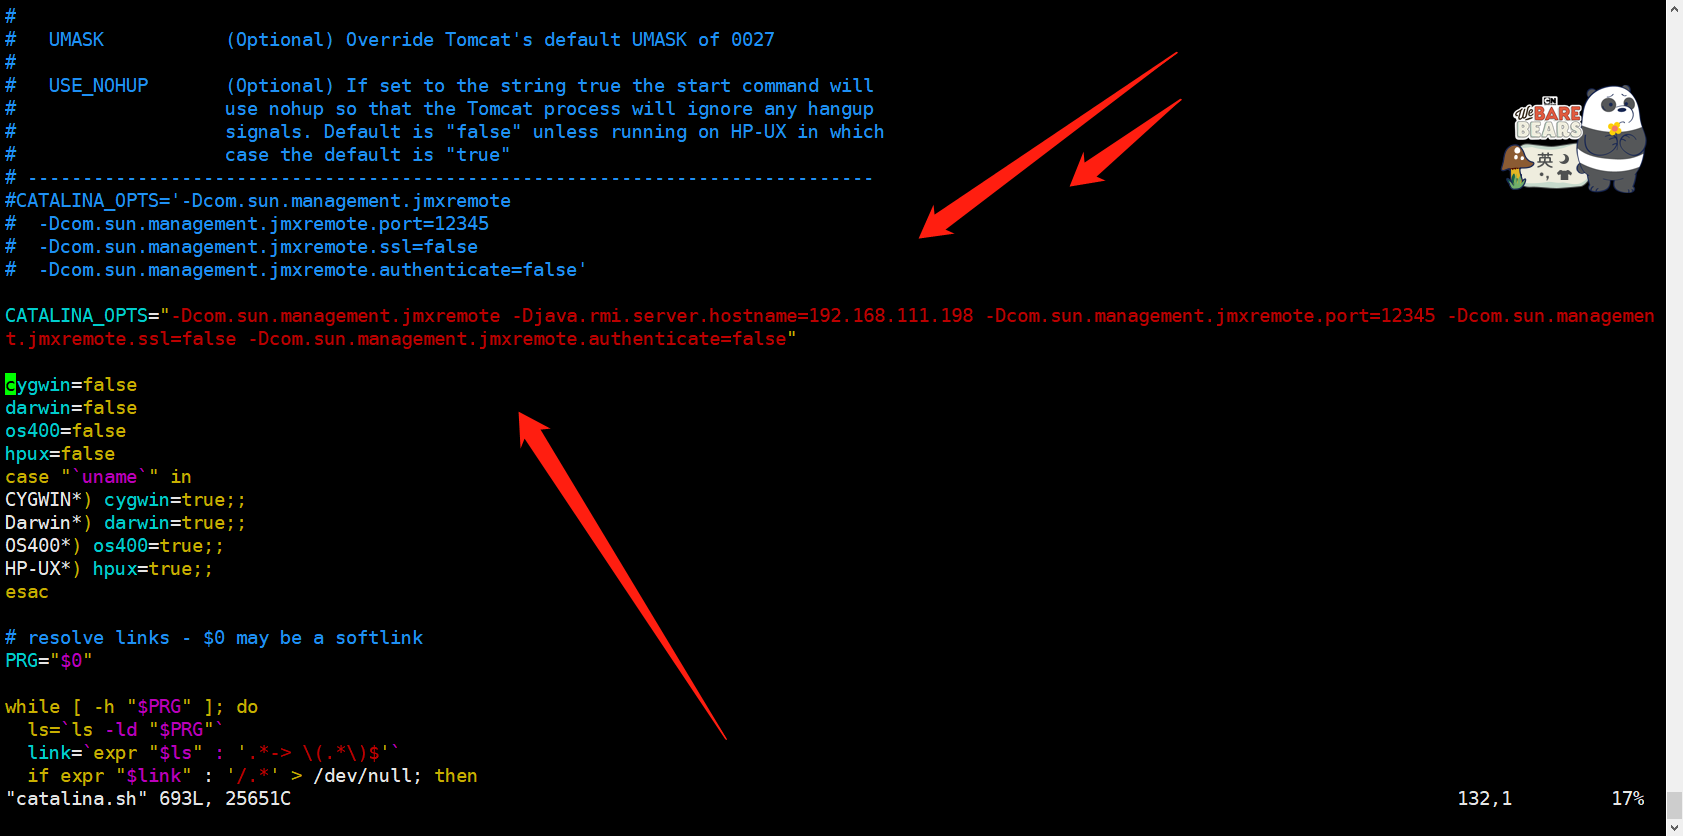
[root@localhost bin]# vim catalina.sh #修改该脚本文件
插入内容:
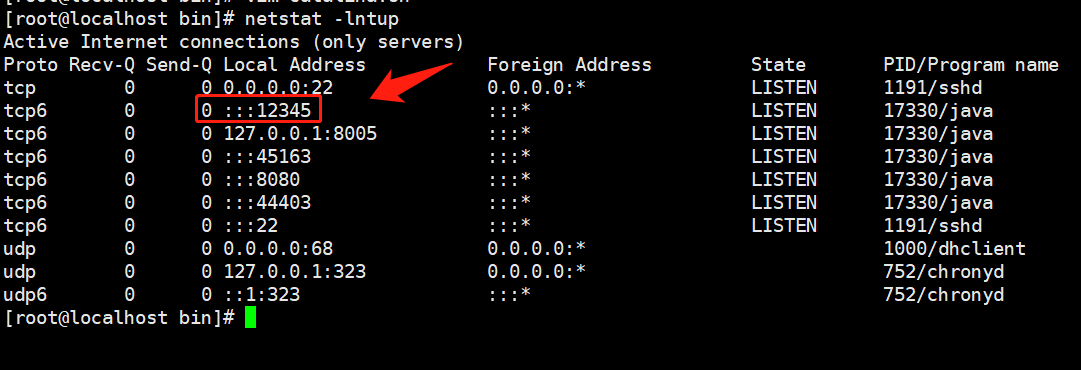
CATALINA_OPTS="-Dcom.sun.management.jmxremote -Djava.rmi.server.hostname=192.168.111.198 -Dcom.sun.management.jmxremote.port=12345 -Dcom.sun.management.jmxremote.ssl=false -Dcom.sun.management.jmxremote.authenticate=false"
#端口自定义,IP填写tomcat主机地址。复制的时候一定要注意换行符的问题!!!
重启服务
./shutdown.sh
./startup.sh
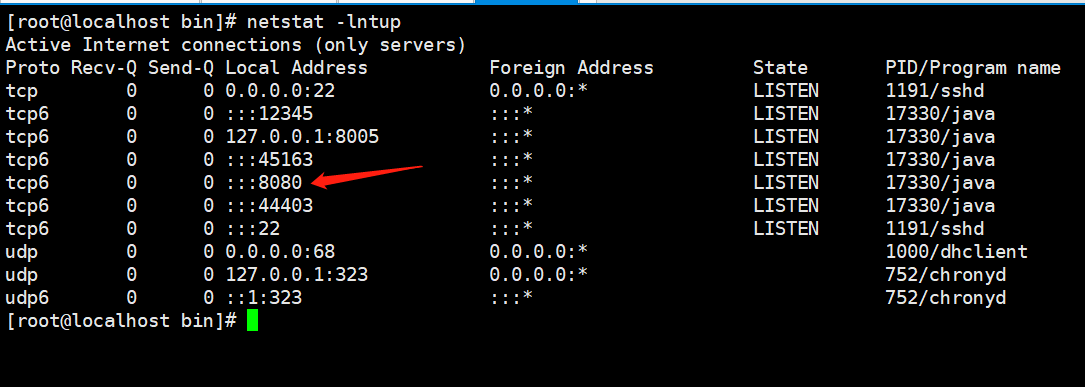
检验12345端口是否启用
安装zabbix-java-gateway (安装在zabbix-server服务器上即可,不用单独开一台服务)
yum install zabbix-java-gateway.x86_64 -y
修改配置文件
vim /etc/zabbix/zabbix_java_gateway.conf

START_POLLERS=5         #将改行去掉注释即可
启动服务
systemctl start zabbix-java-gateway.service && systemctl enable zabbix-java-gateway.service
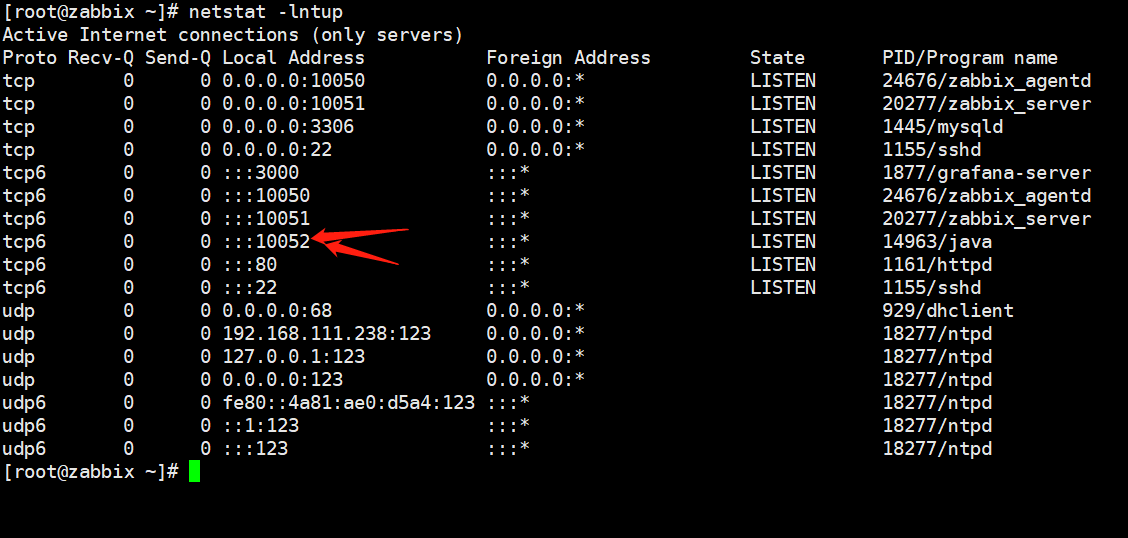
检查端口是否启用
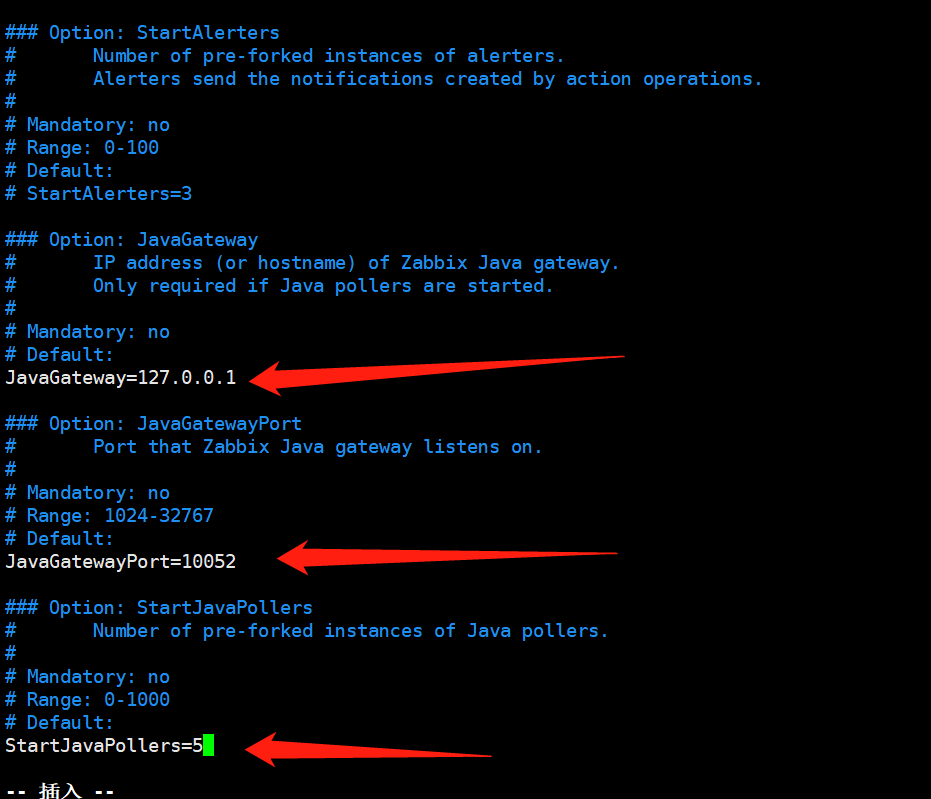
修改zabbix_server配置文件
vim /etc/zabbix/zabbix_server.conf

JavaGateway=127.0.0.1       #填写javagateway服务器地址,因为装在zabbix本机就填127.0.0.1
JavaGatewayPort=10052      #默认端口
StartJavaPollers=5         #与zabbix_java_gateway.conf保持一致即可
重启服务使配置文件生效systemctl restart zabbix-server
web界面添加主机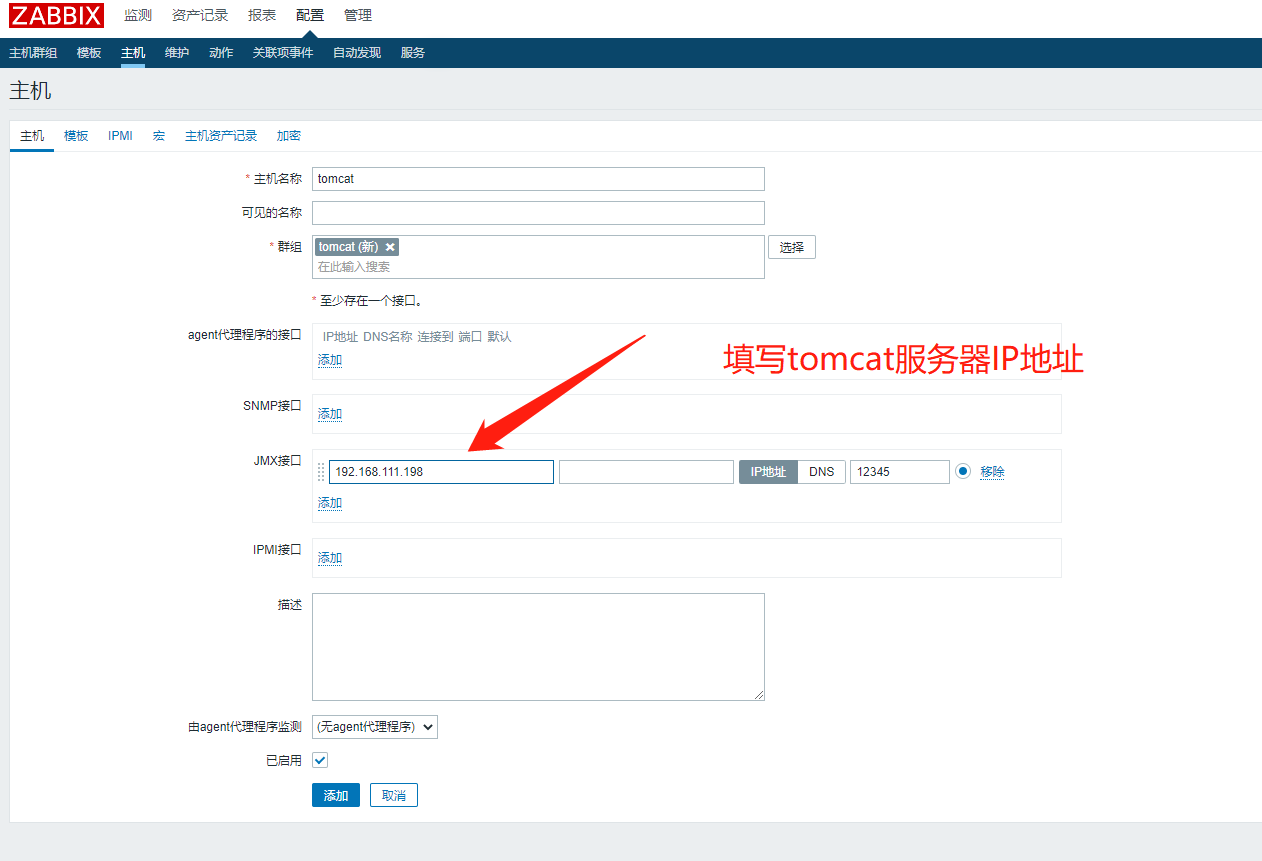
参考文档:https://www.cnblogs.com/ssgeek/p/9299273.html
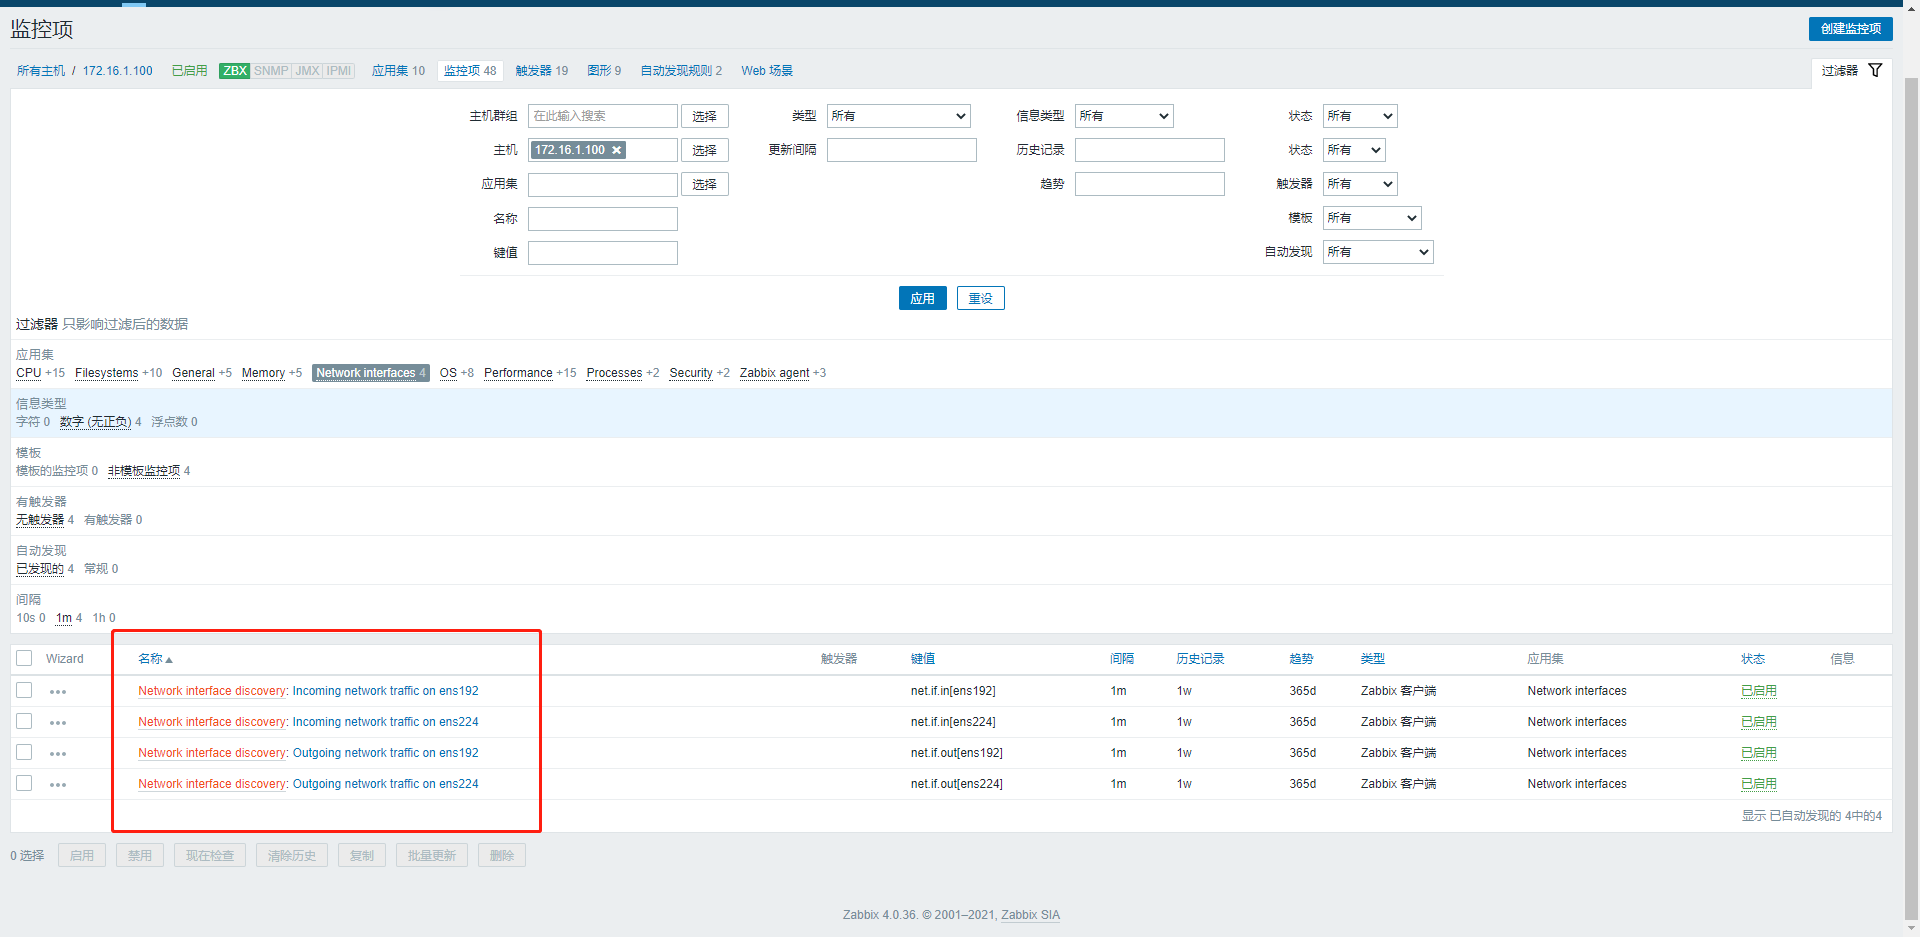
31、低级自动发现
自动发现:自动添加监控主机
低级自动发现:自动添加监控项
实验目的:使用低级自动发现自动添加监控项,监测网卡的MAC地址
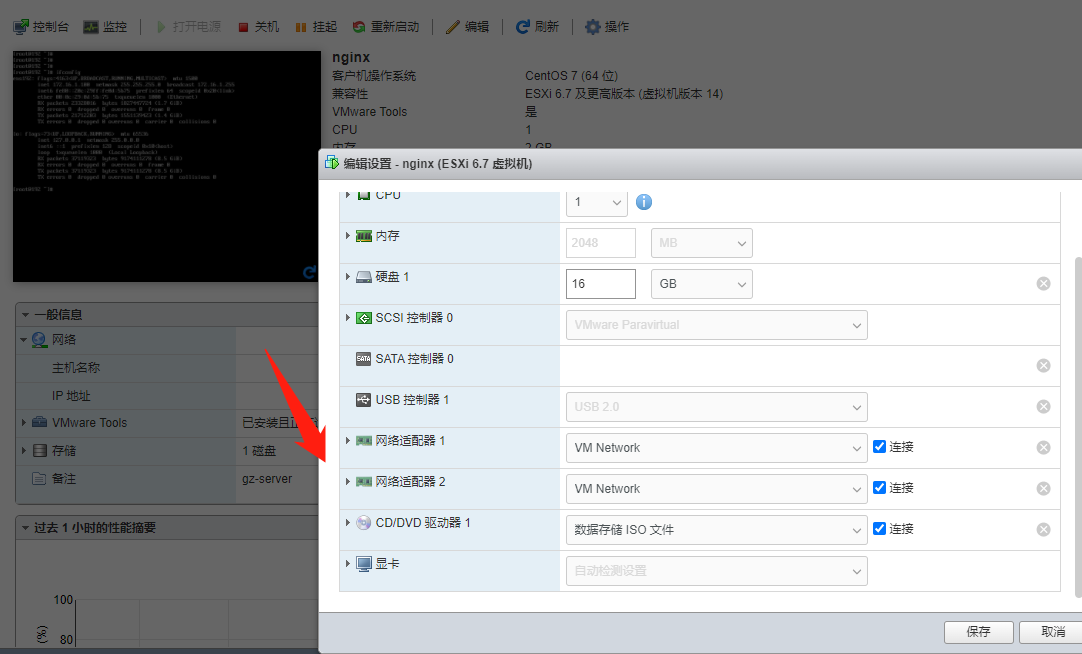
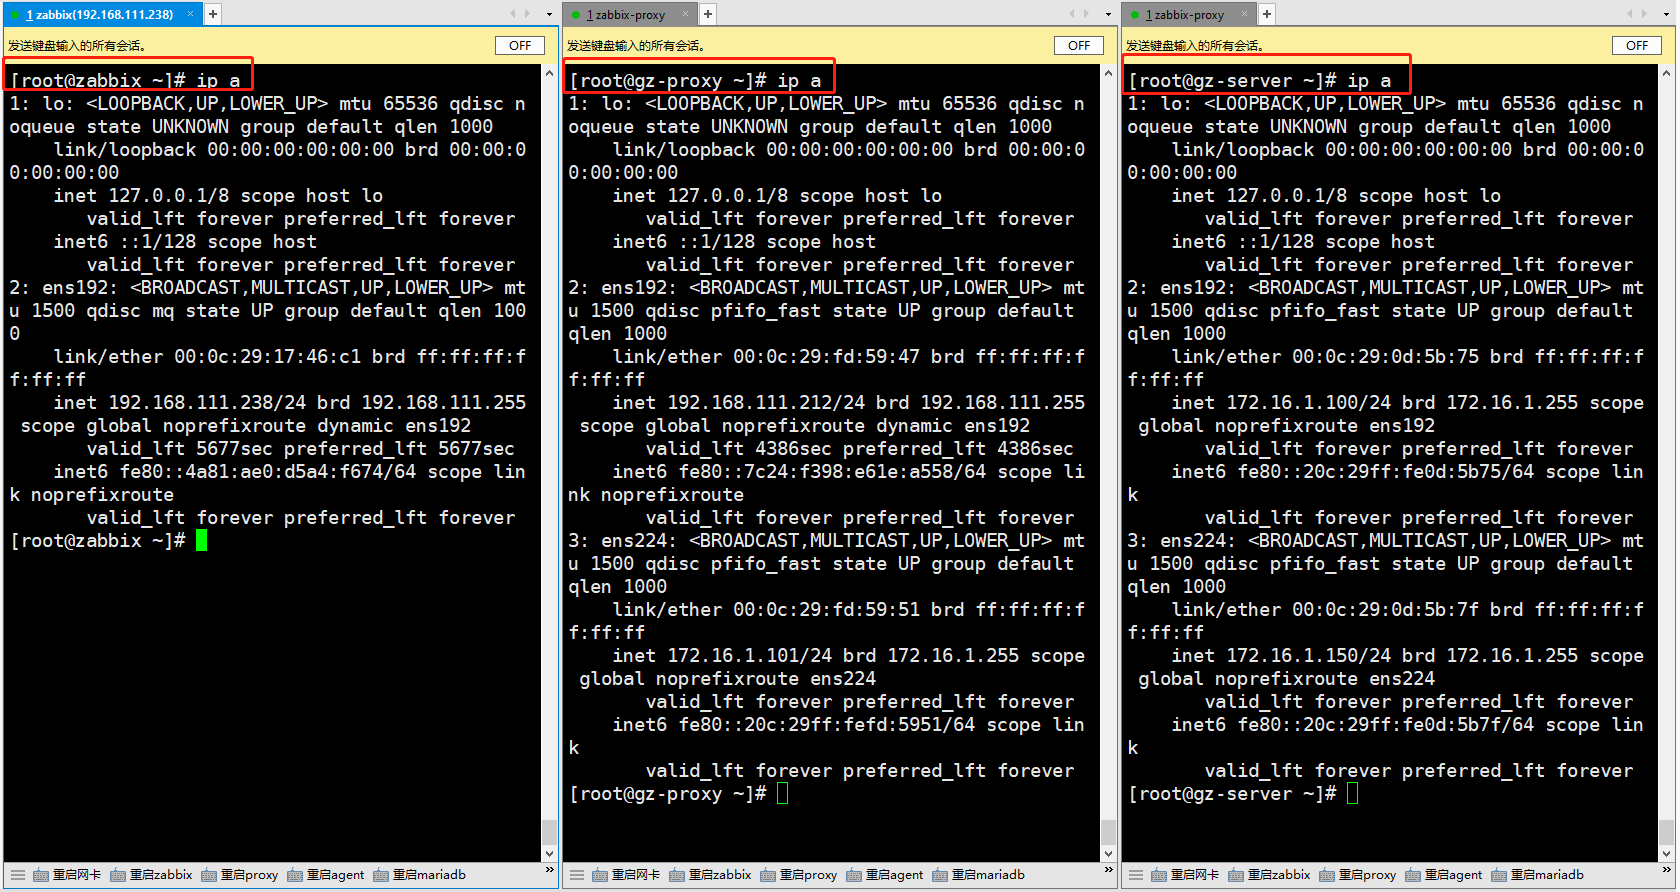
虚拟机处添加多一块网卡
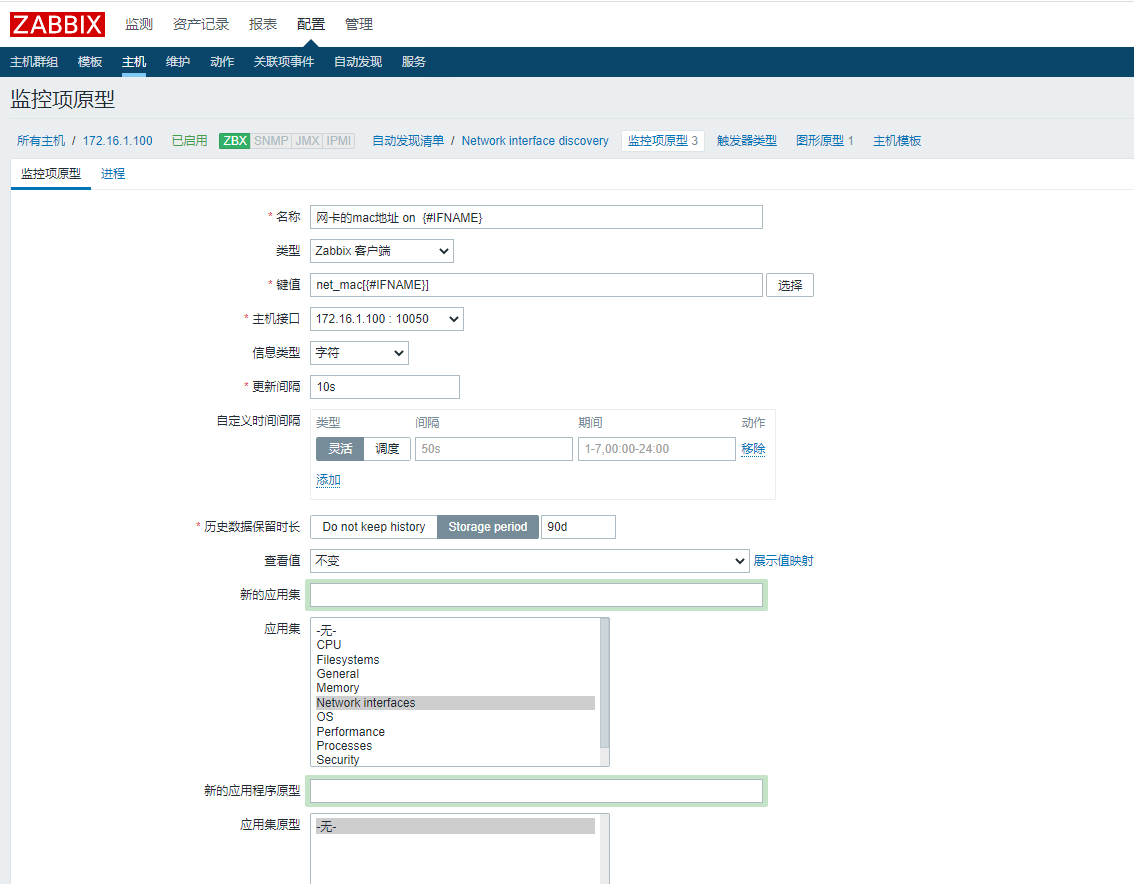
创建监控项原形(名字用变量的形式)
编写配置文件
[root@gz-server zabbix_agentd.d]# ls
fpm.conf  mac.conf  nginx.conf  redis.conf  userparameter_mysql.conf

[root@gz-server zabbix_agentd.d]# cat mac.conf
UserParameter=net_mac[*],ifconfig $1 |grep -oP '(?<=ether )\S+'

[root@gz-server zabbix_agentd.d]# pwd
/etc/zabbix/zabbix_agentd.d
重启zabbix-agentsystemctl restart zabbix-agent.service
重启zabbix-serversystemctl restart zabbix-server
重启zabbix-proxysystemctl restart zabbix-proxy.service (因为挂了代理所以需要重启)
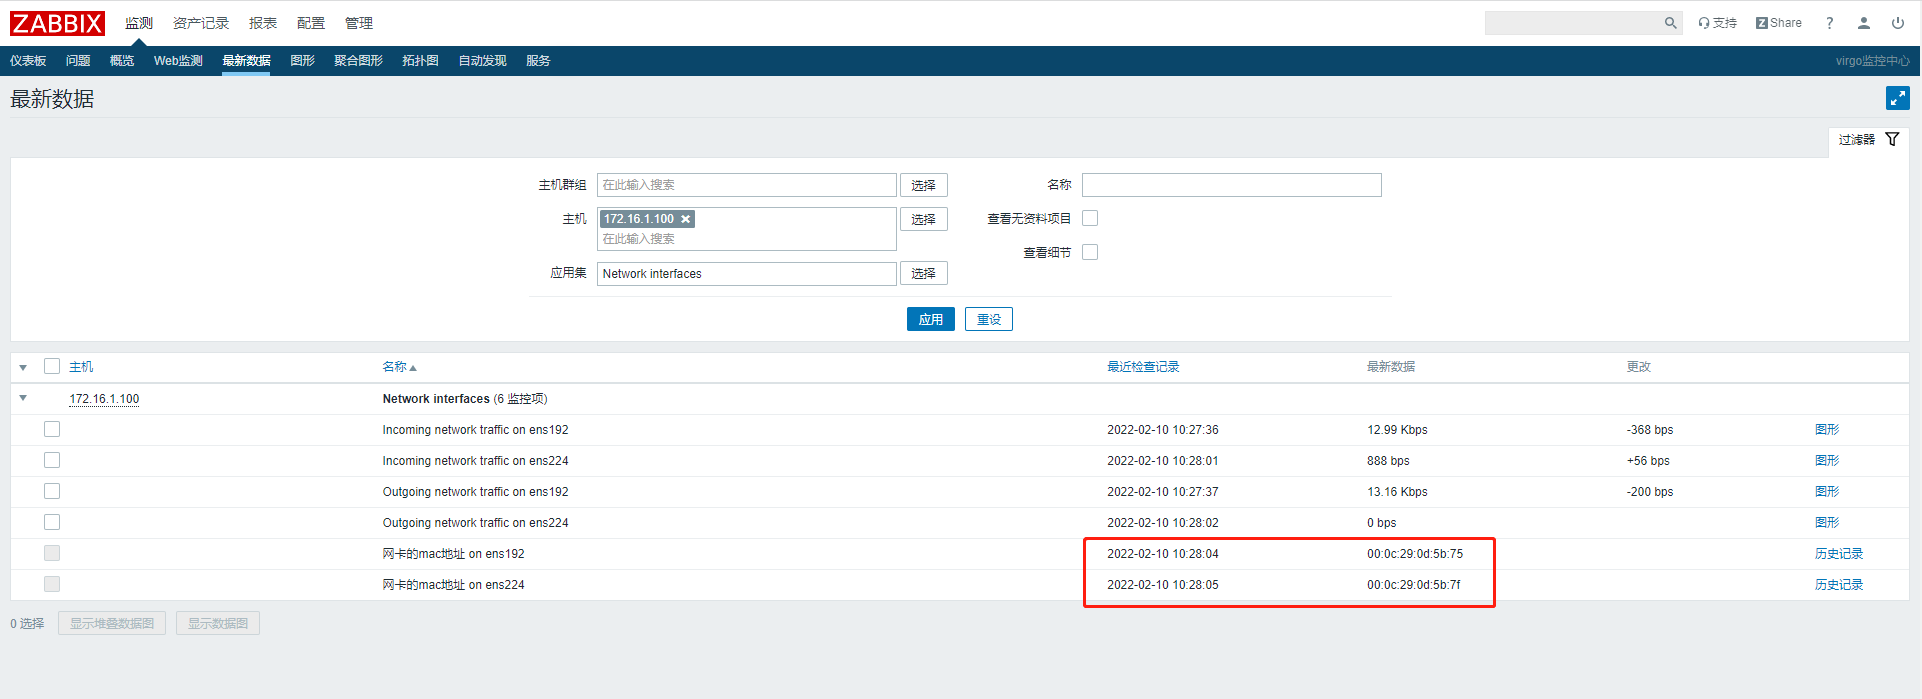
测试取值
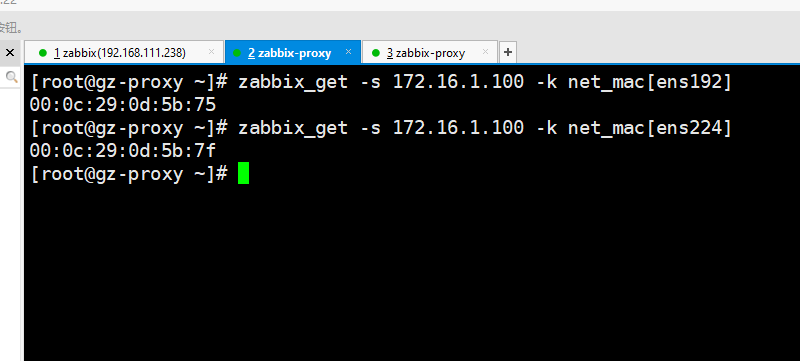
成功获取Mac地址


 475
475


 被折叠的 条评论
为什么被折叠?
被折叠的 条评论
为什么被折叠?
 到【灌水乐园】发言


