


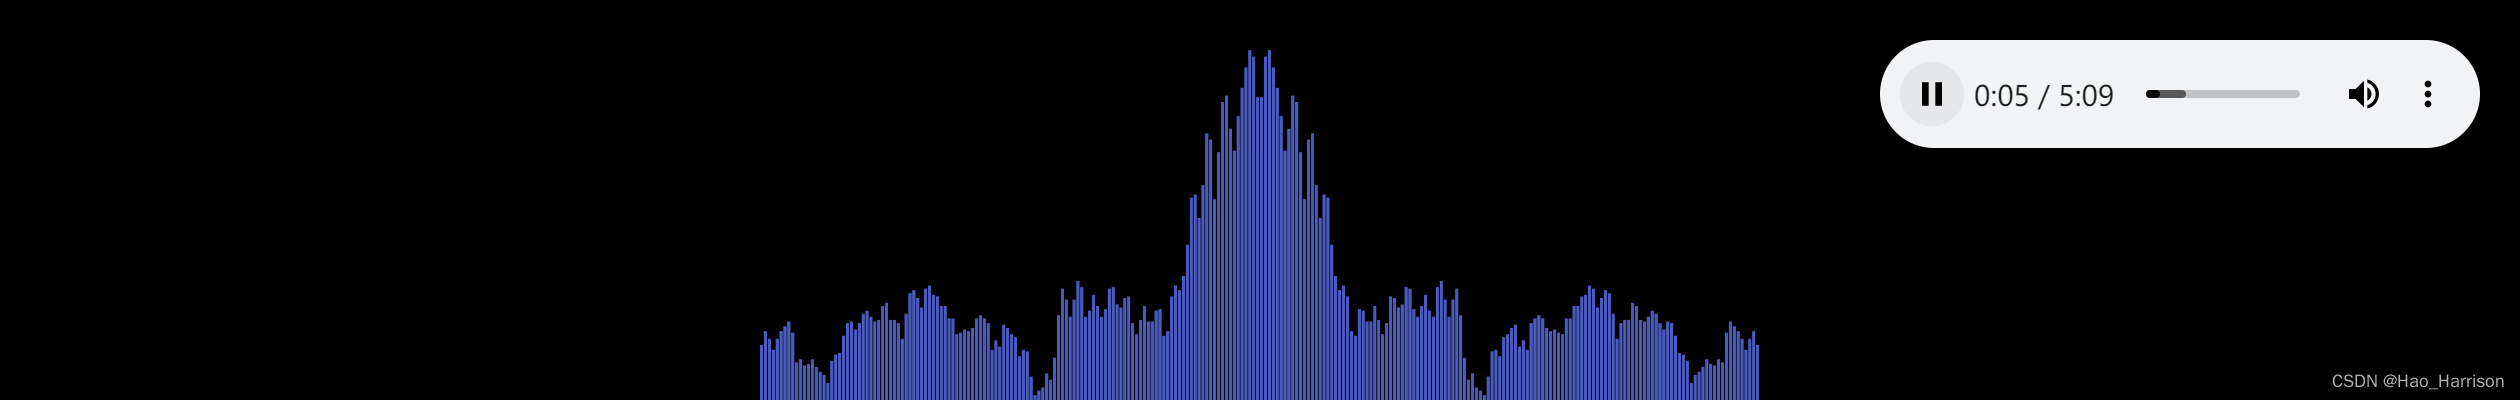
效果图
样式结构
<!DOCTYPE html>
<html lang="en">
  <head>
    <meta charset="UTF-8" />
    <meta name="viewport" content="width=device-width, initial-scale=1.0" />
    <title>音频可视化</title>
    <style>
      * {
        margin: 0;
        padding: 0;
      }
      body {
        min-height: 200px;
        display: flex;
        flex-direction: column;
        align-items: center;
        background-color: #000;
      }
      canvas {
        width: 500px;
        height: 200px;
      }
      audio {
        position: absolute;
        top: 20px;
        right: 20px;
        opacity: 0.15;
        transition: opacity 0.5s;
      }
      audio:hover {
        opacity: 1;
      }
    </style>
  </head>
  <body>
    <canvas></canvas>
    <audio src="./在这个世界相遇 - 陈奕迅.mp3" controls></audio>
  </body>
</html>
JS
<script>
  const audio = document.querySelector("audio");
  const cvs = document.querySelector("canvas");
  const ctx = cvs.getContext("2d");

  // 初始化画布
  function initCvs() {
    cvs.width = window.innerWidth * devicePixelRatio;
    cvs.height = (window.innerHeight / 2) * devicePixelRatio;
  }
  initCvs();

  // 是否已初始化
  let isInit = false;
  // 数组,用于接收分析器节点的分析数据
  let dataArray;
  let analyser;
  audio.onplay = function () {
    if (isInit) {
      return;
    }

    const audioCtx = new AudioContext();
    const source = audioCtx.createMediaElementSource(audio);
    analyser = audioCtx.createAnalyser();
    analyser.fftSize = 512;
    dataArray = new Uint8Array(analyser.frequencyBinCount);
    source.connect(analyser);
    analyser.connect(audioCtx.destination);

    isInit = true;
  };

  function draw() {
    requestAnimationFrame(draw);
    const { width, height } = cvs;
    ctx.clearRect(0, 0, width, height);
    if (!isInit) {
      return;
    }
    analyser.getByteFrequencyData(dataArray);
    const len = dataArray.length / 2; //条的数量,取一半
    const barWidth = width / len / 2;
    ctx.fillStyle = "#4A5BBD";
    for (let i = 0; i < len; i++) {
      const data = dataArray[i];
      const barHeight = (data / 255) * height;
      const x1 = i * barWidth + width / 2;
      const x2 = width / 2 - (i + 1) * barWidth;
      const y = height - barHeight;
      ctx.fillRect(x1, y, barWidth - 2, barHeight);
      ctx.fillRect(x2, y, barWidth - 2, barHeight);
    }
  }
  draw();
</script>
说明
需要在VSCode中通过live server打开


 966
966


 被折叠的 条评论
为什么被折叠?
被折叠的 条评论
为什么被折叠?
 到【灌水乐园】发言


