


 MPAndroidChart是一款强大的Android图表开源库,支持8种不同类型的图表,包括线性图、条形图、饼图等,并提供了丰富的自定义选项。该库支持API 8及以上版本,能够实现Android与iOS跨平台开发。
开源官网:https://github.com/PhilJay/MPAndroidChart
Android开源框架——图表MPAndroidChart
MPAndroidChart是一个功能强大,简单易用的图表开源库,支持API8及以上版本。它能实现Android与IOS跨平台开发。
特点
- 8种不同的图表类型
- 支持缩放功能
- 支持拖动与平移
- 组合图(线性,条形,散点,k线)
- 双(单)轴
- 可自定义坐标轴(x轴,y轴)
- 突出显示值 (可定制弹出视图)
- 将图表以JPG,PNG或txt形式保存到SD卡中
- 预定义颜色模板
- 图例(自动产生,可定制)
- 构建动画效果(x轴,y轴都可以)
- 限制线(提供额外的信息)
- 完全可定制化(画笔,字体,图例,颜色,背景,手势,虚线)
- 线性表或条形表中可以缩放或者滚动达到30000条数据
- Gradle支持
- 绘制的数据可以直接来自Realm.io移动数据库中
配置
Gradle
- Add the following to your build.gradle:
repositories {
    maven { url "https://jitpack.io" }
}

dependencies {
    compile 'com.github.PhilJay:MPAndroidChart:v2.2.5'
}
Maven
- Add the following to your pom.xml:
<repository>
    <id>jitpack.io</id>
    <url>https://jitpack.io</url>
</repository>

<dependency>
    <groupId>com.github.PhilJay</groupId>
    <artifactId>MPAndroidChart</artifactId>
    <version>v2.2.5</version>
</dependency>
图表类型
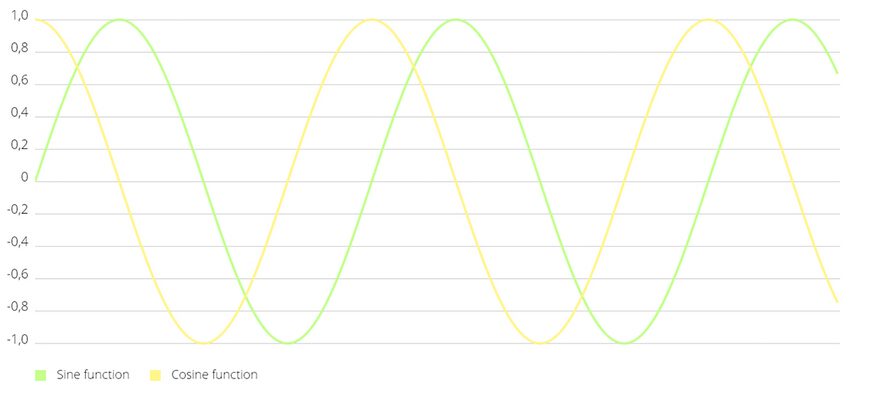
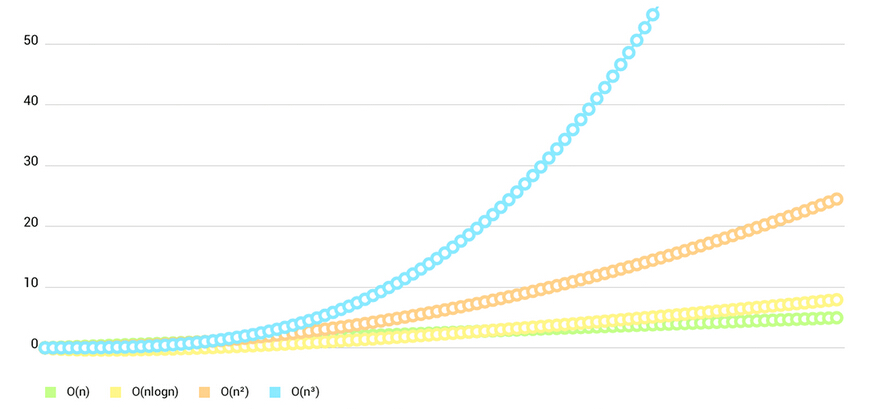
LineChart (with legend, simple design)
LineChart (with legend, simple design)
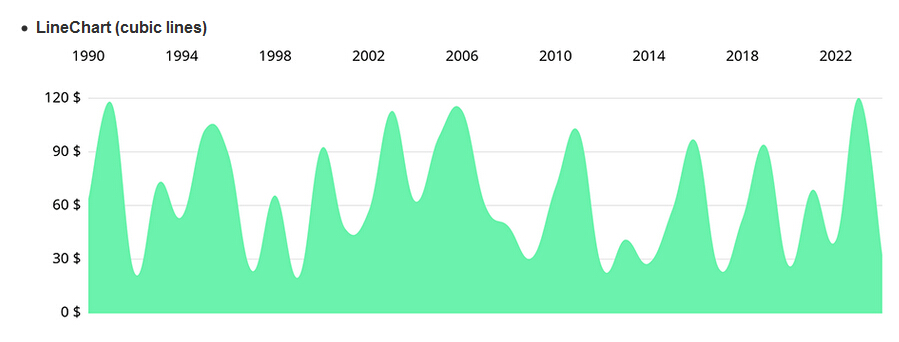
LineChart (cubic lines)
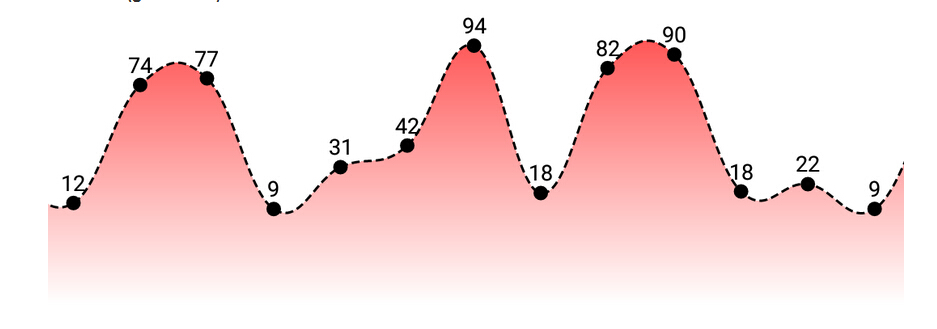
LineChart (gradient fill)
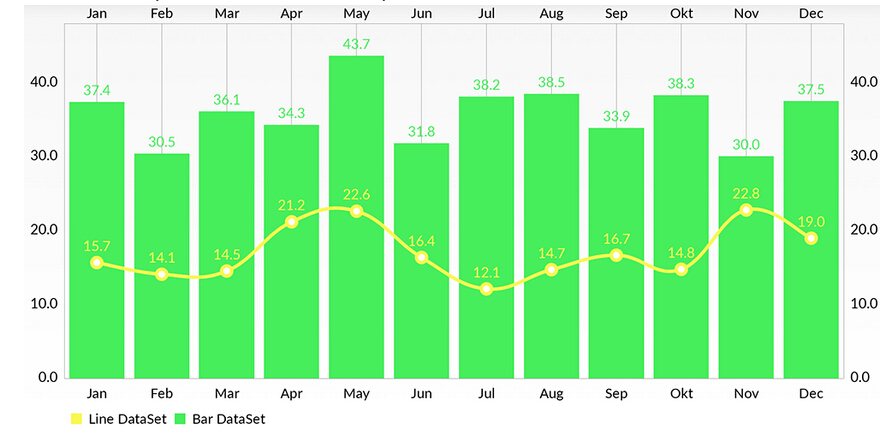
- Combined-Chart (bar- and linechart in this case)
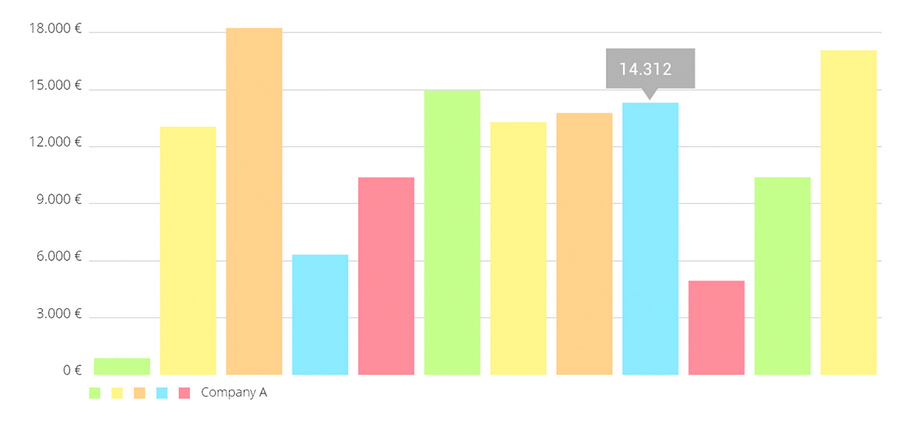
- BarChart (with legend, simple design)
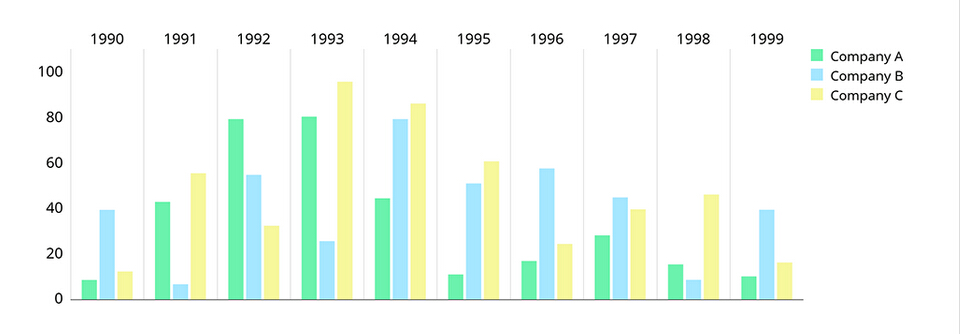
BarChart (grouped DataSets)
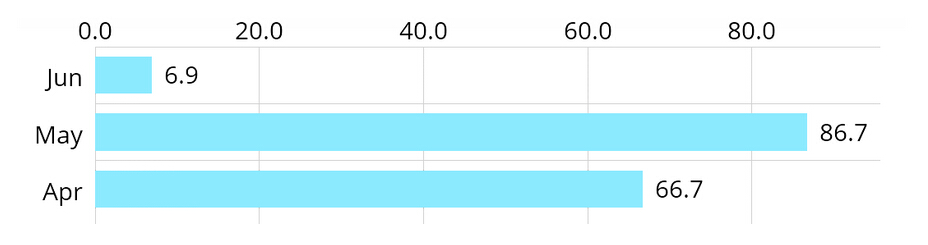
Horizontal-BarChart
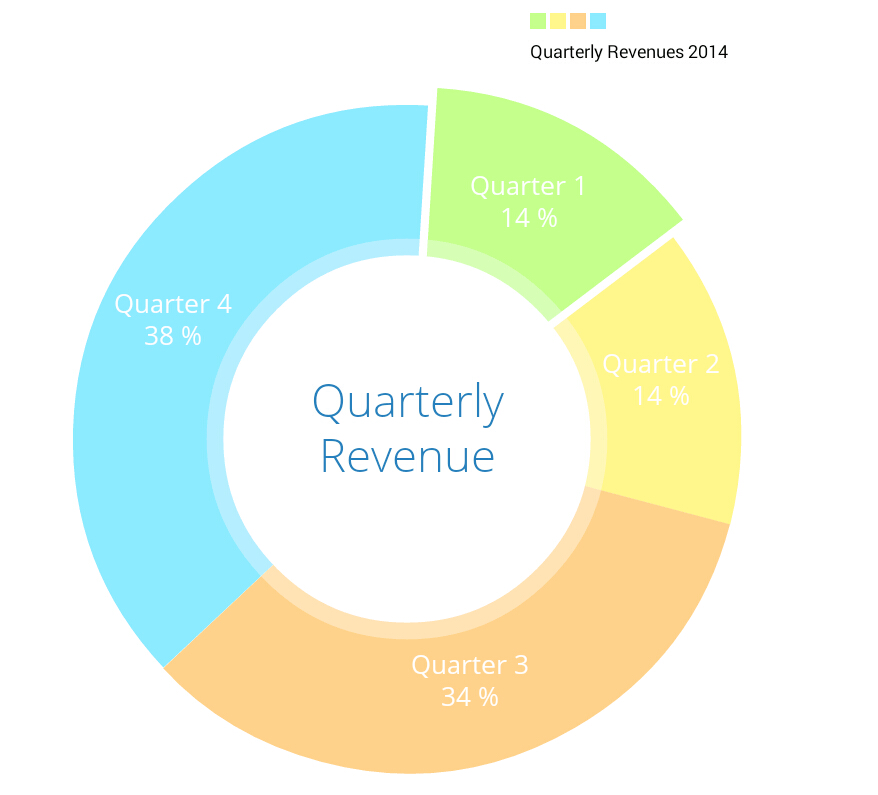
PieChart (with selection, …)
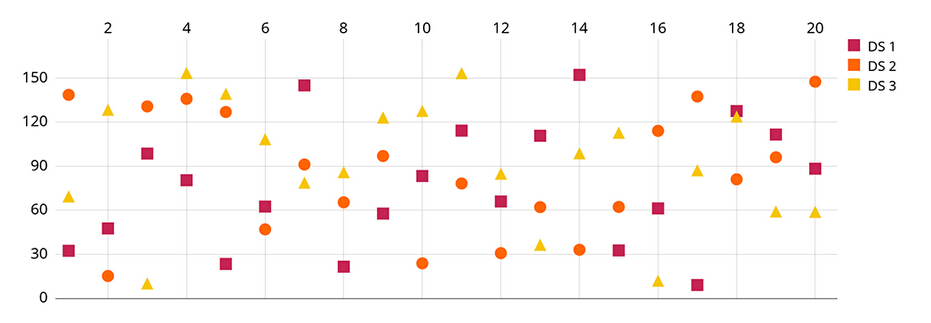
- ScatterChart (with squares, triangles, circles, … and more)
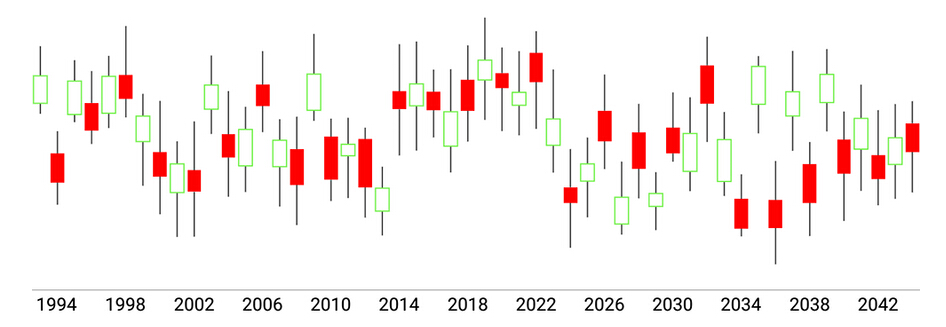
CandleStickChart (for financial data)
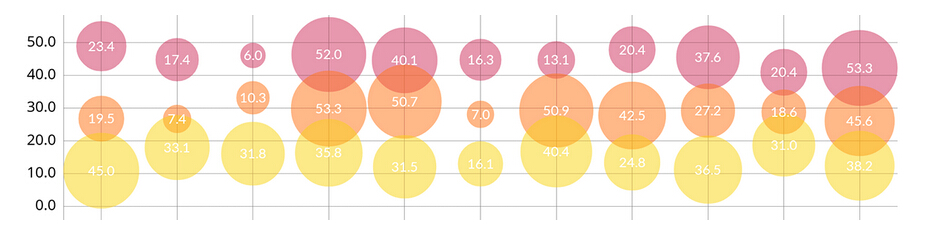
BubbleChart (area covered by bubbles indicates the value)
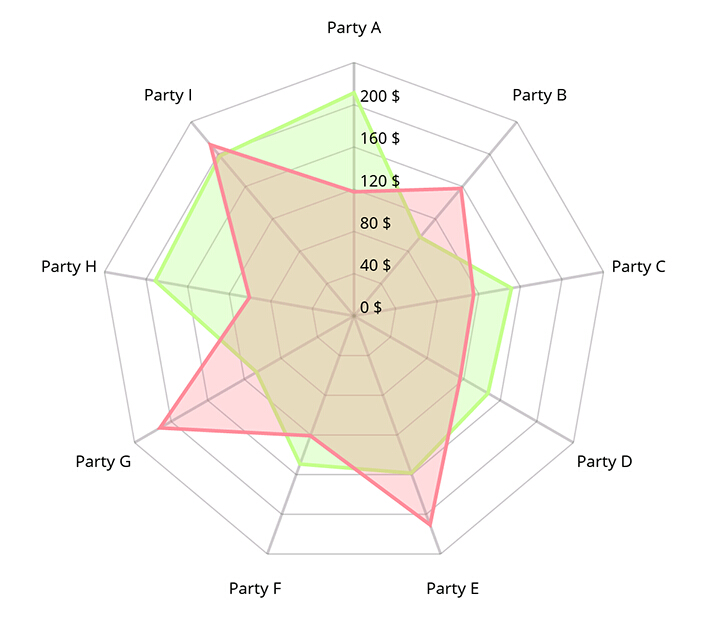
- RadarChart (spider web chart)
Demo
package com.android.chart;
import android.support.v7.app.AppCompatActivity;
import android.os.Bundle;
import com.github.mikephil.charting.charts.BarChart;
import com.github.mikephil.charting.data.BarData;
import com.github.mikephil.charting.data.BarDataSet;
import com.github.mikephil.charting.data.BarEntry;
import com.github.mikephil.charting.utils.ColorTemplate;
import java.util.ArrayList;
import java.util.List;
public class MainActivity extends AppCompatActivity {
@Override
protected void onCreate(Bundle savedInstanceState) {
super.onCreate(savedInstanceState);
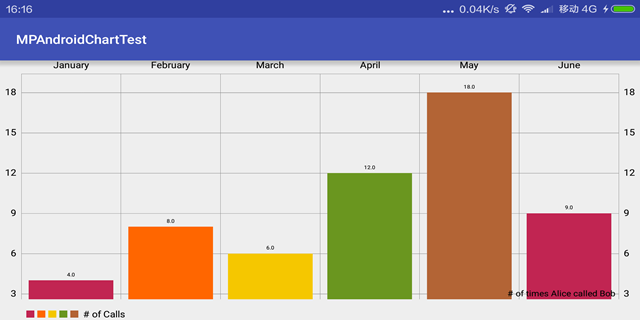
List<BarEntry> entries = new ArrayList<>();
entries.add(new BarEntry(4f,0));
entries.add(new BarEntry(8f,1));
entries.add(new BarEntry(6f,2));
entries.add(new BarEntry(12f,3));
entries.add(new BarEntry(18f,4));
entries.add(new BarEntry(9f,5));
BarDataSet dataSet = new BarDataSet(entries,"# of Calls");
dataSet.setColors(ColorTemplate.COLORFUL_COLORS);
List<String> labels = new ArrayList<>();
labels.add("January");
labels.add("February");
labels.add("March");
labels.add("April");
labels.add("May");
labels.add("June");
BarData data = new BarData(labels,dataSet);
BarChart barChart = new BarChart(this);
barChart.setData(data);
barChart.setDescription("# of times Alice called Bob");
setContentView(barChart);
}
}
参考:
【1】http://www.jianshu.com/p/791b7eba2dd4
【2】 http://blog.csdn.net/shineflowers/article/details/44701645
【3】http://code.tutsplus.com/tutorials/add-charts-to-your-android-app-using-mpandroidchart–cms-23335


 1021
1021

 被折叠的 条评论
为什么被折叠?
被折叠的 条评论
为什么被折叠?
 到【灌水乐园】发言


