


1.项目背景
- 数据包中包含温度曲线数据,想利用python的matplotlib.pyplot绘制模块将数据曲线绘制出来。
- 涉及的python知识:1.文件操作 2.命令行参数解析 3.解析的字符转short,int 4.文件打包 5.曲线绘制
2.源码分析
2.1 2个字符转short,4个字符转int
2.2输入提示
import matplotlib.pyplot as plt
import numpy as np
import binascii
import sys
import argparse
import getopt
import os
#1.解析焦温点数N
#2.解析曲线条数S
#3.解析曲线温度点个数
#将str转换为1个字节的数字
def ascii2Num_01(oneByte):
hex_value = binascii.hexlify(oneByte)
dec_value = int(hex_value,16)
#print("asic:{},hex_value:{},dec_value:{}".format(oneByte,hex_value,dec_value))
return dec_value
#将str转换为2个字节的数字
def ascii2Num_02(byte1,byte2):
str = byte2 + byte1
hex_value = binascii.hexlify(str)
dec_value = int(hex_value,16)
#print("str:{},hex_value:{},dec_value:{}".format(str,hex_value,dec_value))
return dec_value
#将str转换为4个字节的数字
def ascii2Num_03(byte1,byte2,byte3,byte4):
str = byte4 + byte3 + byte2 + byte1
hex_value = binascii.hexlify(str)
dec_value = int(hex_value,16)
#print("str:{},hex_value:{},dec_value:{}".format(str,hex_value,dec_value))
return dec_value
def inputHelp(argv):
#print(argv)
try:
opts, args = getopt.getopt(argv,"hi:",["help","input="])
except getopt.GetoptError:
print('usage:readPackage.py -i <inputfile>')
sys.exit(2)
for opt,arg in opts:
#print("opt:{},arg:{}".format(opt,arg))
if opt in ("-h","--help"):
print("usage:readPackage.py -i <inputfile>")
sys.exit()
if __name__ == "__main__":
inputHelp(sys.argv[1:])
if len(sys.argv) == 3:
if os.access(sys.argv[2],os.F_OK | os.R_OK):
f = open(sys.argv[2],'rb')
'''解析焦温点数N'''
f.seek(0,2)
fileSize = f.tell()
f.seek(0,0) #回到文件开头
f.seek(65,0)
gearNum = ascii2Num_01(f.read(1))
print("gearNum:{}".format(gearNum))
'''解析w,h曲线温度点个数'''
f.seek(75,0)
disNum = ascii2Num_01(f.read(1))
print("disNum:{}".format(disNum))
w = ascii2Num_02(f.read(1),f.read(1))
h = ascii2Num_02(f.read(1),f.read(1))
curveTempNum = ascii2Num_02(f.read(1),f.read(1))
gearArrayLen = ascii2Num_02(f.read(1),f.read(1))
print("w:{},h:{},curveTempNum:{},gearArrayLen:{}".format(w,h,curveTempNum,gearArrayLen))
'''曲线数据长度,K矩阵长度'''
curveDataLen = ascii2Num_03(f.read(1),f.read(1),f.read(1),f.read(1))
kLen = ascii2Num_03(f.read(1),f.read(1),f.read(1),f.read(1))
print("curveDataLen:{},kLen:{}".format(curveDataLen,kLen))
'''绘制曲线数据'''
#将文件定位到曲线数组位置
f.seek(216+1400+gearArrayLen,0)
curve1X = []
curve1Y = []
for index in range(gearNum*disNum):
#for index in range(2):
curve1X.append([])
curve1Y.append([])
print("index={}".format(index))
for x in range(curveTempNum):
tempValue = ascii2Num_02(f.read(1),f.read(1))
#print("hex_value: {},dec_value: {}".format(hex_value,dec_value))
if index ==0:
curve1X[0].append(x)
curve1Y[index].append(tempValue)
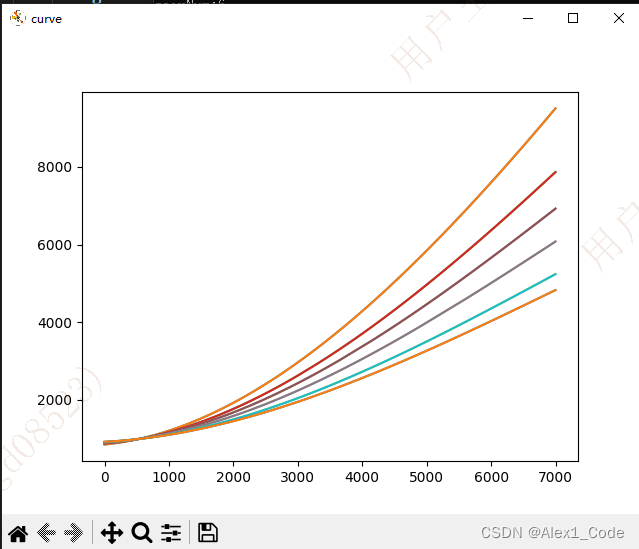
plt.figure('curve')
plt.plot(curve1X[0],curve1Y[index]) # plot绘制折线图
pic_name = 'curve01.jpg'
plt.savefig(pic_name) #保存图象
plt.show()
f.close()
else:
print("file is not exist!")
else:
print("输入不合法!")
3.可执行文件打包
参考下面的链接:
python打包exe程序参考
4.运行效果
- 执行命令:.\readPackage.py -i .\630_standard_high.raw
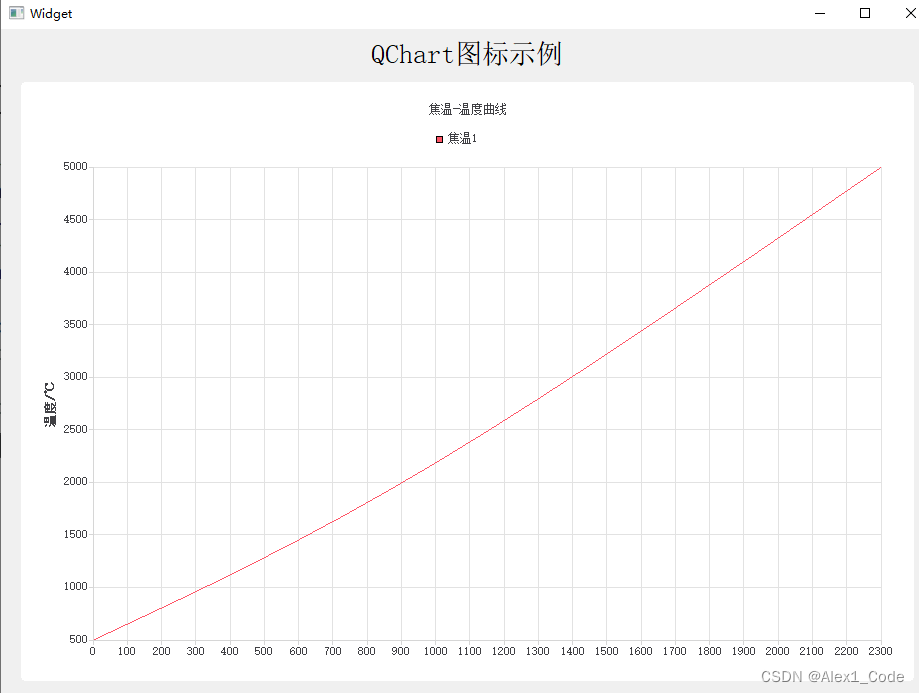
5.Qt QChart实现同样的绘制效果
- QT += core gui charts
#include <QValueAxis>
#include <QSplineSeries>
    ui->setupUi(this);
    QChart* chart = new QChart;
    chart->setTitle("焦温-温度曲线");
    chart->createDefaultAxes();
    QValueAxis *axisX = new QValueAxis;
    axisX->setRange(0, 2300);
    axisX->setTickCount(24);
    axisX->setLabelFormat("%d");


    QValueAxis *axisY = new QValueAxis;
    axisY->setRange(500, 5000);
    axisY->setTickCount(10);
    axisY->setTitleText("温度/℃");
    axisY->setLabelFormat("%d");

    chart->addAxis(axisY,Qt::AlignLeft);
    chart->addAxis(axisX,Qt::AlignBottom);
    QSplineSeries *series = new QSplineSeries();
    series->setName("焦温1");
    series->append(0,500);
    series->append(1000,2000);
    series->append(2300,4500);

    QPen pen(QColor(0xff5566));
    series->setPen(pen);
    chart->addSeries(series);

    ui->chartView->setChart(chart);


 2666
2666


 被折叠的 条评论
为什么被折叠?
被折叠的 条评论
为什么被折叠?
 到【灌水乐园】发言


