


接着上面的博客写的。
http://blog.csdn.net/xd_senior/article/details/49906023
前一个博客写了python的安装和numpy的安装及应用,还有一些书中代码的演示。
接下来写一下我在安装matplotlib中遇到的各种奇葩问题。我的版本是windows64,但是安装的确是win32的版本。
http://sourceforge.net/projects/matplotlib/files/这个里面各种版本的都有,大家下下来就可以直接安装。这个不是主要问题我是一次性安装成功,不像numpy安装了N次。
matplotlib不是安装上就可以用。还需要安装别的库。numpy就是前面一个,好像matplotlib 1.5的版本要配numpy 1.8及之上的版本。我之前安装的就是numpy1.5版本,在输入命令import matplotlib.pyplot as plt时就给我提示这个错误:
RuntimeError: module compiled against API version 7 but this version of numpy is 6 Traceback (most recent call last): ImportError: numpy.core.multiarray failed to import
我是重新安装了numpy1.8就可以了。
dateutil
pyparsing
scipy
http://www.lfd.uci.edu/~gohlke/pythonlibs/上面的这些都可以从这个网站下到。
之后在控制台中输入pip install **.whl就可以安装了。
如果提示需要安装Msvcp.dll,就还要下载一个脚本。http://pan.baidu.com/s/1kTo5dLP 我的网盘里就有。
这些都安装上了如果还是提示错误:ImportError: No module named ‘cycler’https://pypi.python.org/pypi/Cycler 这里里面可以下载到这个库。安装之上就没问题了,或者直接把里面的文件复制到C:\Python27\Lib\site-packages这个文件夹里面也行,我就是这么做的简单粗暴。
要是还有什么问题,可以在留言板下面留言或者直接百度,相信我们不是第一个遇到这样问题的人,总可以从网上找到相似的答案,然后自己多去尝试,就能解决问题。
好了,到此为止我的matplotlib就安装完成了。
测试P23页上面的代码应该就是没有问题了!
>>> import matplotlib
>>> import matplotlib.pyplot as plt
>>> fig = plt.figure()
>>> ax = fig.add_subplot(111)
>>> import kNN
>>> datingDataMat,datingLabels = kNN.file2matrix('datingTestSet2.txt')
>>> ax.scatter(datingDataMat[:,1],datingDataMat[:,2])
<matplotlib.collections.PathCollection object at 0x04600F70>
>>> plt.show()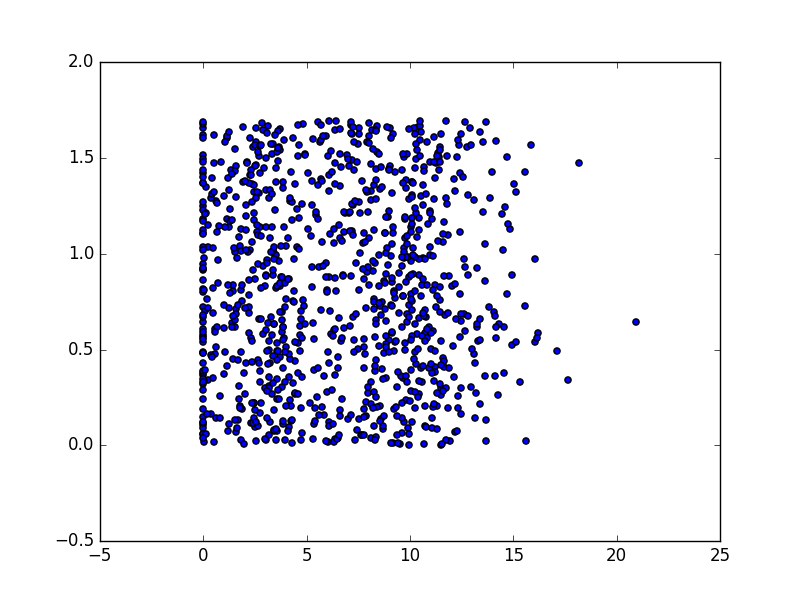
大家会发现这里面没有坐标轴的标注,所以说书中给的代码不全,我自己从网上查了一下代码:
from matplotlib.font_manager import FontProperties
plt.xlabel(u'每年获取的飞行常客历程数',fontproperties=font)
plt.ylabel(u'玩游戏所耗时间百分比',fontproperties=font)前面需要导入那个库,不要忘了,否则就无法显示中文。#-- coding: utf-8 --这个特别注释也要加上,网上说这个很特别,不是普通的注释。
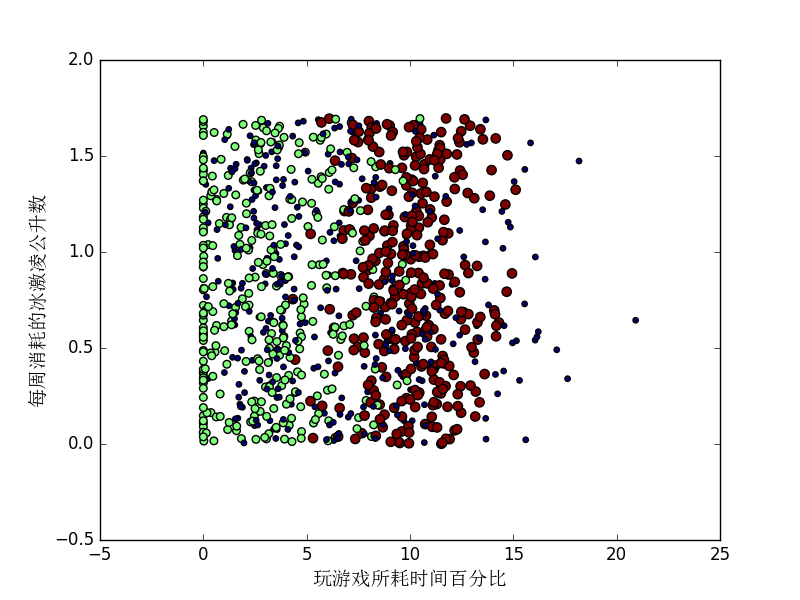
运行这页下面的代码就可以画出不同颜色的散点,关于scatter的应用,可以查看文档,http://matplotlib.org/api/pyplot_api.html?highlight=scatter#matplotlib.pyplot.scatter

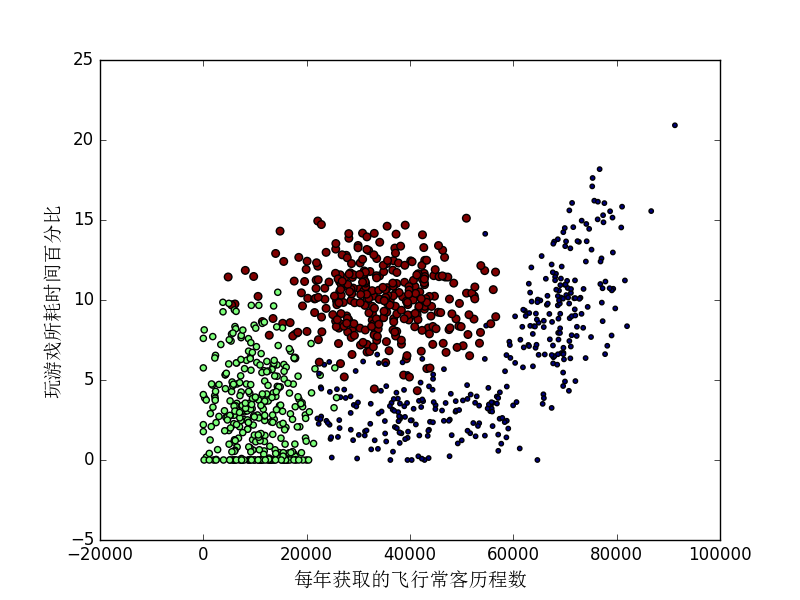
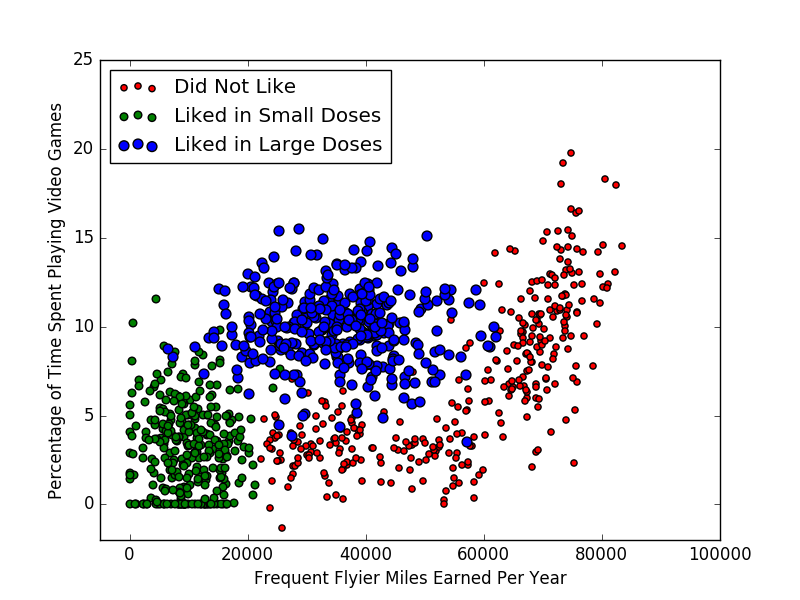
但是我们发现最后一张图片和P24页下面还不一样,缺少一个对不同颜色点的备注,我从网上找到的一段代码,供大家学习和参考:
'''
Created on Oct 6, 2010

@author: Peter
'''
from numpy import *
import matplotlib
import matplotlib.pyplot as plt
from matplotlib.patches import Rectangle


n = 1000 #number of points to create
xcord1 = []; ycord1 = []
xcord2 = []; ycord2 = []
xcord3 = []; ycord3 = []
markers =[]
colors =[]
fw = open('testSet.txt','w')
for i in range(n):
    [r0,r1] = random.standard_normal(2)
    myClass = random.uniform(0,1)
    if (myClass <= 0.16):
        fFlyer = random.uniform(22000, 60000)
        tats = 3 + 1.6*r1
        markers.append(20)
        colors.append(2.1)
        classLabel = 1 #'didntLike'
        xcord1.append(fFlyer); ycord1.append(tats)
    elif ((myClass > 0.16) and (myClass <= 0.33)):
        fFlyer = 6000*r0 + 70000
        tats = 10 + 3*r1 + 2*r0
        markers.append(20)
        colors.append(1.1)
        classLabel = 1 #'didntLike'
        if (tats < 0): tats =0
        if (fFlyer < 0): fFlyer =0
        xcord1.append(fFlyer); ycord1.append(tats)
    elif ((myClass > 0.33) and (myClass <= 0.66)):
        fFlyer = 5000*r0 + 10000
        tats = 3 + 2.8*r1
        markers.append(30)
        colors.append(1.1)
        classLabel = 2 #'smallDoses'
        if (tats < 0): tats =0
        if (fFlyer < 0): fFlyer =0
        xcord2.append(fFlyer); ycord2.append(tats)
    else:
        fFlyer = 10000*r0 + 35000
        tats = 10 + 2.0*r1
        markers.append(50)
        colors.append(0.1)
        classLabel = 3 #'largeDoses'
        if (tats < 0): tats =0
        if (fFlyer < 0): fFlyer =0
        xcord3.append(fFlyer); ycord3.append(tats)

fw.close()
fig = plt.figure()
ax = fig.add_subplot(111)
#ax.scatter(xcord,ycord, c=colors, s=markers)
type1 = ax.scatter(xcord1, ycord1, s=20, c='red')
type2 = ax.scatter(xcord2, ycord2, s=30, c='green')
type3 = ax.scatter(xcord3, ycord3, s=50, c='blue')
ax.legend([type1, type2, type3], ["Did Not Like", "Liked in Small Doses", "Liked in Large Doses"], loc=2)
ax.axis([-5000,100000,-2,25])
plt.xlabel('Frequent Flyier Miles Earned Per Year')
plt.ylabel('Percentage of Time Spent Playing Vid
eo Games')
plt.show()
书中代码文件:http://pan.baidu.com/s/1bnbonnx
学习进度慢,下一节得到周末学了。还有好多报告,作业要写,论文要看。
请大家多多指教!


 2336
2336


 被折叠的 条评论
为什么被折叠?
被折叠的 条评论
为什么被折叠?
 到【灌水乐园】发言


