


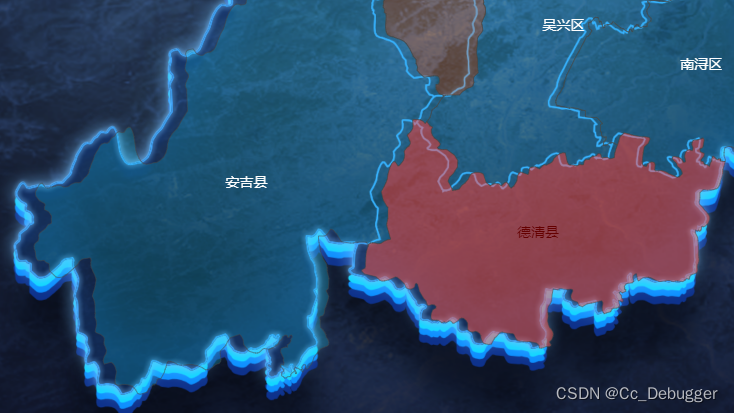
红色为点击后颜色
设置selectedMode 可设置点击单个/多个区域
  series: [
                {
                    type: 'map',
                    map: 'area',
                    selectedMode: 'single',
                }
              ]
select / areaColor: “rgba(255, 88, 78, .5)”,设置点击区域得颜色,可设置透明度
select: {
            itemStyle: {
                color: '#fff',
                areaColor: "rgba(255, 88, 78, .5)",
                // borderColor: '#000',
                // borderWidth: 20
            },

        },
  showChart() {
        let chart = echarts.init(document.getElementById('map'))
        var mapJson = huzhouJsonData
        echarts.registerMap('area', mapJson);
        var outdata = []; //地图区域挂载数据
        var maxData = parseInt(this.mapData[0].value); //热力最大值
        var minData = parseInt(this.mapData[0].value); //热力最小值
        this.mapData.forEach(function (item, index) {
            var num = parseInt(item.value);
            num >= maxData && (maxData = num);
            num <= minData && (minData = num);
            outdata.push({
                name: item.name,
                value: item.value,
                index: index,
            });
            // console.log(outdata)
        });
        let option = {
            select: {
                itemStyle: {
                    color: '#fff',
                    areaColor: "rgba(255, 88, 78, .5)",
                    // borderColor: '#000',
                    // borderWidth: 20
                },

            },
            dataRange: {
                show: false,
                x: "right",
                backgroundColor: 'rgba(0,0,0,0)',
                padding: 5,                // 值域内边距,单位px,默认各方向内边距为5,
                // 接受数组分别设定上右下左边距,同css
                itemGap: 10,               // 各个item之间的间隔,单位px,默认为10,
                // 横向布局时为水平间隔,纵向布局时为纵向间隔
                itemWidth: 20,             // 值域图形宽度,线性渐变水平布局宽度为该值 * 10
                itemHeight: 14,            // 值域图形高度,线性渐变垂直布局高度为该值 * 10
                splitNumber: 5,            // 分割段数,默认为5,为0时为线性渐变
                color: ['#1e90ff', '#f0ffff'],//颜色
                borderColor: '#ccc',       // 值域边框颜色
                borderWidth: 10,            // 值域边框线宽,单位px,默认为0(无边框)
                textStyle: {
                    color: '#fff'
                },
                y: "bottom",
                splitList: [
                    { start: 50, end: 100, color: "rgba(12, 222, 255, 0.2)" },
                    { start: 0, end: 49, color: "rgba(255, 129, 19, 0.25)" },
                ],
            },

            series: [
                {
                    type: 'map',
                    map: 'area',
                    selectedMode: 'single',
                    aspectScale: 0.73,
                    layoutCenter: ['50%', '51%'], //地图位置
                    layoutSize: '100%',
                    // borderWidth: 20,
                    // borderColor: "#ccc",

                    itemStyle: {
                    // 正常区域渐变色
                        normal: {
                            // borderColor: 'rgba(12, 222, 255, 1)',
                            // borderWidth: 0.8,
                            areaColor: {
                                type: 'linear-gradient',
                                x: 0,
                                y: 300,
                                x2: 0,
                                y2: 0,
                                colorStops: [
                                    {
                                        offset: 0,
                                        color: 'rgba(0,0,0, 0)', // 0% 处的颜色
                                    },
                                    {
                                        offset: 1,
                                        color: 'rgba(0,0,0, 0)',
                                    },
                                ],
                                global: true, // 缺省为 false
                            },
                        },
                        // 高亮区域渐变色
                        emphasis: {
                            shadowColor: 'rgba(0, 0, 0, 1)',
                            shadowBlur: 10,
                            shadowOffsetX: 5,
                            shadowOffsetY: 5,
                            areaColor: {
                                type: 'linear-gradient',
                                x: 0,
                                y: 0,
                                x2: 0,
                                y2: 1,
                                colorStops: [
                                    {
                                        offset: 0,
                                        color: 'rgba(243, 174, 48, 0)', // 0% 处的颜色
                                    },
                                    {
                                        offset: 1,
                                        color: 'rgba(243, 174, 48, 0)',
                                    },
                                ],
                            },
                        },
                    },
                    label: {
                        normal: {
                            show: true,
                            fontFamily: 'SourceHanSansCN',
                            fontSize: '14',
                            color: '#FEFEFE',
                        },
                        emphasis: {
                            show: true,
                            fontFamily: 'SourceHanSansCN',
                            fontSize: '14',
                            color: '#FEFEFE',
                        },
                    },
                    zlevel: 1,
                    data: outdata,
                },
            ],
        }
        let that = this
        chart.on("click", function (params) {
            console.log(params.event.offsetX);
            that.mapName = params.name
            that.dialogX = params.event.offsetX
            that.dialogY = params.event.offsetY

            that.dialogDataClick = that.dialogData[params.name]
            that.dialogShow = true

        });

        chart.clear();
        chart.setOption(option);
        window.addEventListener('resize', function () {
            chart.resize();
        });
    },


 2561
2561


 被折叠的 条评论
为什么被折叠?
被折叠的 条评论
为什么被折叠?
 到【灌水乐园】发言


