


 本文介绍了一个关于iView-Admin框架中ECharts图表被压缩到100px的问题及解决方案。当使用框架自带的tab缓存机制时,在窗口缩放后切换回原页面会导致ECharts被压缩。文章详细介绍了如何通过调整Vue组件的生命周期钩子来解决此问题。
我使用的的时iview-admin这个后台,其中开启了该框架自带的切换tab的缓存机制(keepAlive)
但是我的情况跟其他的网友遇到可能又不一样,我如果只是单纯的切换Tab页面,是不会导致压缩的,但是,我切换页面以后,在其他页面有进行窗口缩放,再切换回原来的页面,就会导致echart被压缩到100px
我对echart的style设置是:{height: 350px; width: 100%;}
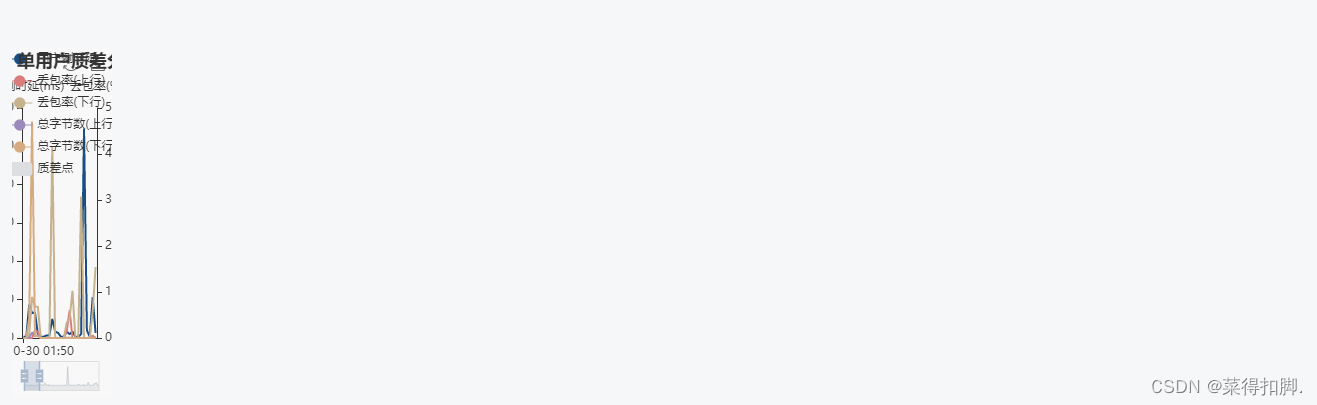
原因可能也是因为:元素本身就是存在的,只是样式被设置为display:none,如果width不是写死的情况,那么echart对图像最小默认为100px,所以就出现下面我展示的样式了
并且,因为的echart的文件,因为多处复用,被我单独的抽离了出来,所以,每次实例化的时候,是在抽离出来的echart文件内进行初始化,而不是在使用视图文件内进行初始化,所以不能在视图页面监听页面的宽度变化后,再重新绘制echart图
我的echart文件,这儿就命名为:lineChart.vue,里面就只是一个空架子,里面的很多属性,每次都是通过value进行传值进来的
<template>
  <div ref="dom"></div>
</template>

<script>
import echarts from 'echarts'
import { on, off } from '@/libs/tools'
import 'echarts/theme/vintage.js'

export default {
  name: "lineChart",
  props: {
    value: {
      type: Object,
      default:()=>{}
    }
  },
  data () {
    return {
      dom: null
    }
  },
  watch: {
    //观察option的变化
    value: {
      handler(newVal, oldVal) {
        if (this.dom) {
          if (newVal) {
            this.dom.clear();
            // this.dom.setOption(newVal);
            this.init();
          } else {
            this.dom.setOption(oldVal);
          }
        } else {
          this.init();
        }
      },
      deep: true //对象内部属性的监听,关键。
    }
  },

  methods: {
    resize () {
      this.dom.resize()
    },

    init() {
      let _this = this;
      this.$nextTick(() => {
        let toolbox = {
            show: true,
            orient: 'vertical',
            left: 'right',
            top: 'center',
            feature: {
              mark: {show: true},
              dataView: {show: true, readOnly: false},
              magicType: {show: true, type: ['line', 'bar', 'stack', 'tiled']},
              restore: {show: true},
              saveAsImage: {show: true}
            }
          };
        let tooltip = {
          trigger: 'axis',
          axisPointer: {
            type: 'cross'
          }
        };
        let option = {
          title: this.value.title,
          tooltip: this.value.tooltip || tooltip,
          legend: this.value.legend || {show: false},
          toolbox: this.value.toolbox || toolbox,
          dataZoom: this.value.dataZoom || {show: false},
          grid: this.value.grid || {},
          xAxis: this.value.xAxis || {},
          yAxis: this.value.yAxis || {},
          series: this.value.series || []
        };
        this.dom = echarts.init(this.$refs.dom, 'vintage');
        this.dom.off('click');
        this.dom.setOption(option);
        on(window, 'resize', this.resize)
      });
    }
  },

  mounted () {
    this.init();
  },

  beforeDestroy () {
    off(window, 'resize', this.resize)
  }
}

</script>
而我在我的视图文件内,引入了lineChart.vue,这个文件我就直接简写了,其中逻辑我直接忽略了
lineChart.vue通过我value接收我传递过去的chartData数据,而通过监听value的变化,去刷新与绘制echart图
<template>
  <Row>
    <lineChart :value="chartData" style="height: 350px; width:100%" />
  </Row>
</template>

<script>
import lineChart from '@/view/chart/lineChart.vue';

export default {
  name: "test",
  components: {
    lineChart,
  },
  data () {
    return {
      chartData: {}
    }
  },

  mounted() {
  },

  watch: {
  },

  methods: {
  }
}

</script>
但是,关键是!!!!!!!
需要在lineChart.vue内添加上activated这个生命周期钩子,只会在挂载后和更新前被调用,如果该组件中没有使用缓存,则activated是不起作用的
他的作用就是,当你该页面缓存以后,切换到其他页面,再次切换回来的时候,调用!!!!
activated() {
    if (this.dom) {
        this.dom.resize();
    }
  },


 被折叠的 条评论
为什么被折叠?
被折叠的 条评论
为什么被折叠?
 到【灌水乐园】发言


