


zabbix监控Mysql各项指标步骤详解
一、安装MySQL
1、第一步关闭防火墙
 # systemctl stop  firewalld
 # systemctl disable  firewalld
 # setenforce 0
 # vim  /etc/selinux/config——>SELINUX=disabled
2、然后下载MySQL常用相关工具
 #yum -y install wget
 # yum -y install vim
 #yum -y install  lrzsz
3、上传Mysql相关配置文件(提前下载好的软件包)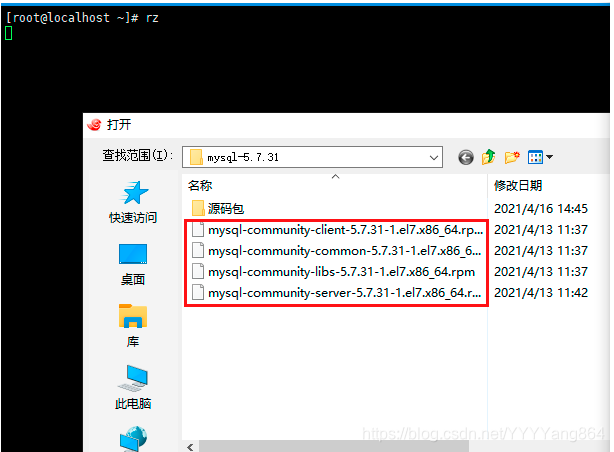 4、下载相关软件
[root@localhost ~]# yum install -y net-tools.x86_64 libaio.x86_64 perl.x86_64
5、安装Mysql
[root@localhost ~]# yum remove -y mariadb-libs.x86_64   //卸载mariadb于mysql冲突
[root@localhost ~]# yum install -y mysql-community*    //安装上传的源码包
6、启动Mysql
[root@localhost ~]#systemctl start mysqld
[root@localhost ~]#systemctl enable mysqld
[root@localhost ~]#systemctl status mysqld
7、修改Mysql默认密码
[root@localhost ~]# grep ‘password’ /var/log/mysqld.log //查看默认密码,复制 (查不到的话,格式问题手敲
[root@localhost ~]# mysqladmin -uroot -p’上步复制的密码’ password ‘新密码’  //冒号和空格的后面,全都是密码全要复制
8、登录数据库
[root@localhost ~]# mysql -uroot -p’新密码’
9、设置授权用户和密码,使监控端zabbix-server能用这个身份登录数据库监听数据
[root@zabbix-agent-none1 ~]# vim /etc/my.cnf
在配置文件中末行插入:
[client]
default-character-set=utf8
host=localhost
user='zabbix'
password='Yang@123'
10、进入数据库授权用户和密码
[root@zabbix-agent-none1 ~]# mysql -uroot -p'Yang@123'   //登录数据库
[root@zabbix-agent-none1 ~]# mysql -uroot -p
Enter password:    //密码为Yuanwei@123
mysql>  grant all privileges on *.* to zabbix@localhost identified by 'Yang@123';       //给zabbix用户授权
mysql> flush privileges;  //刷新数据库权限
exit
11、定义MySQL监控变量
[root@zabbix-agentnone1~]#vim/etc/zabbix/zabbix_agentd.d/userparameter_mysql.conf     //编辑MySQL配置文件
在末行添加所监控的内容:
类如:
#监控MySQL版本
UserParameter=mysql.version,mysql -V | cut -f6 -d" " | sed 's/,//'
#监控MySQL进程数
UserParameter=mysql.process,ps -ef|grep "mysql"|grep -v "grep"|wc -l
#监控MySQL运行状态
UserParameter=mysql.ping,/usr/bin/mysqladmin ping|grep alive|wc -l
#监控MySQL运行时间
UserParameter=mysql.uptime,/usr/bin/mysqladmin extended-status|grep Uptime|head -1|cut -f3 -d"|"
#监控MySQL的连接数
UserParameter=mysql.Threads.connected,/usr/bin/mysqladmin extended-status|grep Threads_connected|head -1|cut -f3 -d"|"
#监控MySQL活动状态的连接数
UserParameter=mysql.Threads.running,/usr/bin/mysqladmin extended-status|grep Threads_running|head -1|cut -f3 -d"|"
#监控MySQL客户端异常中断的数值
UserParameter=mysql.aborted.clients,/usr/bin/mysqladmin extended-status|grep Aborted_clients|head -1|cut -f3 -d"|"
#监控MySQL主从状态
UserParameter=mysql.Slave.status,/usr/bin/mysqladmin extended-status|grep Slave_runnin | grep -o ON |wc -l
#监控MySQL每秒钟获得的查询量
UserParameter=mysql.questions,/usr/bin/mysqladmin extended-status | grep Questions | head -1 | cut -f3 -d"|"
#监控MySQL从数据文件里取数据的次数
UserParameter=mysql.read.rnd,/usr/bin/mysqladmin extended-status|grep Handler_read_rnd_next|head -1 | cut -f3 -d"|"
#监控MySQL往数据文件里写数据的次数
UserParameter=mysql.write.rnd,/usr/bin/mysqladmin extended-status|grep Handler_write|head -1|cut -f3 -d"|"
#监控MySQL内部COMMIT命令的个数
UserParameter=mysql.commit,/usr/bin/mysqladmin extended-status|grep Handler_commit| head -1 | cut -f3 -d"|"
#监控MySQL请求从一张表中删除行的次数。
UserParameter=mysql.delete,/usr/bin/mysqladmin extended-status|grep Handler_delete| head -1 | cut -f3 -d"|"
#监控MySQL表缓存没有命中的数量
UserParameter=mysql.Opened.tables,/usr/bin/mysqladmin extended-status|grep Opened_tables| head -1 | cut -f3 -d"|"
#监控MySQL没有使用索引查询数量
UserParameter=mysql.slowqueries,/usr/bin/mysqladmin extended-status|grep Slow_queries|cut -f3 -d"|"
#监控MySQL执行全表搜索查询的数量
UserParameter=mysql.select.scan,/usr/bin/mysqladmin extended-status|grep Select_scan|cut -f3 -d"|"
12、重启MySQL被监控端agent
[root@zabbix-agent-none1 ~]# systemctl restart zabbix-agent
13、在监控端进行测试
[root@zabbix-agent-none1 ~]# zabbix_get -s 192.168.239.143 -p 10050 -k "mysql.Threads.connected"

14、来到监控端Web界面创建应用集–>监控项–>图形


 1万+
1万+


 被折叠的 条评论
为什么被折叠?
被折叠的 条评论
为什么被折叠?
 到【灌水乐园】发言


