


项目平台——项目首页设计(五)
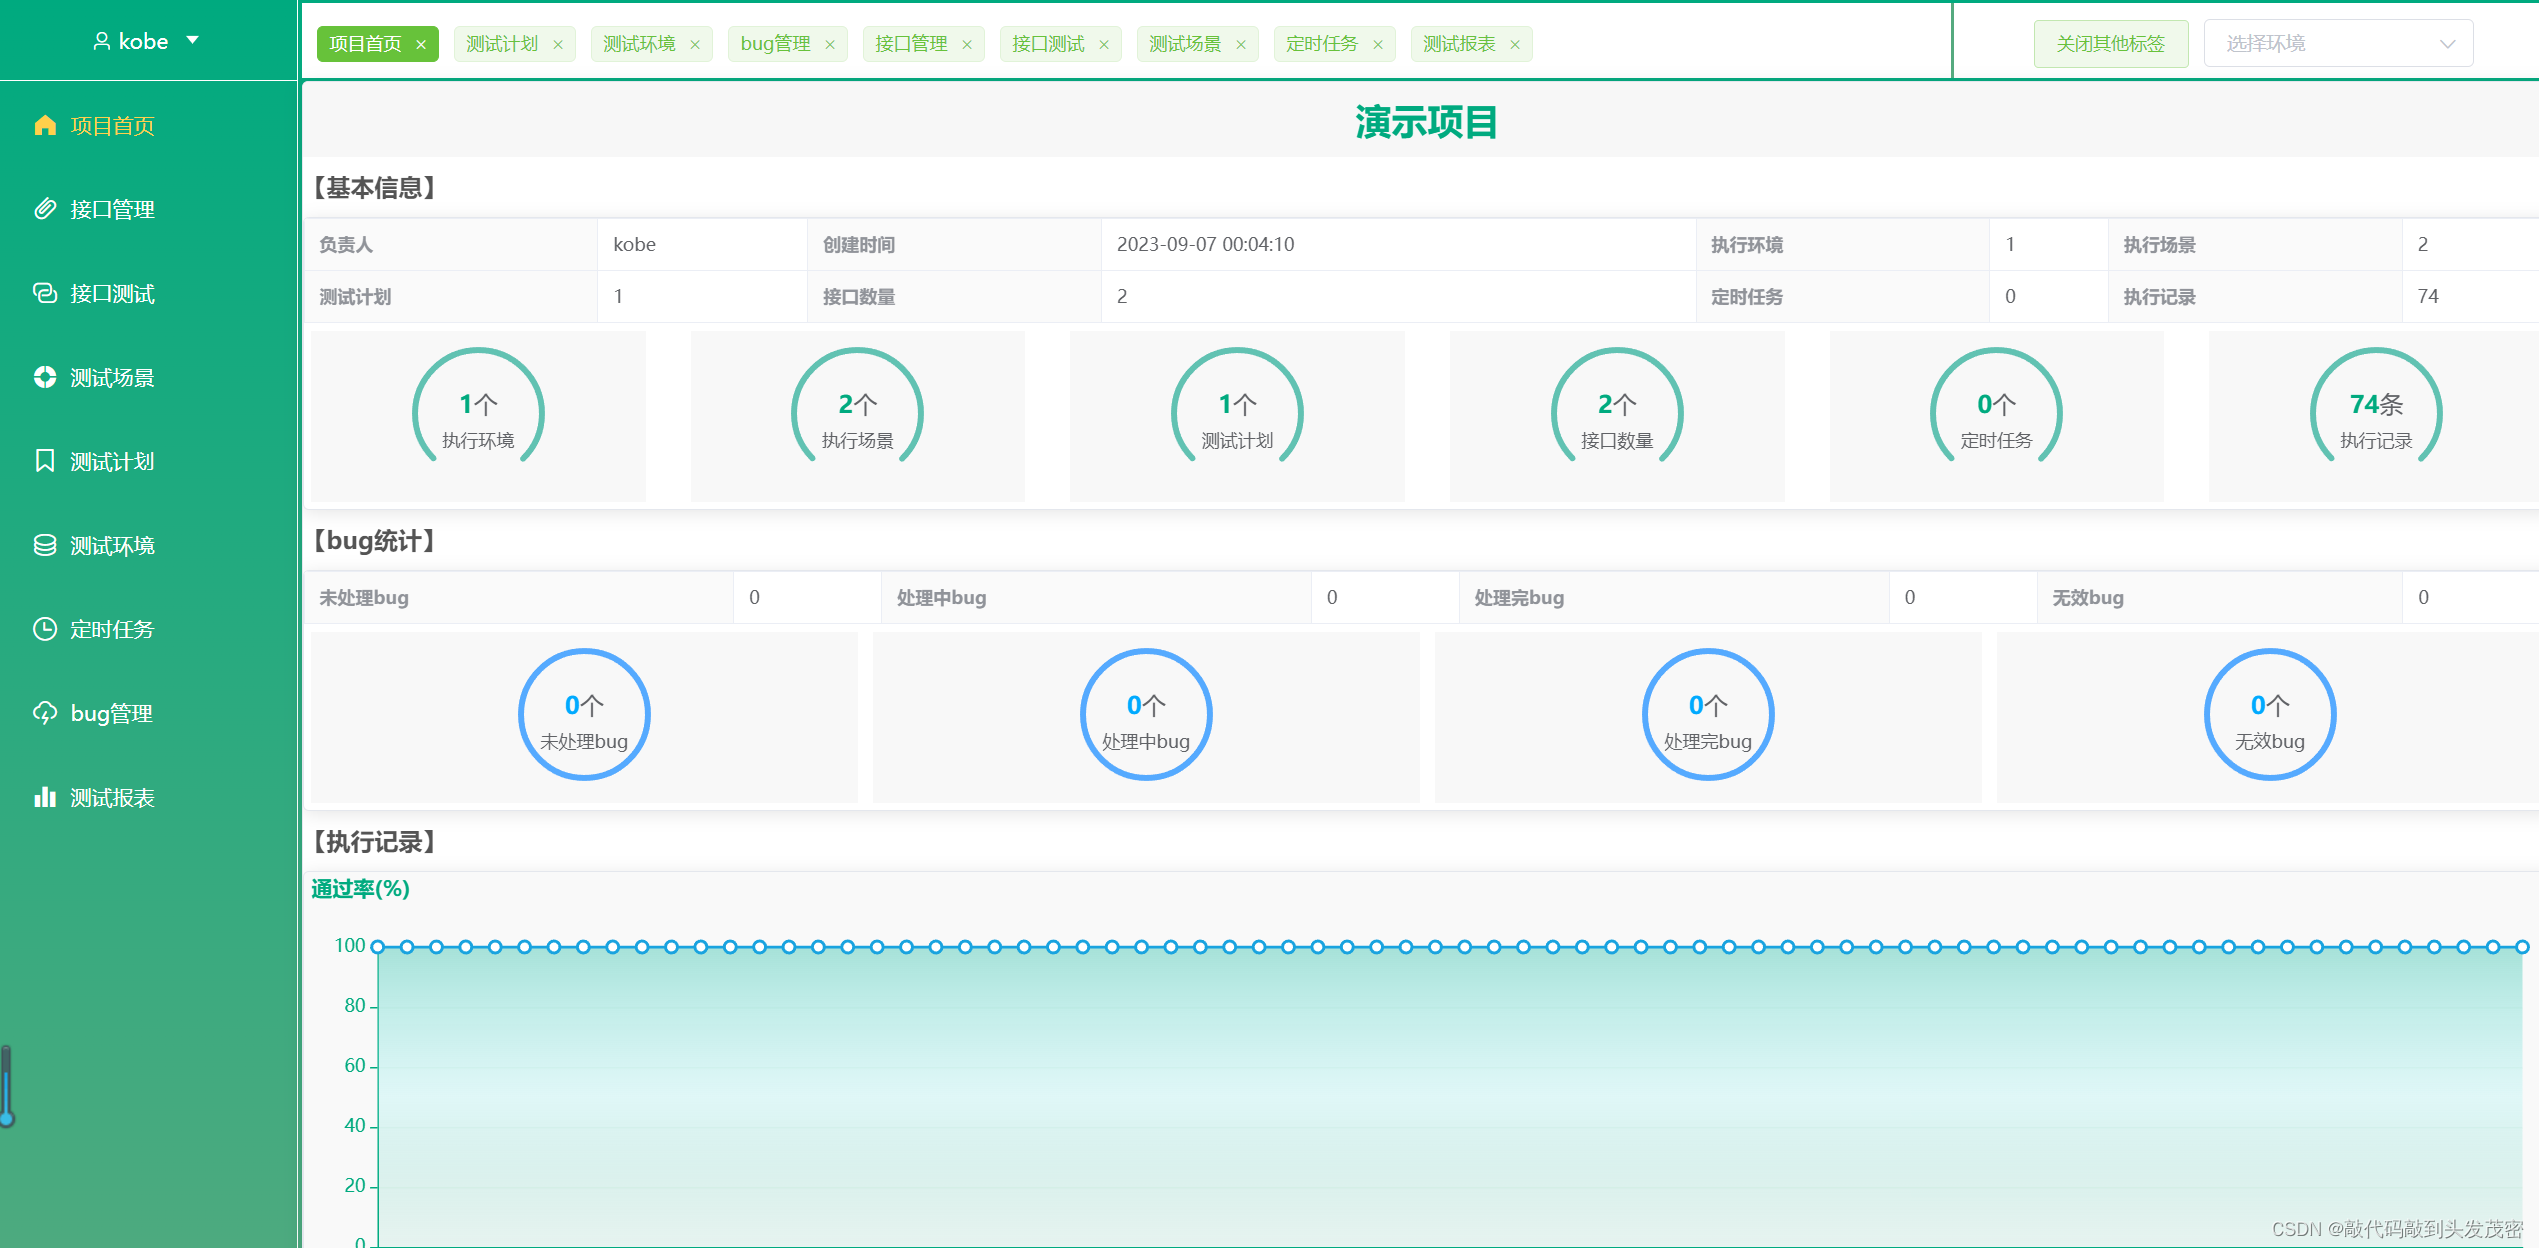
一、页面成果图展示
二、滚动条组件的使用
当内容超过屏幕高度时自动产生滚动条
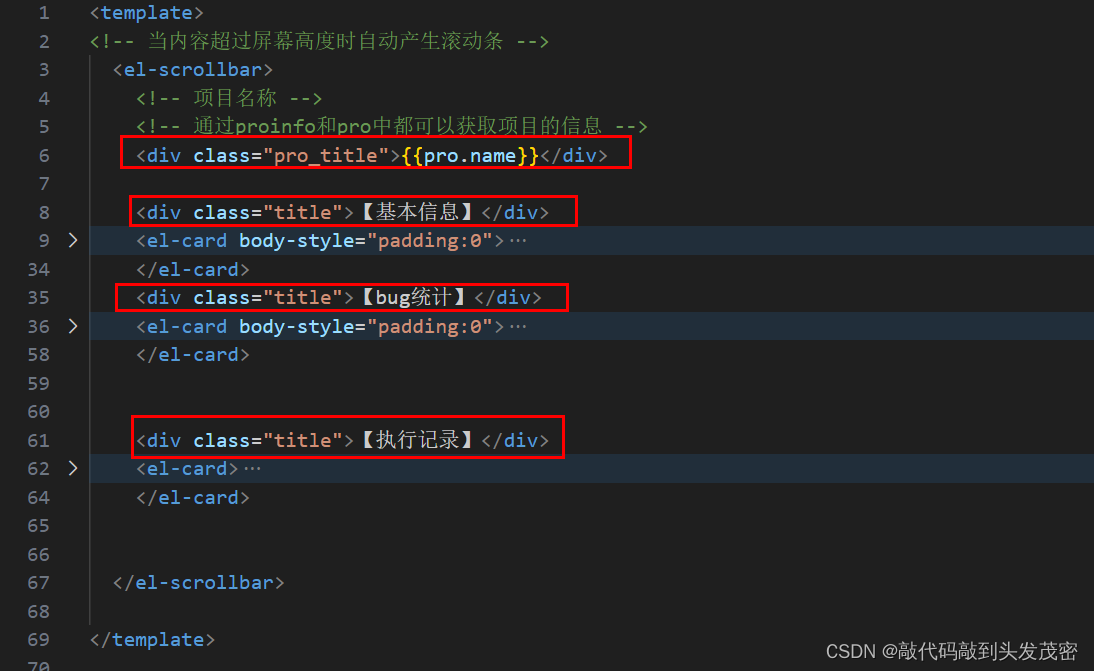
<template>
<!-- 当内容超过屏幕高度时自动产生滚动条 -->
  <el-scrollbar>
	...
	...
	...
  </el-scrollbar>
</template>
三、页面设计
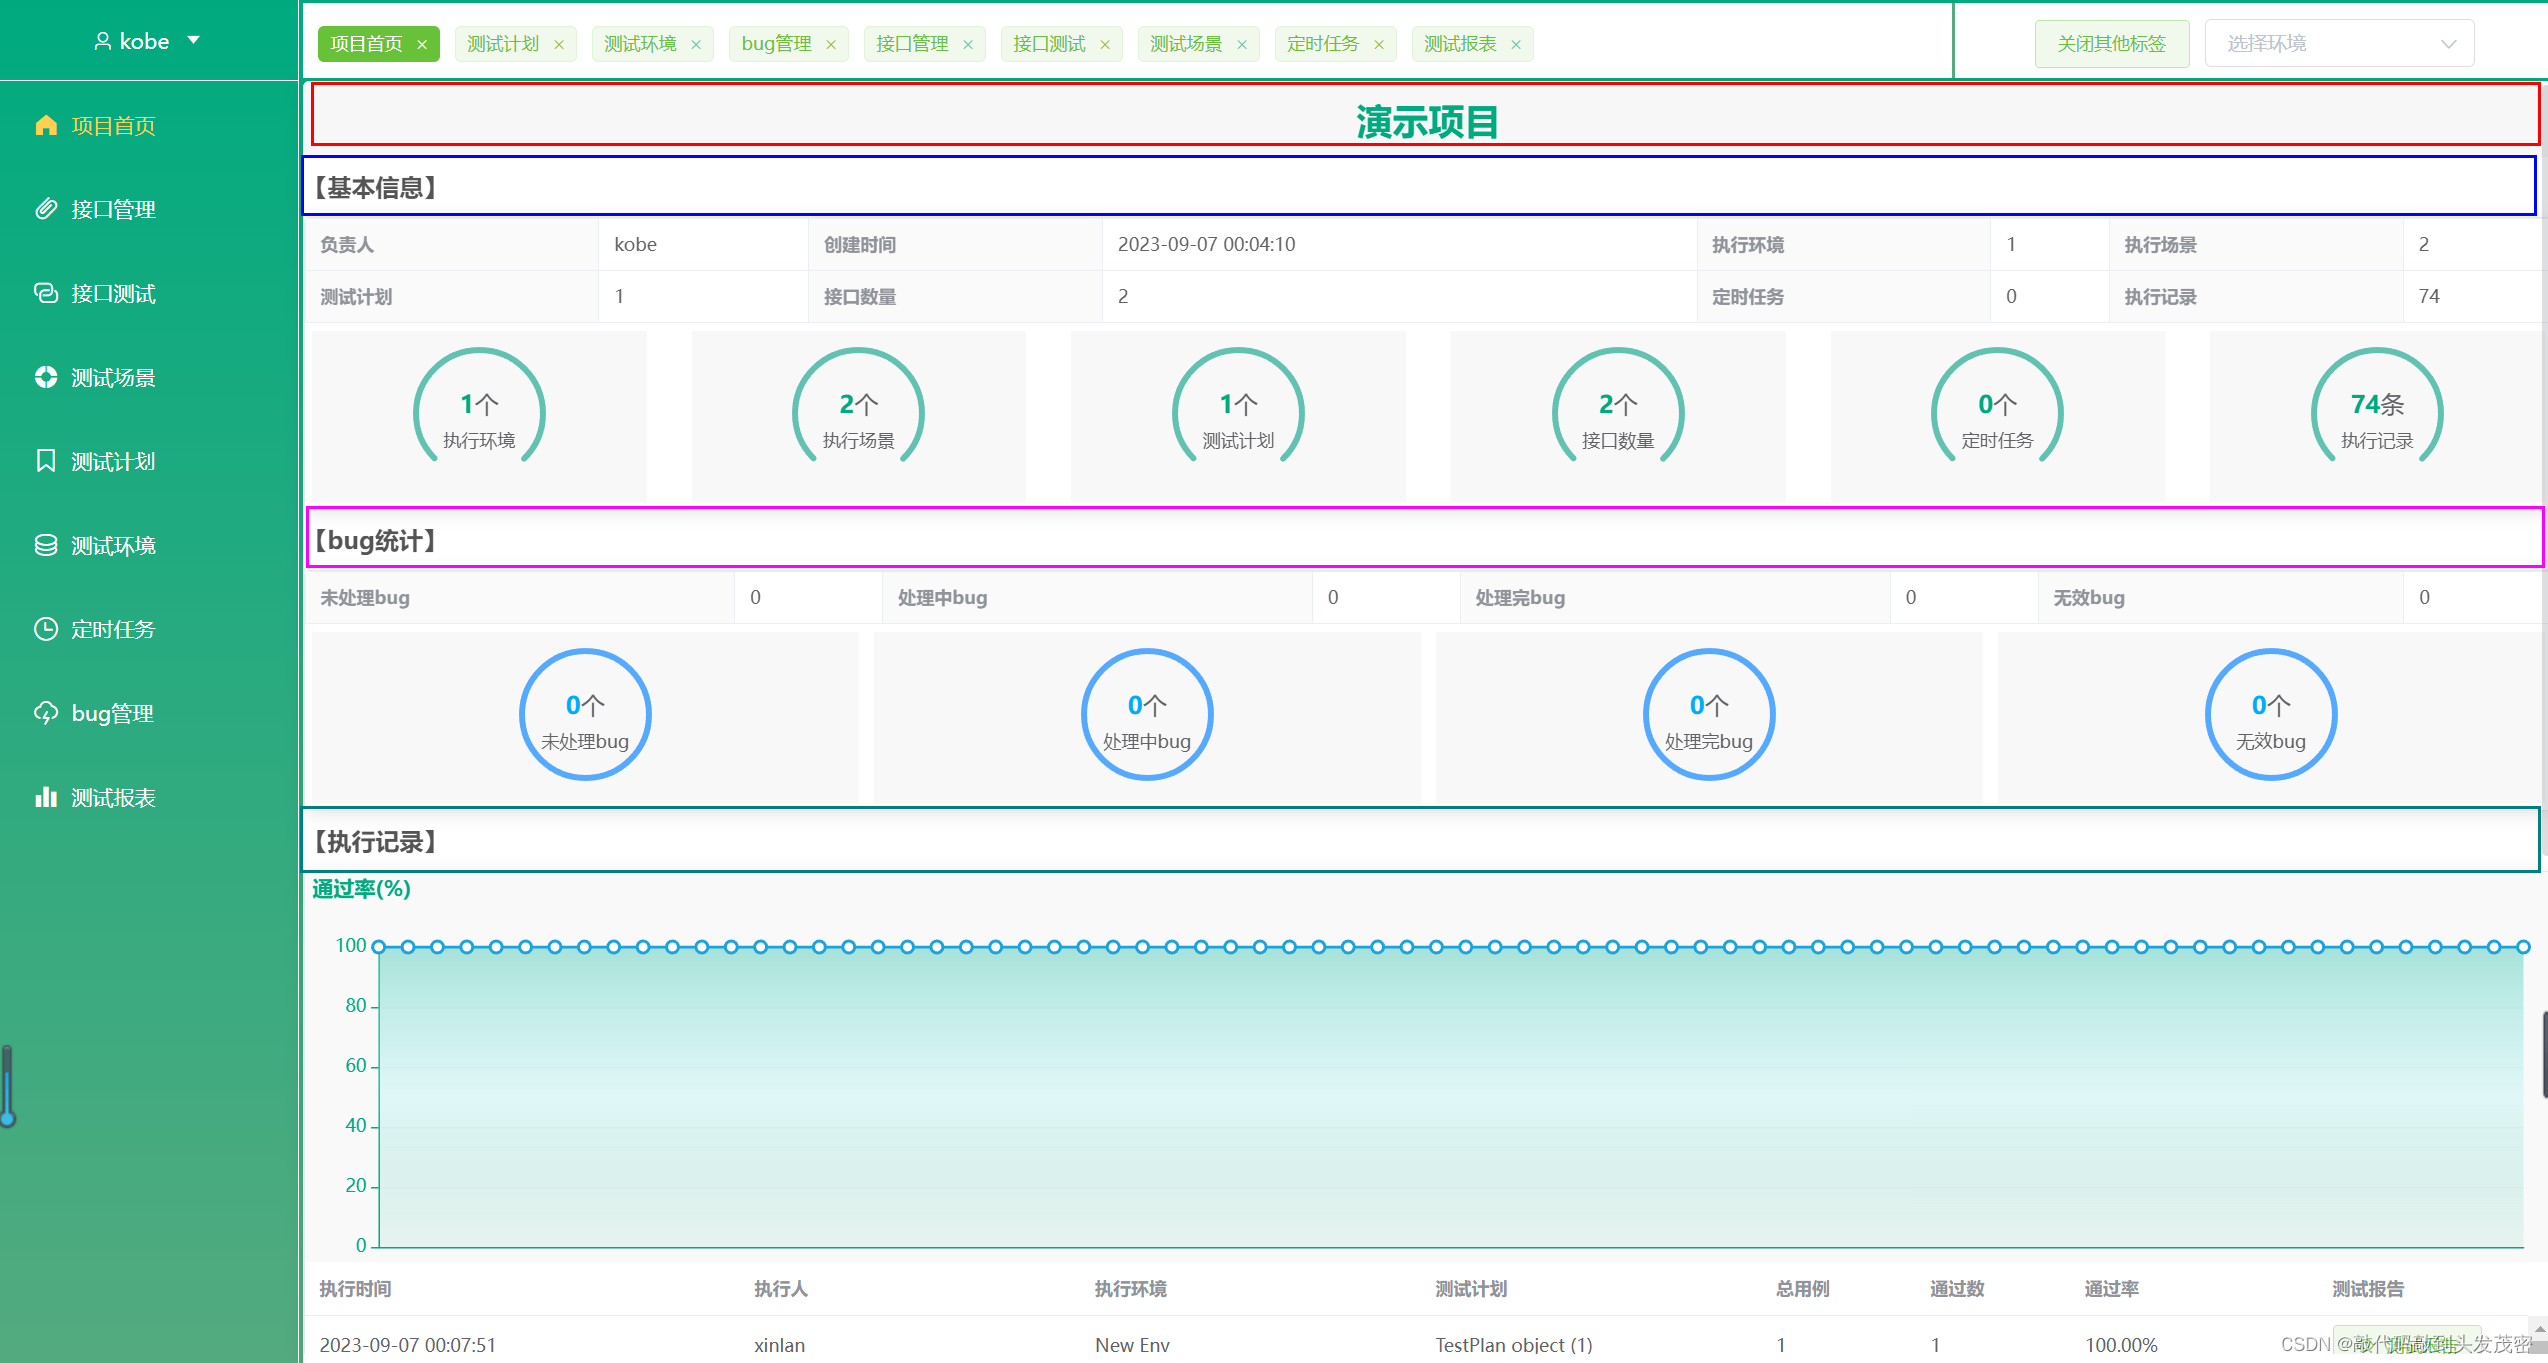
1、需要4个盒子
2、项目名称样式设计
<!-- 项目名称 -->
<!-- 通过proinfo和pro中都可以获取项目的信息 -->
<div class="pro_title">{{pro.name}}</div>
/* 项目标题样式 */
	.pro_title{
		height: 50px;  行高
		background: #ececeb;  背景
		text-align: center;   居中
		font: bold 28px/50px '微软雅黑';  字体加粗、大小/行高、字体
		color: rgb(21, 192, 135);
	}
3、对基本信息、bug统计、执行记录进行样式设计
/* 小标题样式 */
	.title{
		/* 加粗 */
		font-weight: bold;
		line-height: 40px;
		color: #363636;
	}
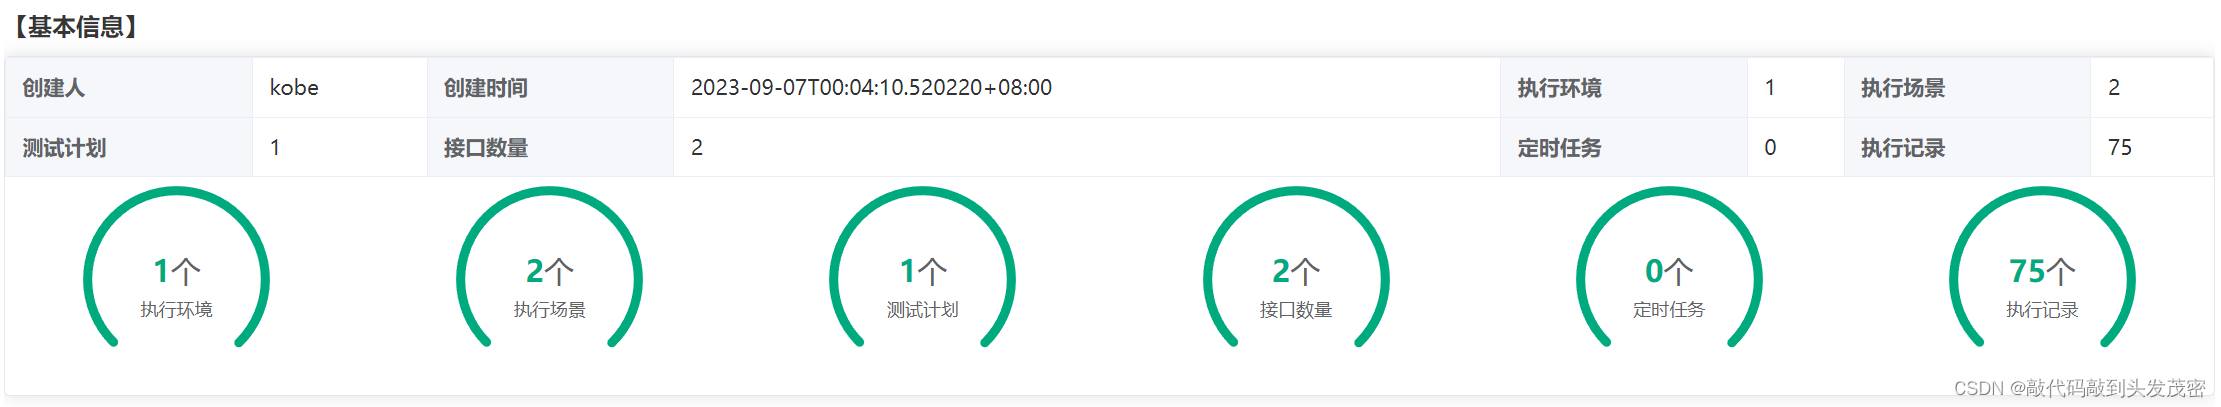
4、基本信息
element-plus中描述列表使用
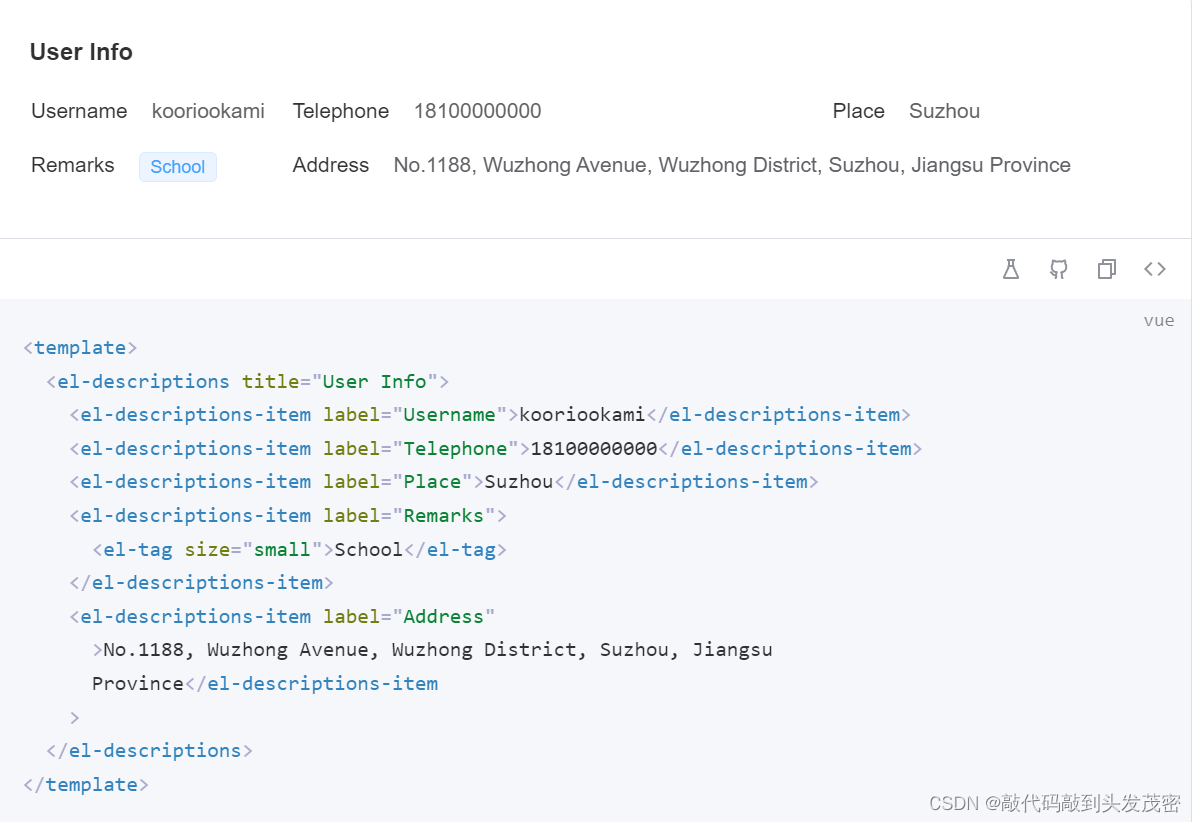
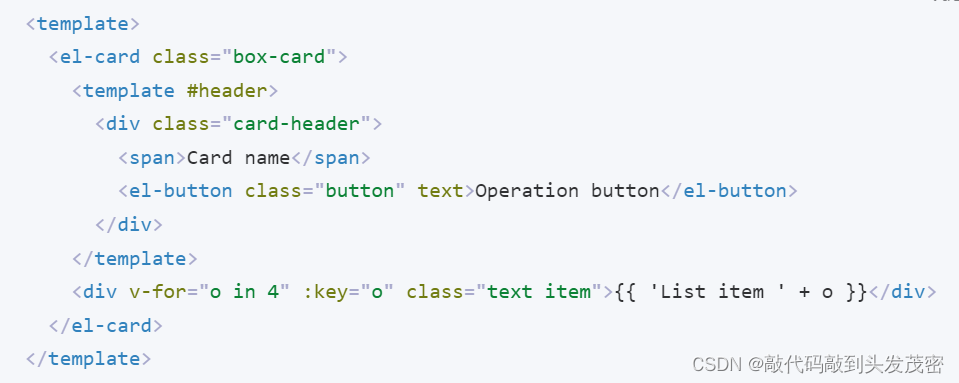
element-plus中卡片组件使用
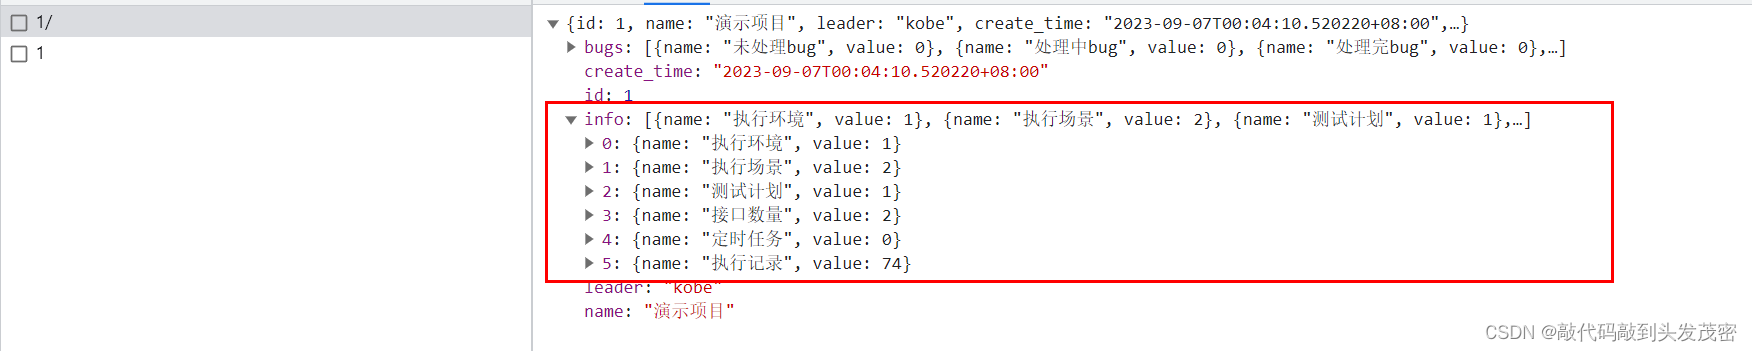
从后端接口的返回值可以看到,前端不必要定义所有的字段
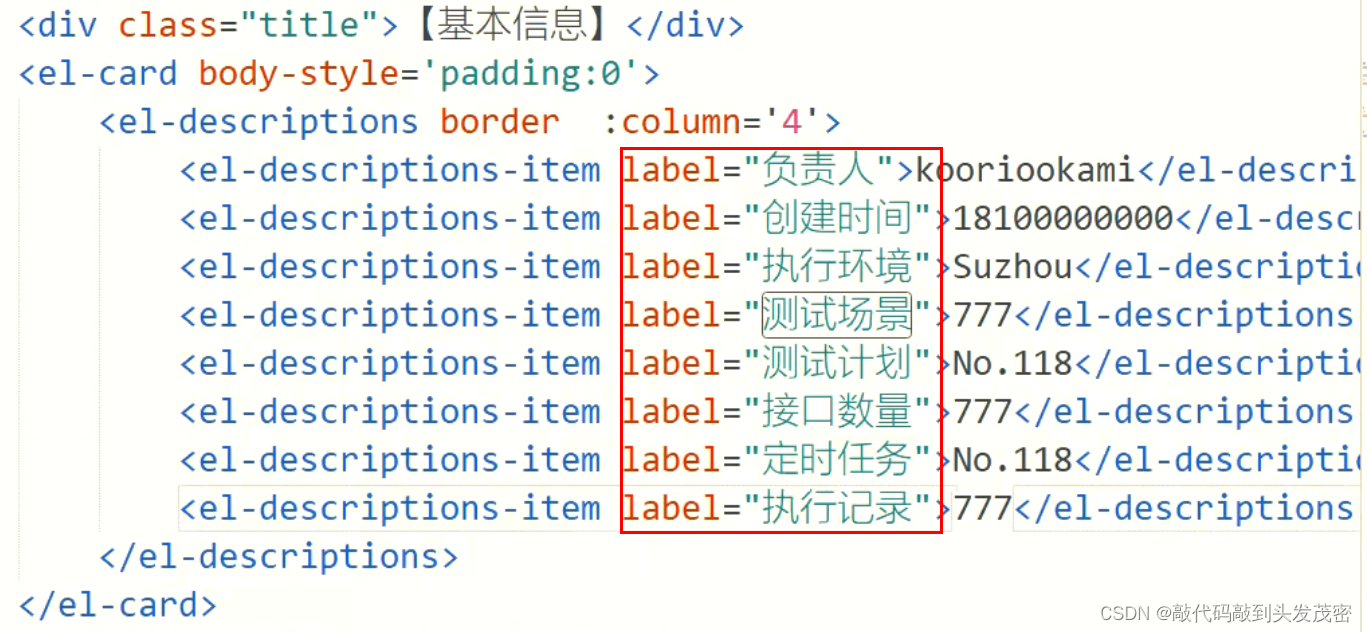
描述列表中label指定描述列表的名字,后面的值对应接口返回的值
通过v-for实现
<div class="title">【基本信息】</div>
	<el-card body-style="padding:0">
		<el-descriptions border column="4">
		<el-descriptions-item label="创建人">{{pro.leader}}</el-descriptions-item>
		<el-descriptions-item label="创建时间">{{pro.create_time}}</el-descriptions-item>
		<el-descriptions-item v-for='(item,index) in proinfo.info' :key="index" :label="item.name">{{item.value}}</el-descriptions-item>
  		</el-descriptions>
	</el-card>
结果展示

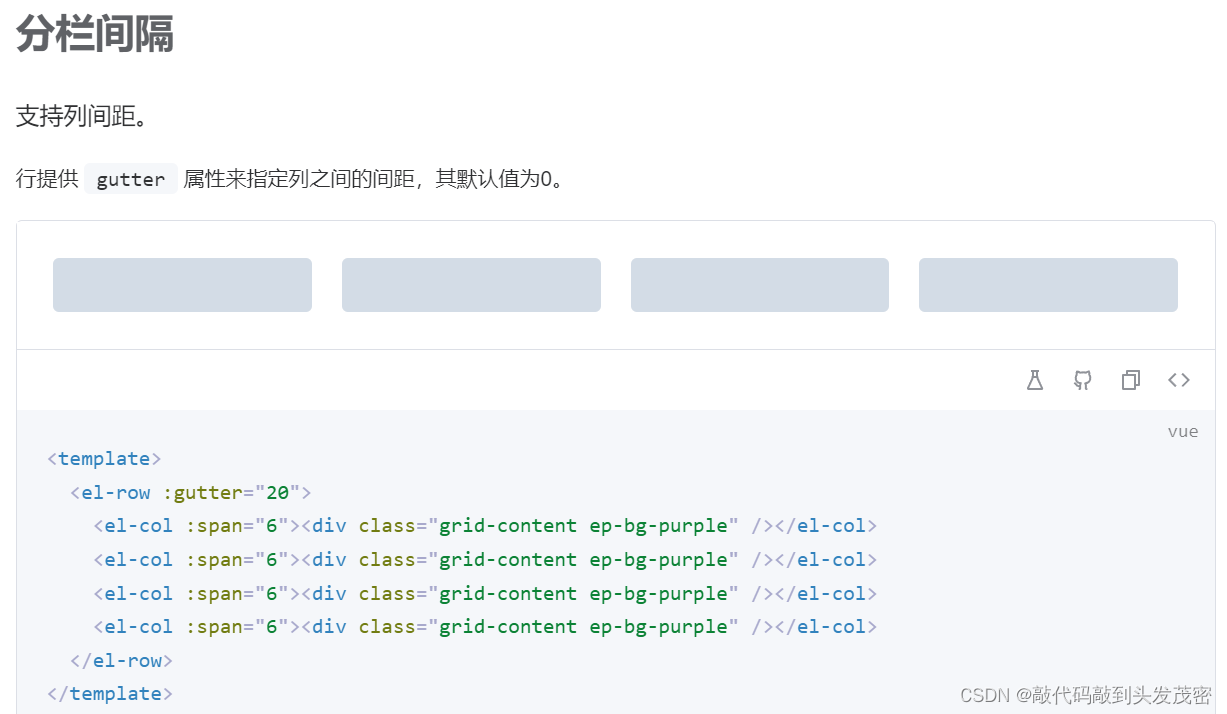
element-plus中layout布局的使用
<div class="title">【基本信息】</div>
	<el-card body-style="padding:0">
		<el-descriptions border column="4">
		<el-descriptions-item label="创建人">{{pro.leader}}</el-descriptions-item>
		<el-descriptions-item label="创建时间">{{pro.create_time}}</el-descriptions-item>
		<el-descriptions-item v-for='(item,index) in proinfo.info' :key="index" :label="item.name">{{item.value}}</el-descriptions-item>
  		</el-descriptions>

		<el-row :gutter="20">
			<el-col :span="4" v-for="(item,index) in proinfo.info" :key="index">
				<div class="info_chart">
					<el-progress type="dashboard" :percentage="100" color="#00aa7f">
						<template #default>
							<span class="percentage-value">
								<b style="color:#00aa7f">{{item.value}}</b>
								<span>个</span>
							</span>
							<span class="percentage-label">{{item.name}}</span>
						</template>
					</el-progress>
				</div>
			</el-col>
			<el-col :span="4"><div class="info_chart" /></el-col>

		</el-row>
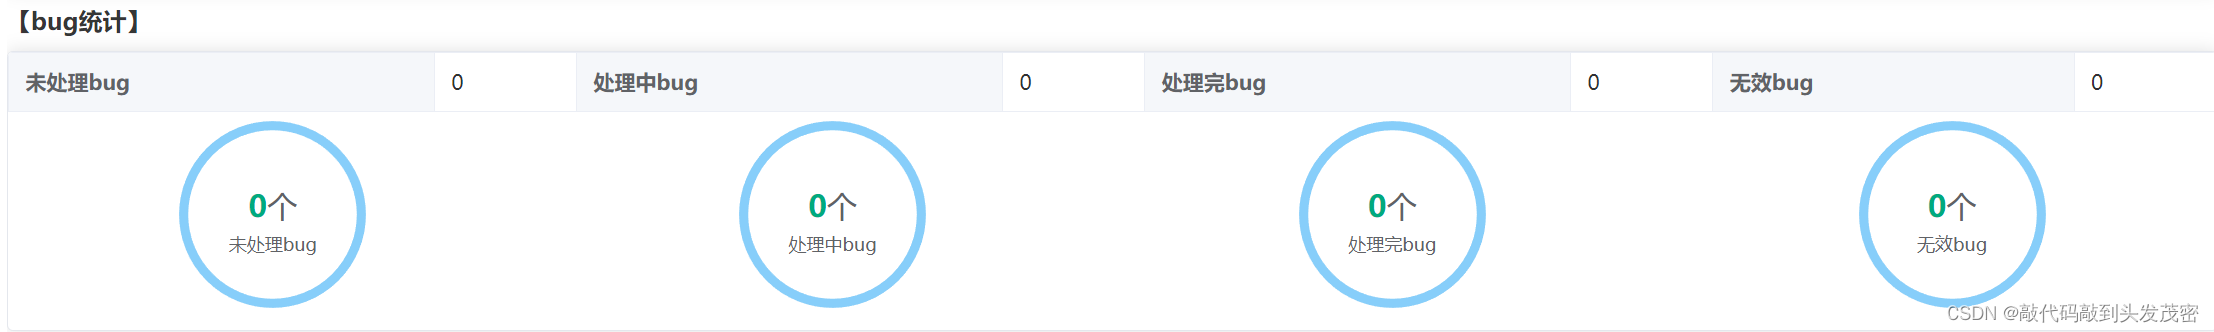
5、bug统计
<div class="title">【bug统计】</div>
	<el-card body-style="padding:0">
		<el-descriptions border column="4">
		<el-descriptions-item v-for='(item,index) in proinfo.bugs' :key="index" :label="item.name">{{item.value}}</el-descriptions-item>
  		</el-descriptions>
	</el-card>

<div class="title">【bug统计】</div>
	<el-card body-style="padding:0">
		<el-descriptions border column="4">
		<el-descriptions-item v-for='(item,index) in proinfo.bugs' :key="index" :label="item.name">{{item.value}}</el-descriptions-item>
  		</el-descriptions>

		<el-row :gutter="20">
			<el-col :span="6" v-for="(item,index) in proinfo.bugs" :key="index">
				<div class="info_chart">
					<el-progress type="circle" :percentage="100" color="#87CEFA">
						<template #default>
							<span class="percentage-value">
								<b style="color:#00aa7f">{{item.value}}</b>
								<span>个</span>
							</span>
							<span class="percentage-label">{{item.name}}</span>
						</template>
					</el-progress>
				</div>
			</el-col>
			<el-col :span="4"><div class="info_chart" /></el-col>

		</el-row>
	</el-card>
<style scpped>
	/* 项目标题样式 */
	.pro_title{
		height: 50px;
		background: #ececeb;
		text-align: center;
		font: bold 28px/50px '微软雅黑';
		color: rgb(21, 192, 135);
	}
	/* 小标题样式 */
	.title{
		/* 加粗 */
		font-weight: bold;
		line-height: 40px;
		color: #363636;
	}
	/* 图表的样式 */
	.info_chart{
		background: rgb(255, 255, 255);
		/* height: 150px; */
		margin: 5px;
		text-align: center;
		padding: 10px,0px;
	}

	.percentage-value {
		display: block;
		margin-top: 10px;
		font-size: 20px;
		}
		.percentage-label {
		display: block;
		margin-top: 10px;
		font-size: 12px;
	}
</style>
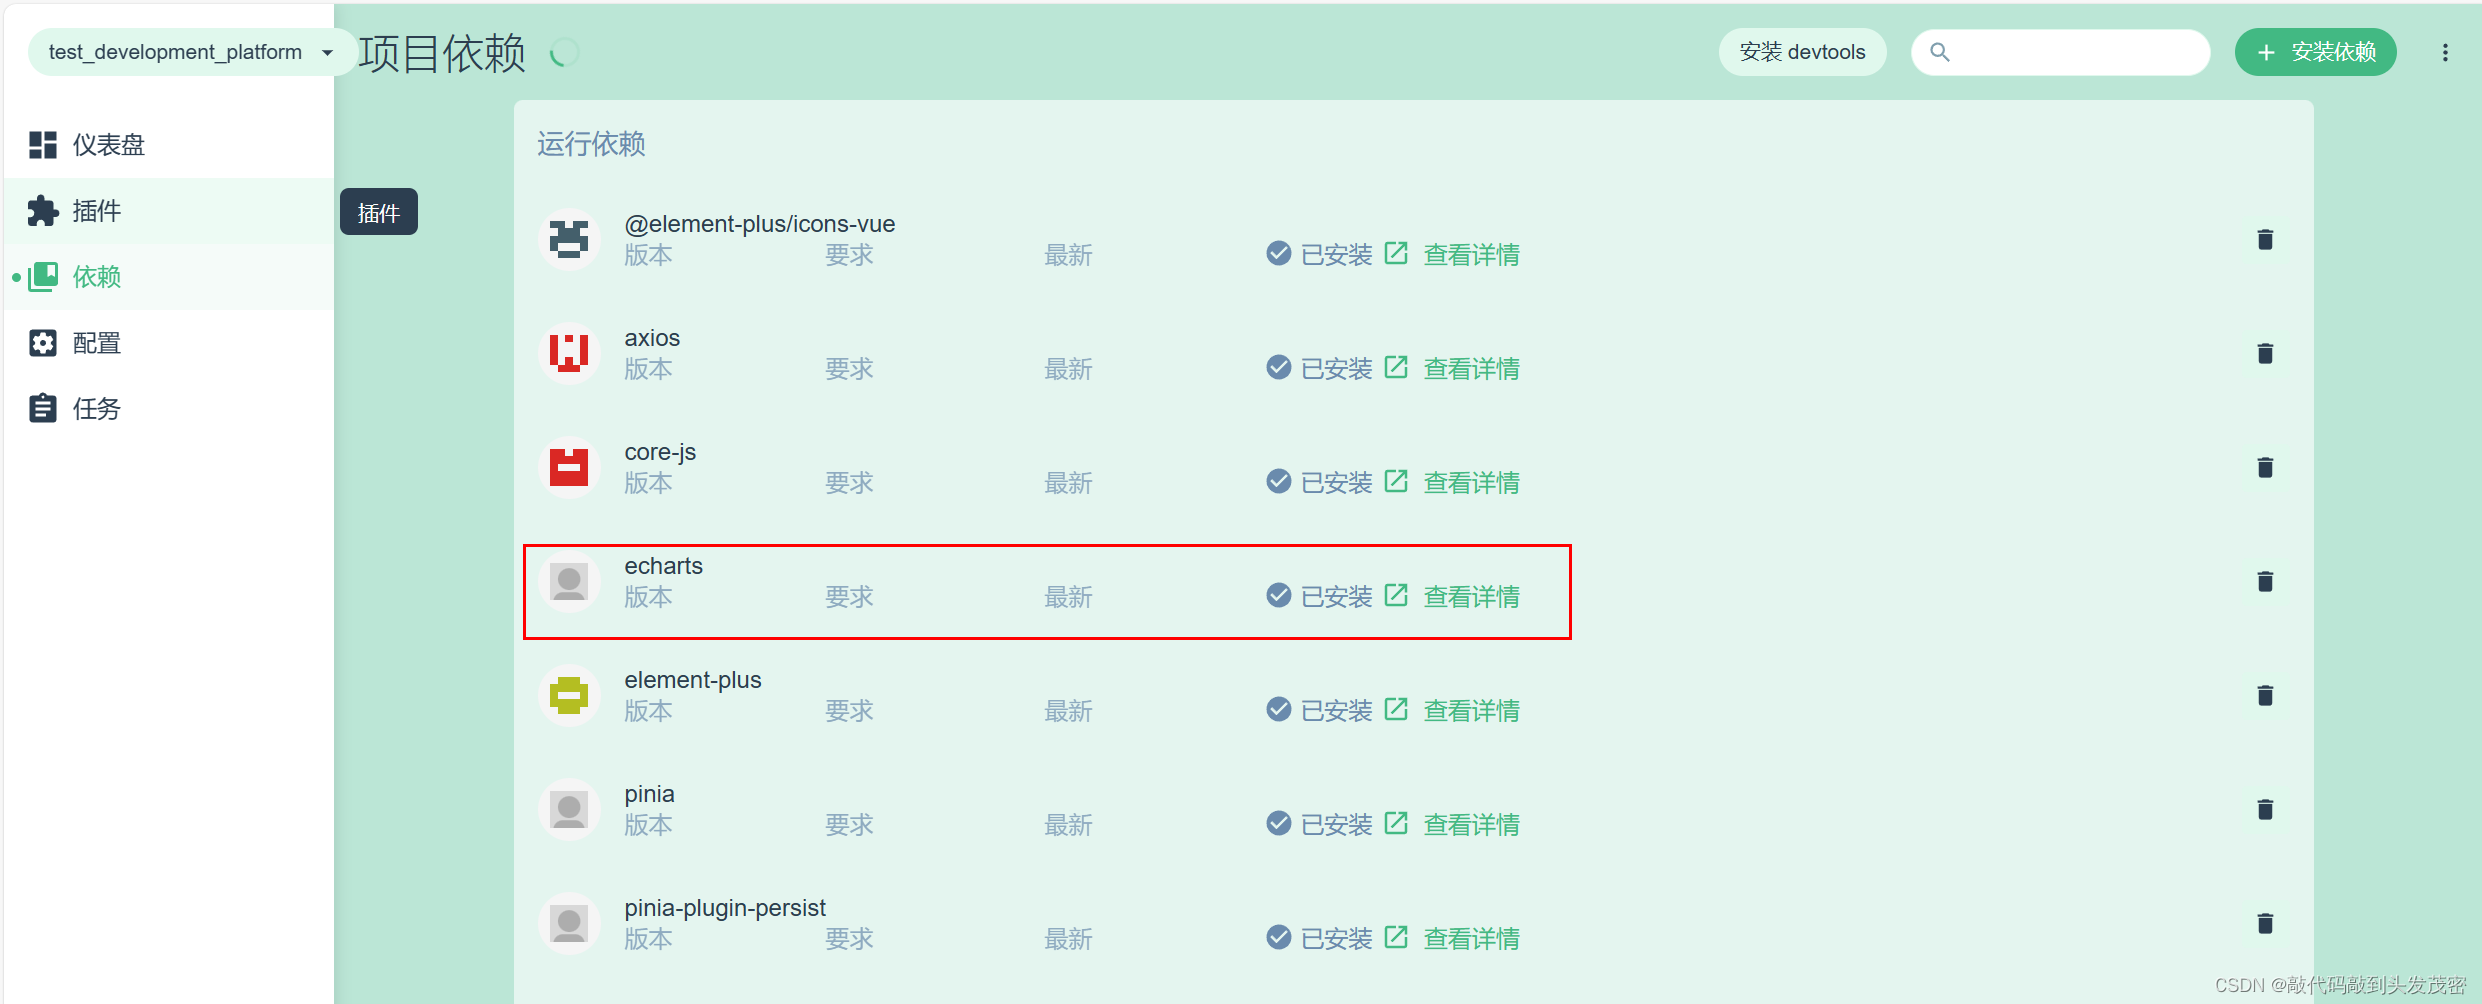
四、echarts使用
1、安装
2、折线图的使用
// 编写图表工具函数
import * as echarts from 'echarts';
import { useFormLabelWidth } from 'element-plus/es/components/form/src/utils';

export default{
    // 折线图
    chart1(ele,label,datas){
        // ele:渲染图标的元素(盒子)
        // label:x轴的刻度文字
        // datas:数据
        // 初始化一个图表对象
        const myChart = echarts.init(ele);
        const option={
            // 编写图标的配置
            xAxis: {
                type: 'category',
                boundaryGap: false,
                data: label
            },
            yAxis: {
                type: 'value'
            },
            series: [
                {
                data: datas,
                type: 'line',
                areaStyle: {}
                }
            ]
        };
        // 渲染图表
        option && myChart.setOption(option);

    },


 406
406


 被折叠的 条评论
为什么被折叠?
被折叠的 条评论
为什么被折叠?
 到【灌水乐园】发言


